Collection of North America PowerPoint Maps: Elevate Your Global Presentations


Type: PowerPoint Maps template
Category: North America
Sources Available: .pptx
Product ID: PM00078
Template incl.: 14 editable slides
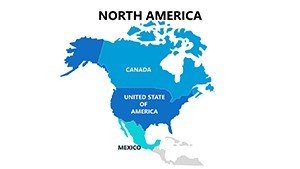
Imagine standing before a boardroom full of executives, unveiling a strategic expansion plan that spans from the bustling streets of New York to the vast prairies of Alberta. With our Collection of North America PowerPoint Maps template, you can transform complex geographical data into compelling visual stories that resonate and inspire action. This 14-slide powerhouse is meticulously crafted for architects, urban planners, business leaders, and educators who need to showcase regional insights with precision and flair. Whether you're pitching a cross-border infrastructure project or mapping out market demographics, these maps provide the clarity and customization to make your points unforgettable.
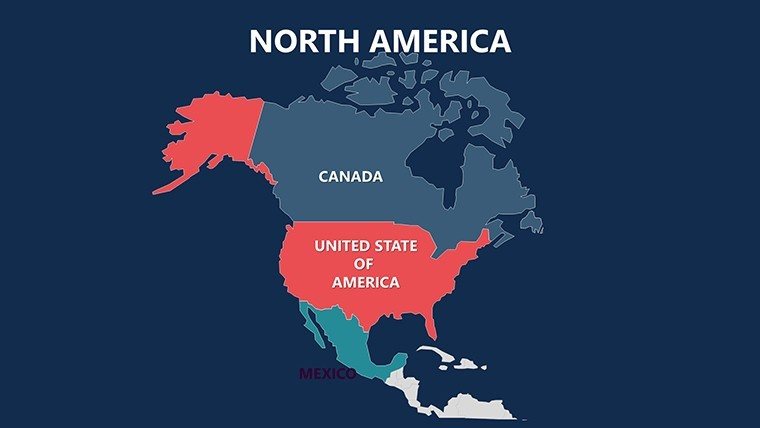
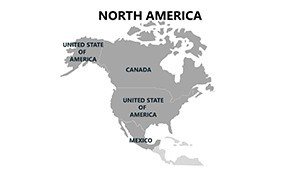
Designed with the modern presenter in mind, this template dives deep into the heart of North America, covering the United States, Canada, Mexico, and their intricate states, provinces, and territories. Each slide is fully editable, allowing you to tweak colors to match your brand palette, add data overlays for sales forecasts, or highlight key locations like major ports for logistics planning. No more struggling with clunky default PowerPoint tools - these vector-based maps scale seamlessly without losing quality, ensuring your visuals remain sharp whether projected on a massive screen or shared in a digital report.
Unlock the Power of Detailed Regional Mapping
At the core of this template lies its versatility for real-world applications. For architecture firms tackling multinational projects, consider using the continent-wide overview slide to illustrate site selections across borders, aligning with AIA standards for sustainable urban development. Overlay zoning data on U.S. state maps to demonstrate compliance with environmental regulations, or pinpoint Canadian provinces for timber sourcing in eco-friendly builds. The Mexico-focused slides are perfect for highlighting maquiladora zones in manufacturing pitches, showing how your designs integrate with local economies.
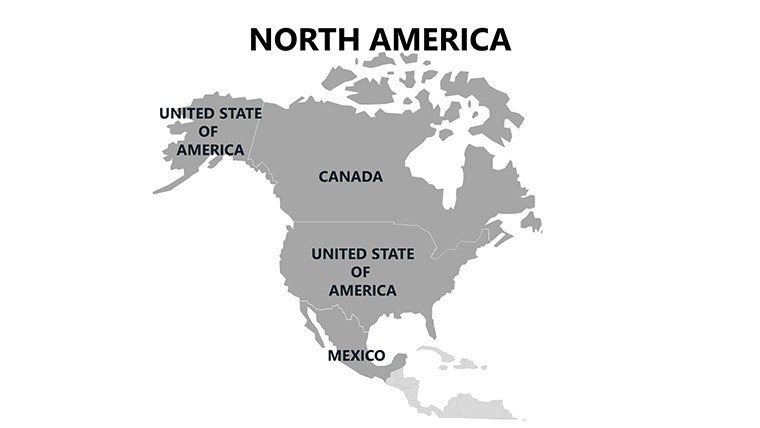
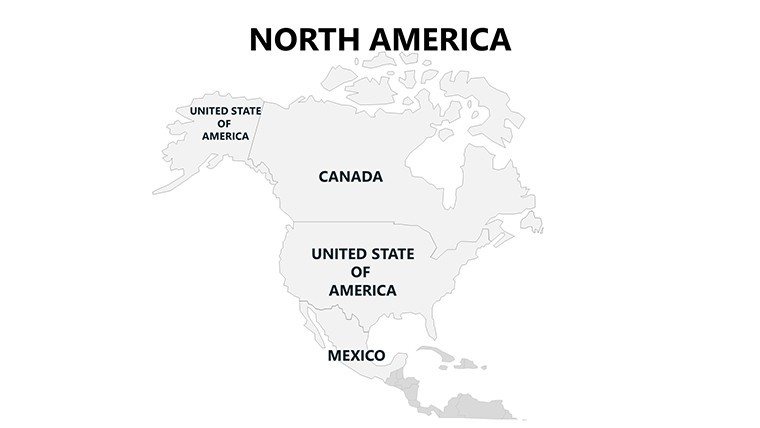
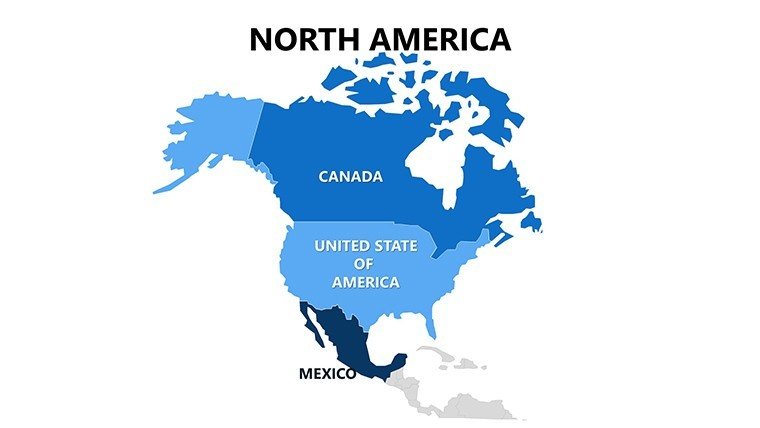
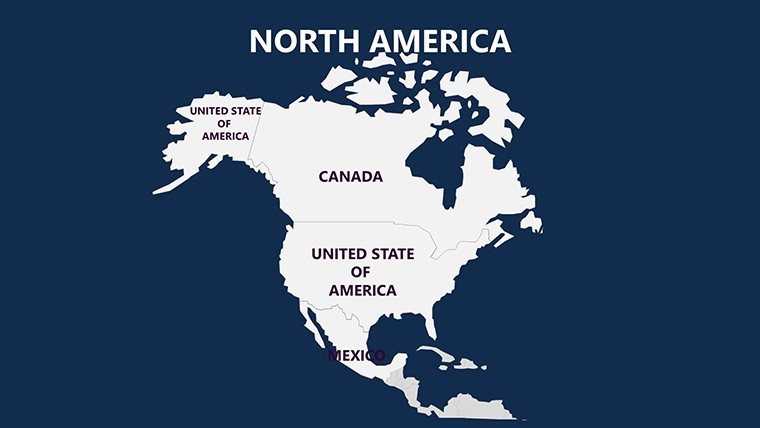
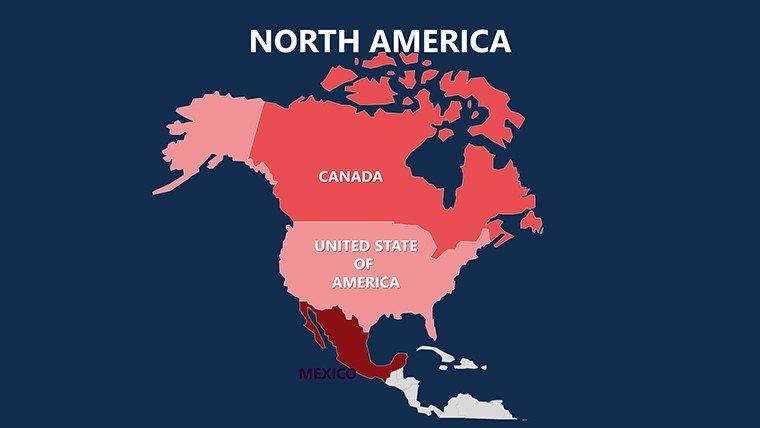
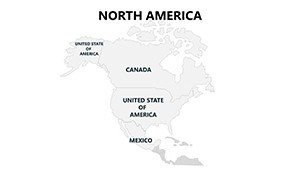
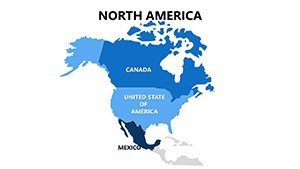
- Slide 1-3: Continent Overview – Start broad with a full North American map, ideal for setting the stage in investor meetings. Add icons for trade routes or population densities to underscore economic opportunities.
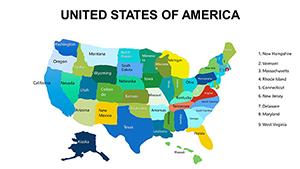
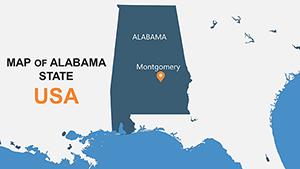
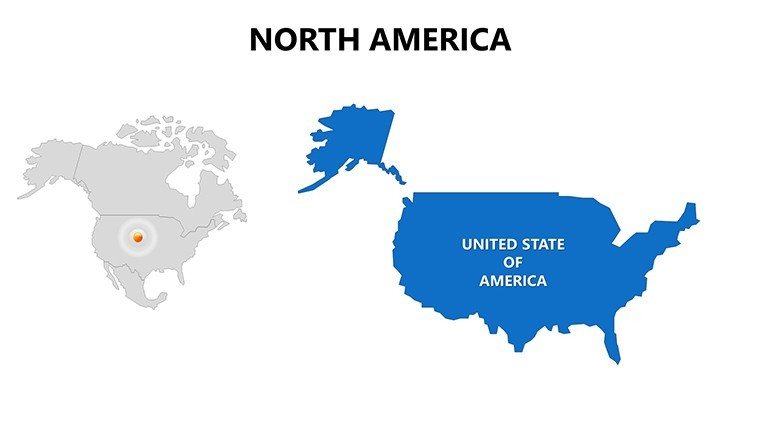
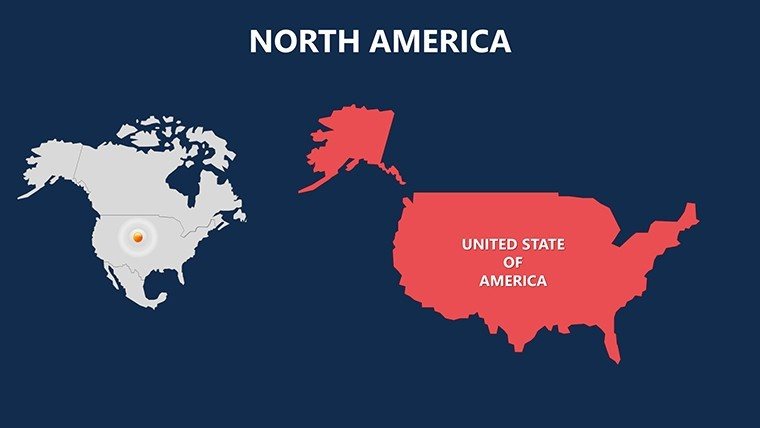
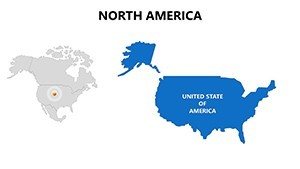
- Slide 4-8: United States Breakdown – Dive into state-level details, from California's tech hubs to Texas energy sectors. Architects can use these to map out seismic zones for resilient structure planning.
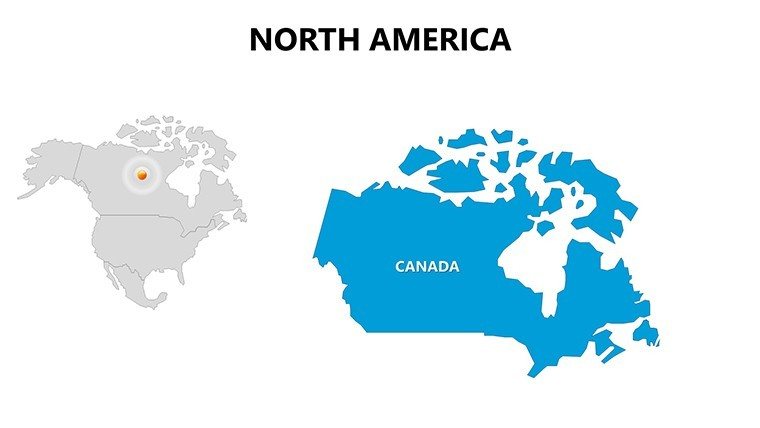
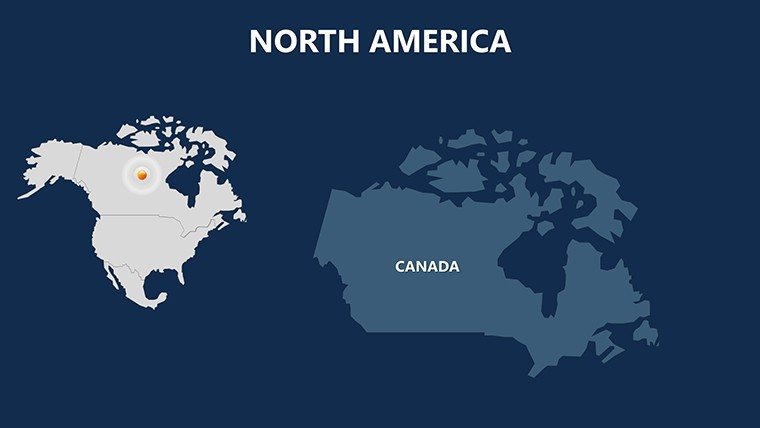
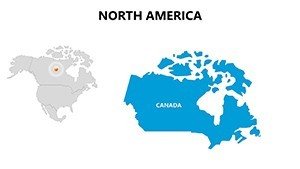
- Slide 9-11: Canada Provinces – Highlight resource-rich areas like Ontario's manufacturing belts or British Columbia's coastal developments, essential for cross-continental supply chain visuals.
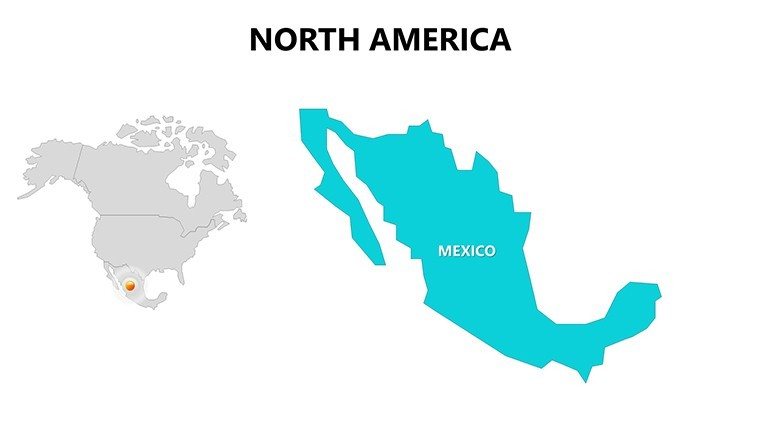
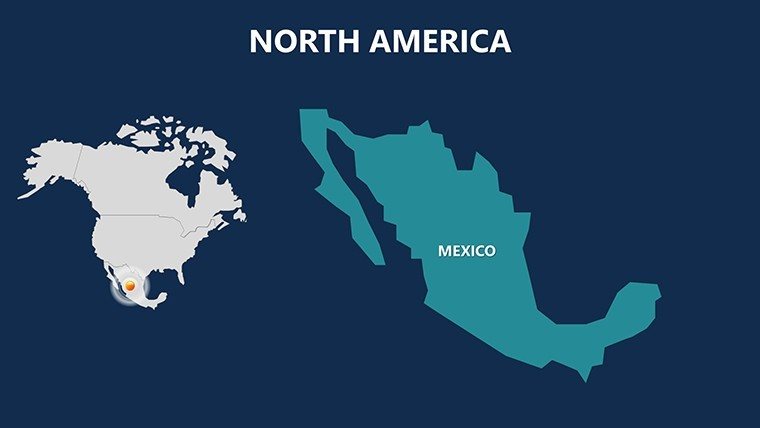
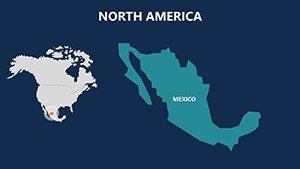
- Slide 12-14: Mexico and Territories – Focus on key regions for tourism or agriculture, with editable labels to insert project timelines or budget breakdowns.
These slides aren't just static images; they're dynamic tools that integrate seamlessly with PowerPoint's animation features. Animate boundaries to reveal phased development plans, or use hyperlinks to jump to detailed case studies, keeping your audience engaged throughout.
Customization Tips for Professional Polish
To maximize impact, start by selecting a cohesive color scheme - perhaps earthy tones for environmental projects or vibrant blues for oceanic trade routes. Our template supports one-click color changes, so align with your firm's branding without hassle. For urban planners, incorporate LSI elements like demographic heatmaps by layering simple charts over the maps, turning raw data into actionable insights. A real-world example: A Chicago-based architecture team used similar maps to win a bid for a binational bridge project, visualizing traffic flows and economic benefits in under 10 minutes of editing.
Real-World Use Cases: From Boardrooms to Classrooms
In business, these maps shine for market analysis presentations. Picture a sales director using the U.S. state slides to plot regional revenue growth, correlating it with infrastructure investments - directly tying into ROI discussions. Educators appreciate the simplicity for geography lessons, where students can interact with editable provinces to explore cultural diversities, fostering interactive learning aligned with NGSS standards.
For travel and tourism pros, the template's overlays allow mapping scenic routes from the Rockies to the Yucatan, complete with pin drops for hotspots. Researchers in environmental science might layer climate data over Canadian territories to discuss conservation efforts, providing evidence-based narratives that sway policymakers.
- Step 1: Import Your Data – Copy-paste stats into text placeholders; the maps auto-adjust for balance.
- Step 2: Enhance with Icons – Drag-and-drop themed icons (included) for landmarks or risks, like flood zones in Gulf states.
- Step 3: Animate for Flow – Sequence reveals to guide viewers from macro to micro views, building suspense in your pitch.
- Step 4: Export and Share – Save as PDF for reports or present live, compatible with PowerPoint 2016+ and Google Slides.
Compared to basic PowerPoint maps, which often look dated and rigid, this template offers themed vectors that save hours of design time. Professionals report up to 40% faster prep, allowing focus on storytelling rather than formatting.
Why Choose This Template for Your Next Project?
Beyond aesthetics, it's about trust and expertise. Built by design veterans familiar with geospatial tools like ArcGIS, these maps ensure accuracy for high-stakes scenarios. Whether you're an architect mapping sustainable cities or a marketer targeting NAFTA regions, the benefits are clear: sharper insights, stronger engagement, and winning presentations. Don't settle for generic visuals - customize this template today and watch your ideas take shape across the continent.
Ready to map your success? Download the Collection of North America PowerPoint Maps now and turn geographical challenges into strategic triumphs.
Frequently Asked Questions
How editable are the North America maps in this PowerPoint template?
All 14 slides are fully editable, including colors, labels, and shapes. You can resize elements without distortion thanks to vector graphics, making it simple to adapt for any presentation theme.
Is this template suitable for urban planning presentations?
Absolutely. Architects and planners use it to overlay zoning data, infrastructure routes, and demographic trends, ensuring compliance with standards like those from the American Planning Association.
Does it work with Google Slides?
Yes, the .pptx file imports seamlessly into Google Slides, though some advanced animations may need minor tweaks for optimal performance.
Can I add my own data overlays, like charts or graphs?
Definitely. Integrate PowerPoint's built-in charts over the maps for hybrid visuals, such as sales pie charts pinned to specific states.
What file formats are supported for export?
Export as PPTX, PDF, or images. It's optimized for high-res prints, perfect for brochures or large-format displays.
Are there icons or additional graphics included?
Yes, a library of region-specific icons (e.g., buildings, routes) is embedded, ready to enhance your customizations.