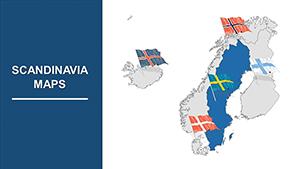
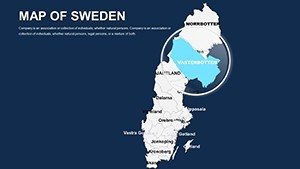
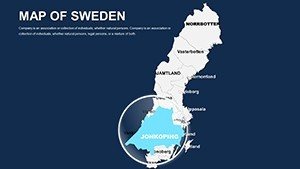
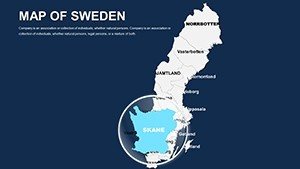
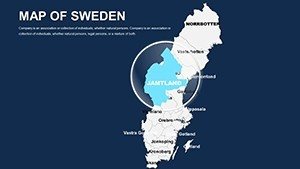
Sweden Map PowerPoint Template | Editable Corporate & Education Slides


Type: PowerPoint Maps template
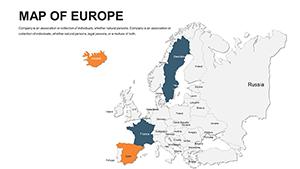
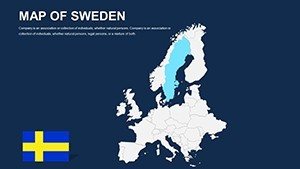
Category: Europe
Sources Available: .pptx
Product ID: PM00040
Template incl.: 48 editable slides
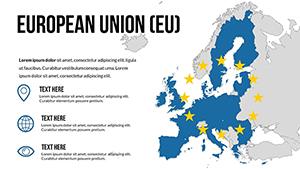
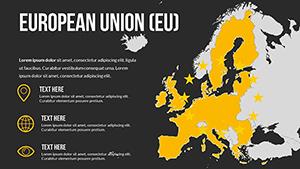
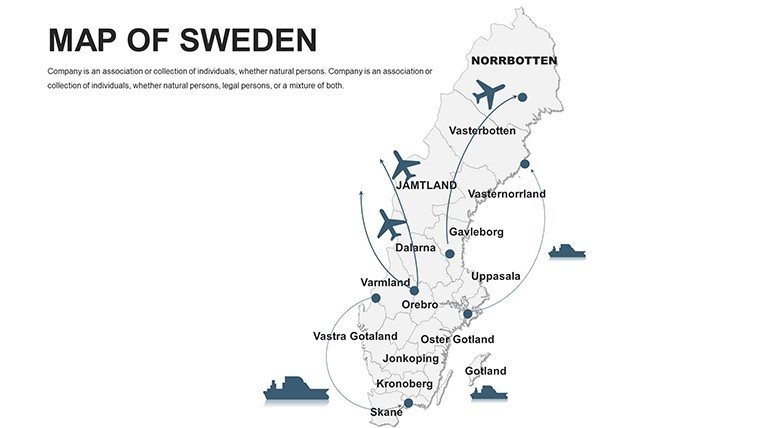
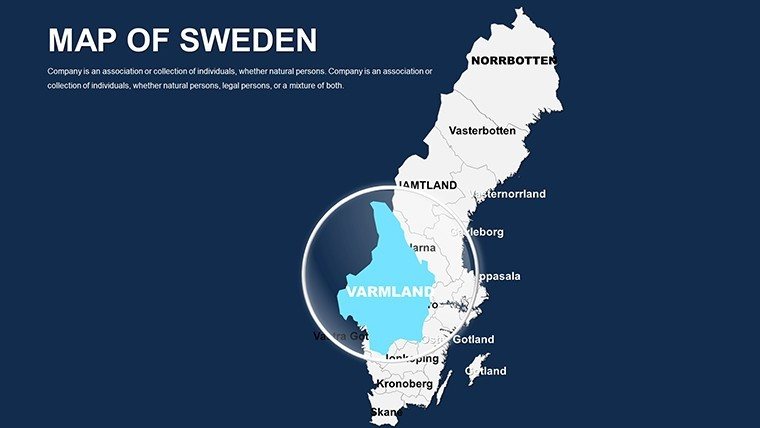
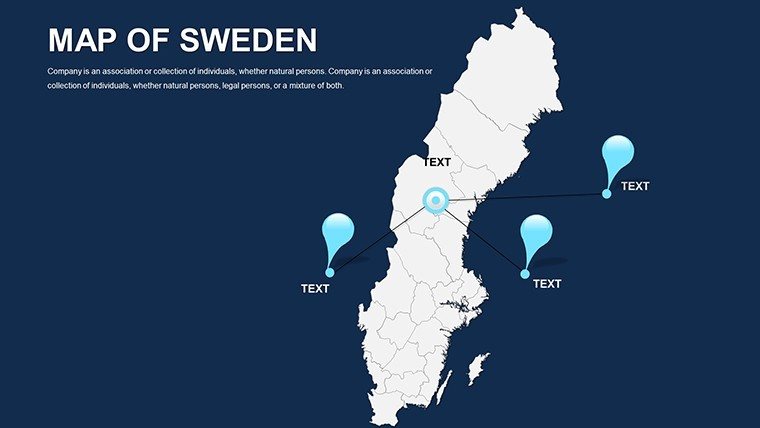
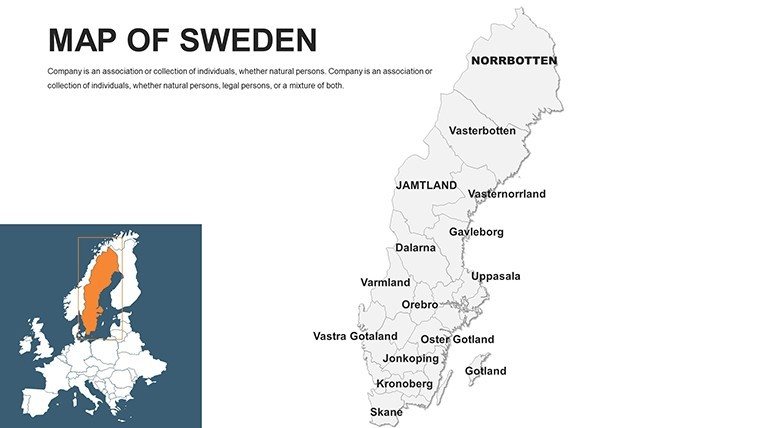
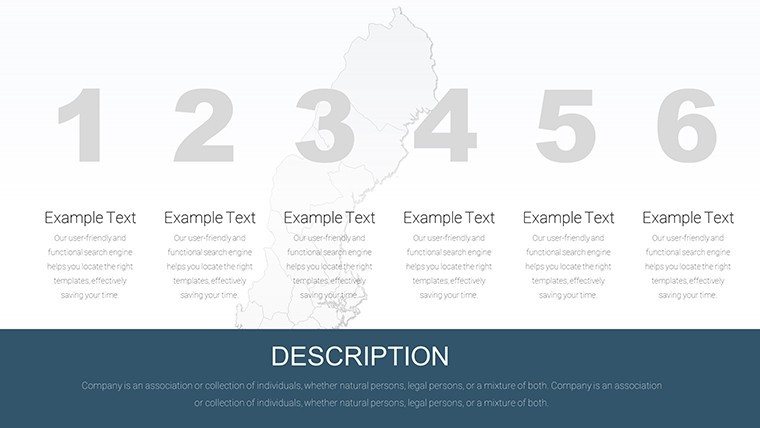
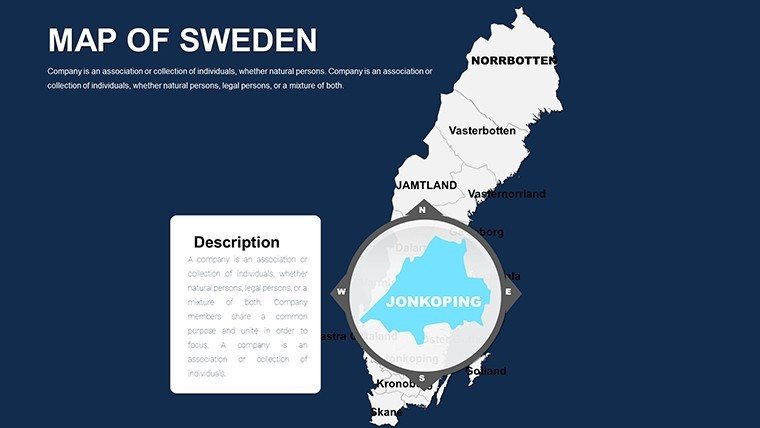
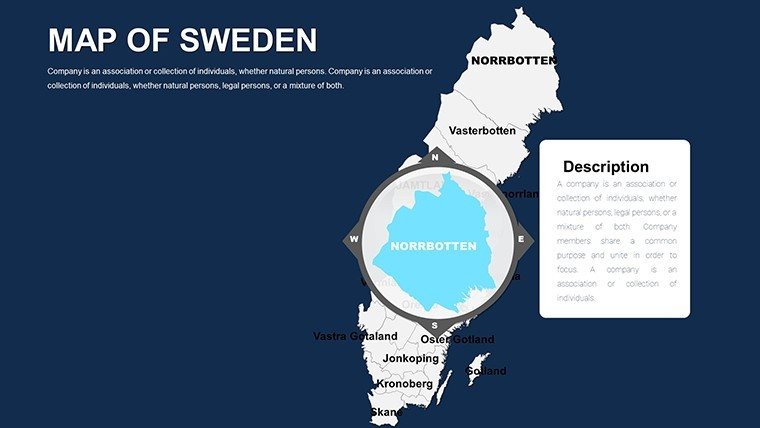
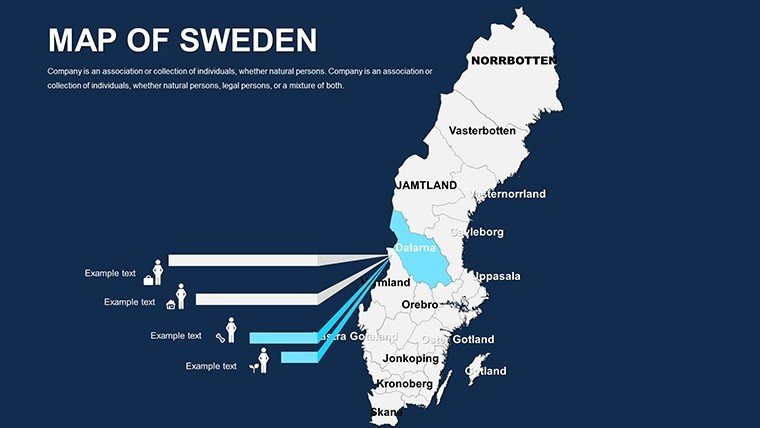
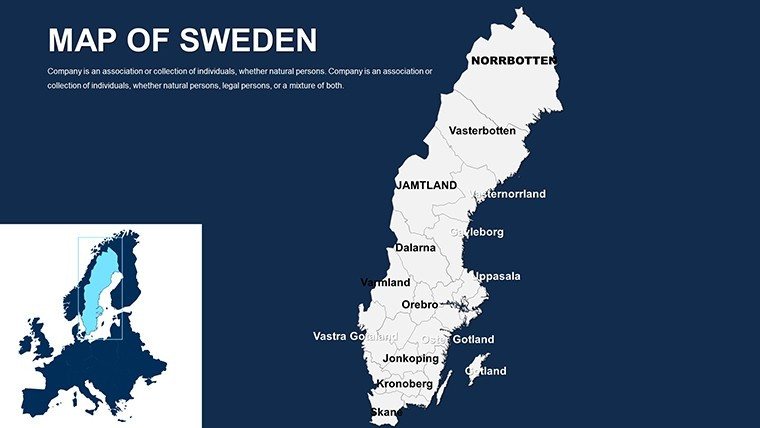
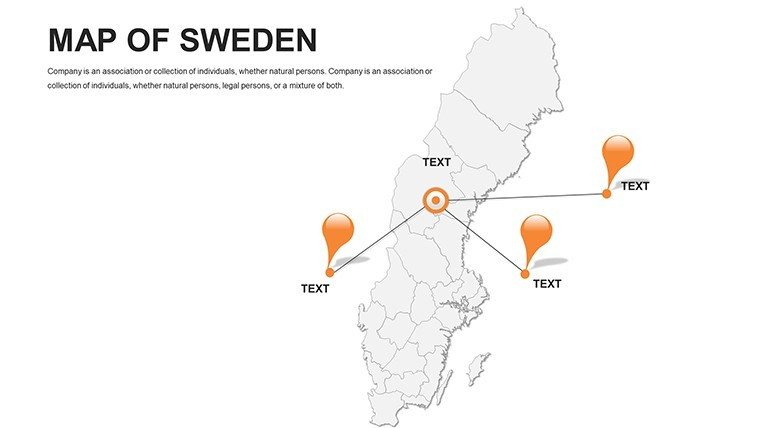
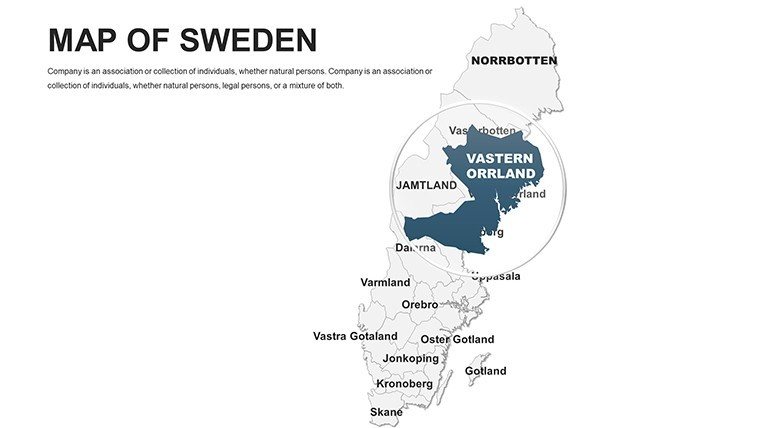
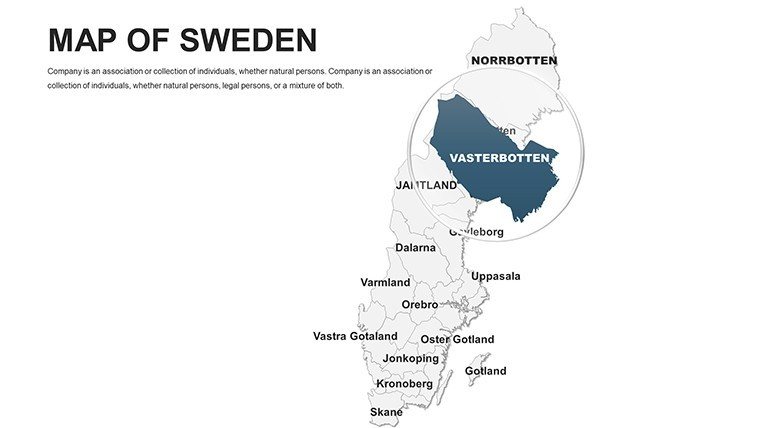
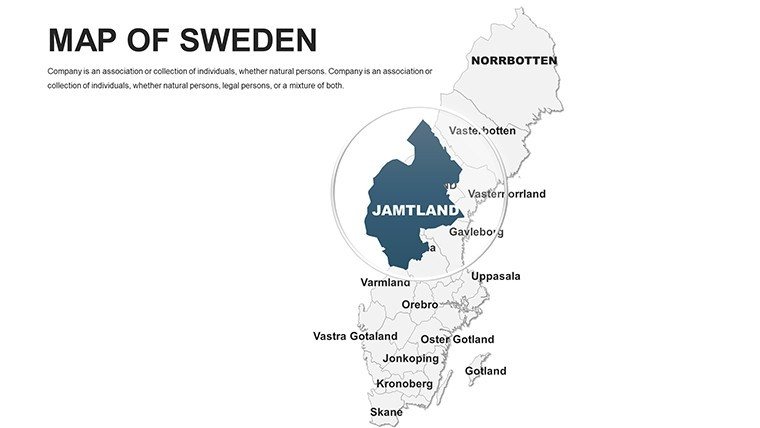
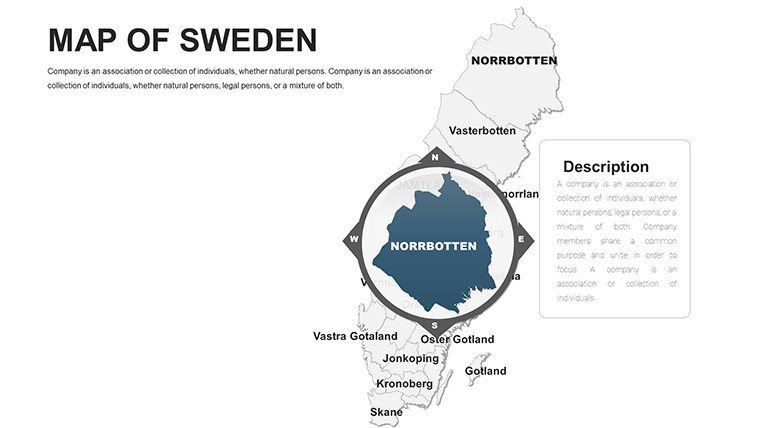
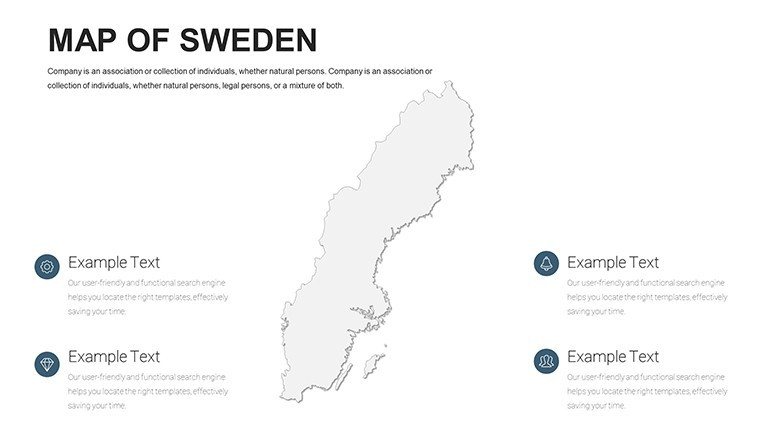
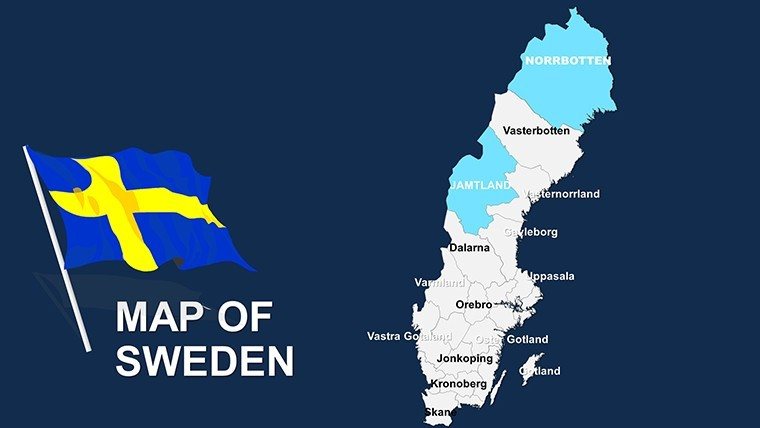
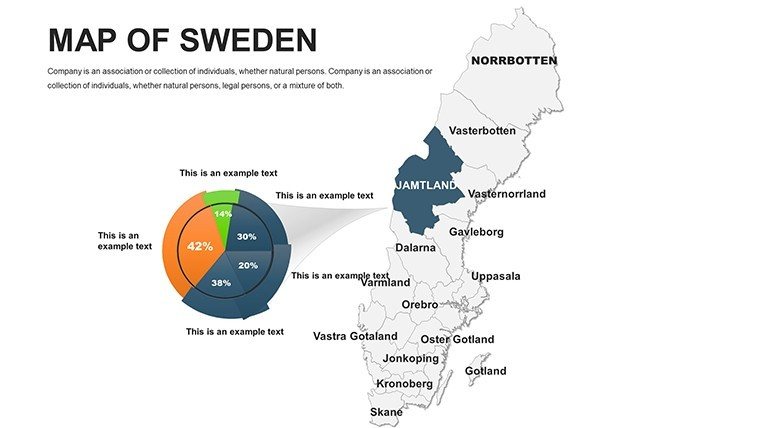
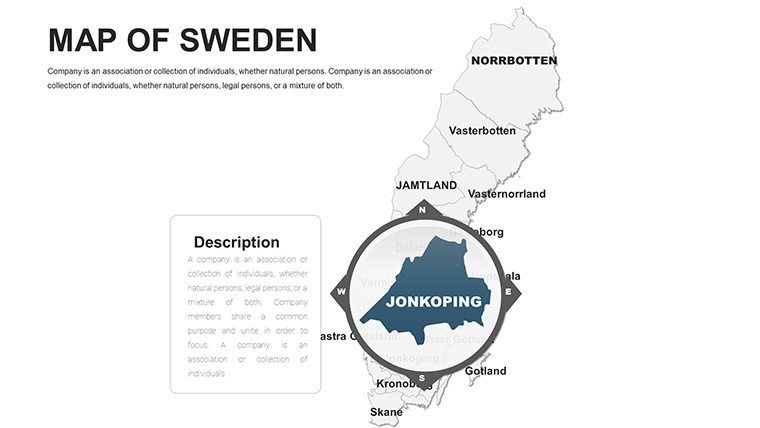
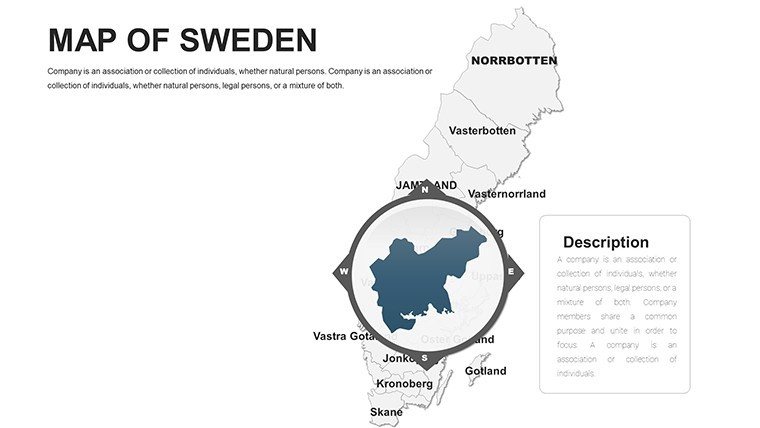
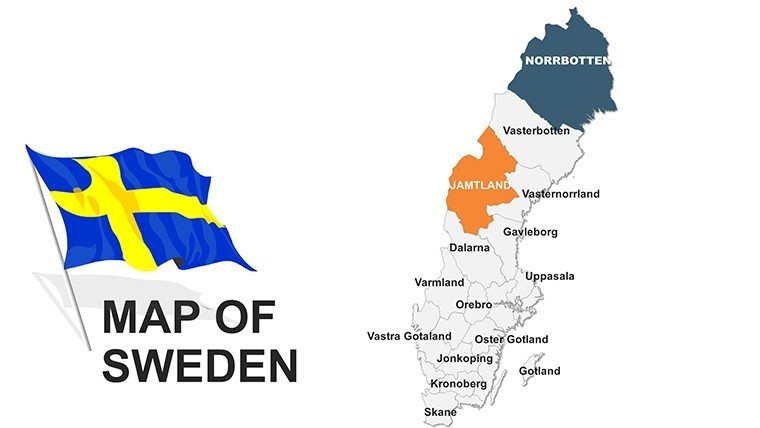
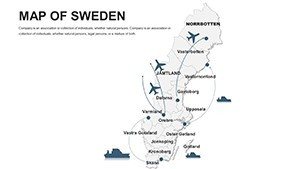
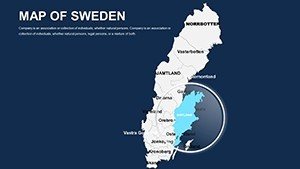
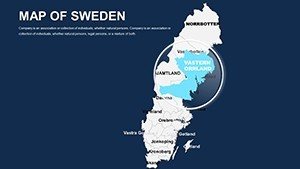
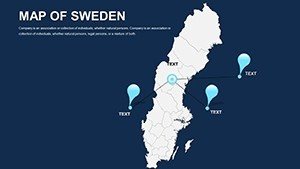
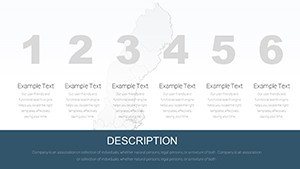
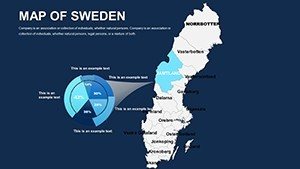
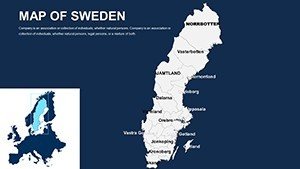
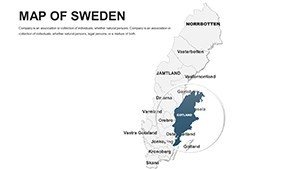
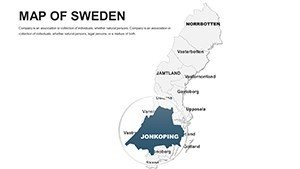
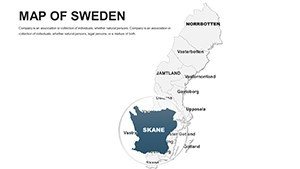
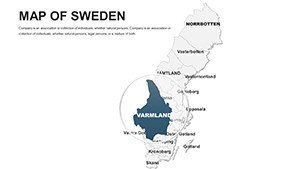
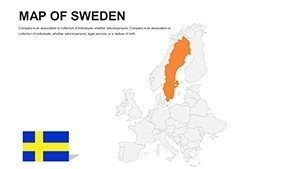
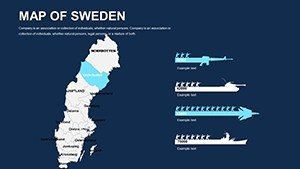
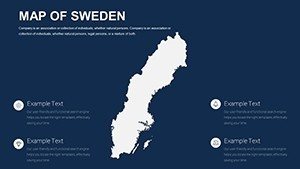
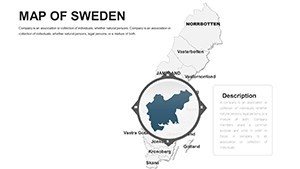
The Sweden Map PowerPoint Template provides sleek, fully editable map slides for corporate and educational presentations. Highlight regions, visualize data, or plan projects with clear and professional slides.
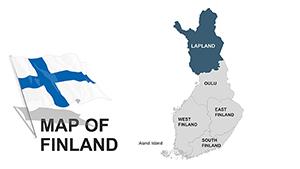
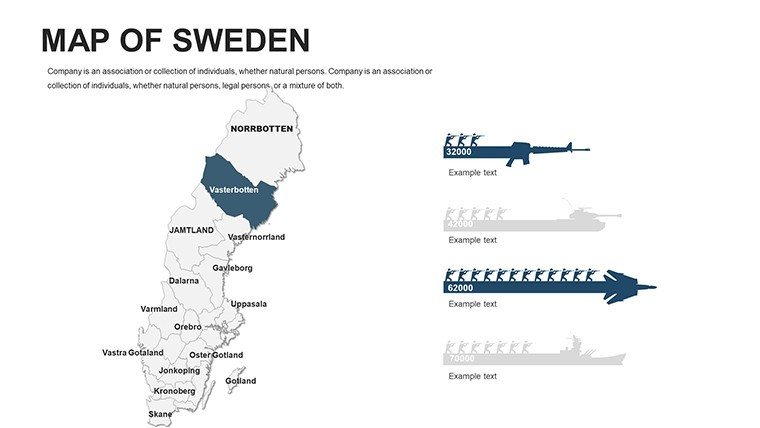
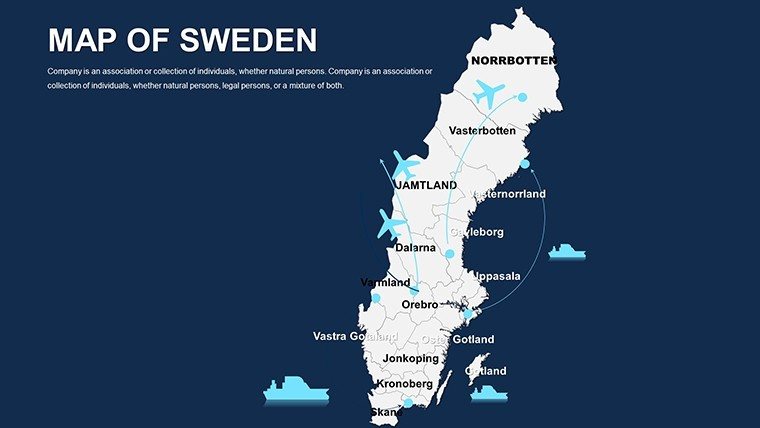
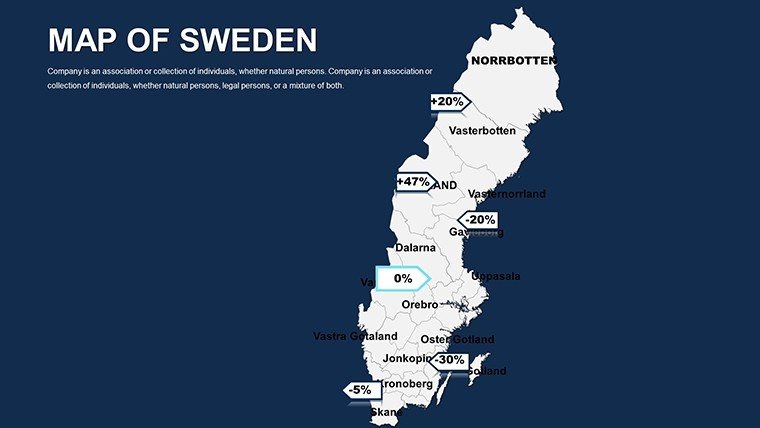
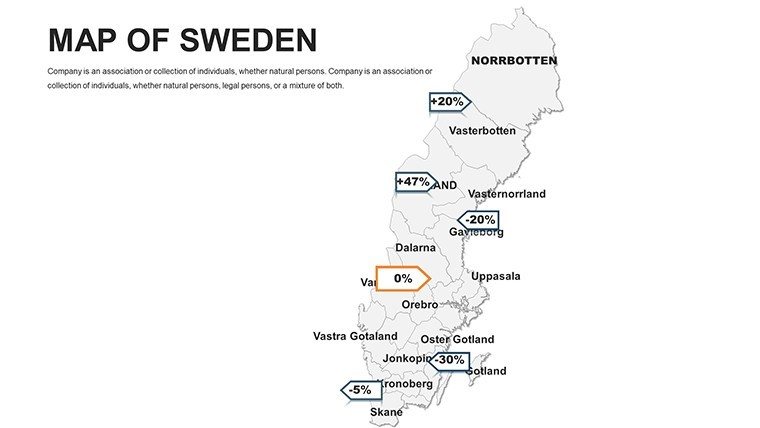
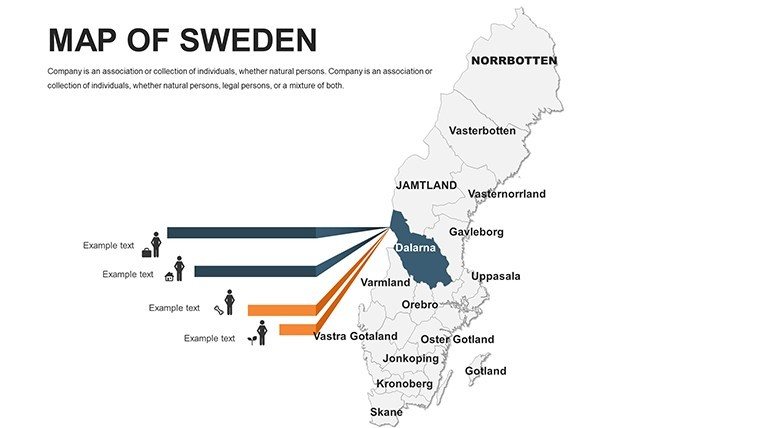
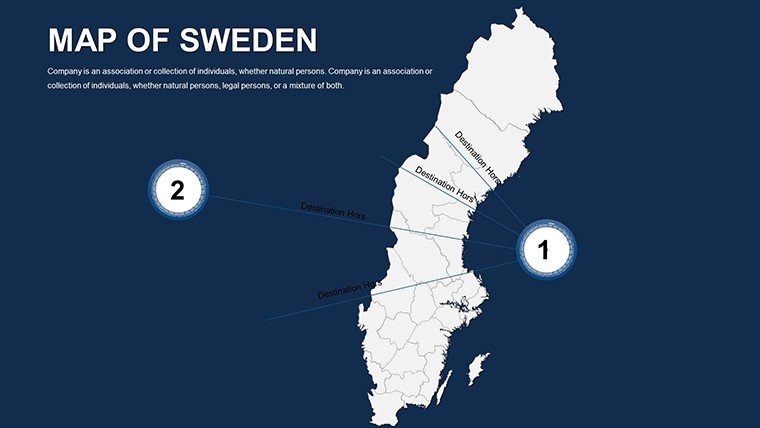
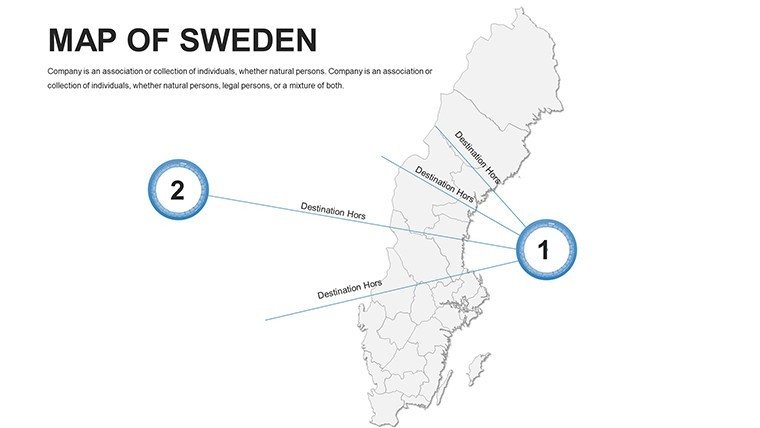
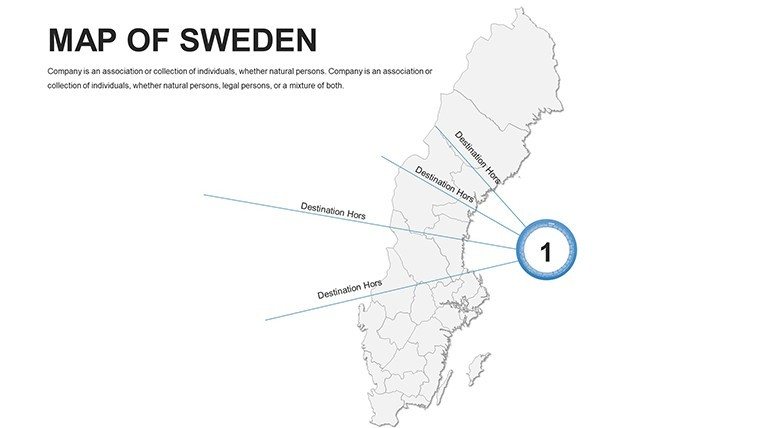
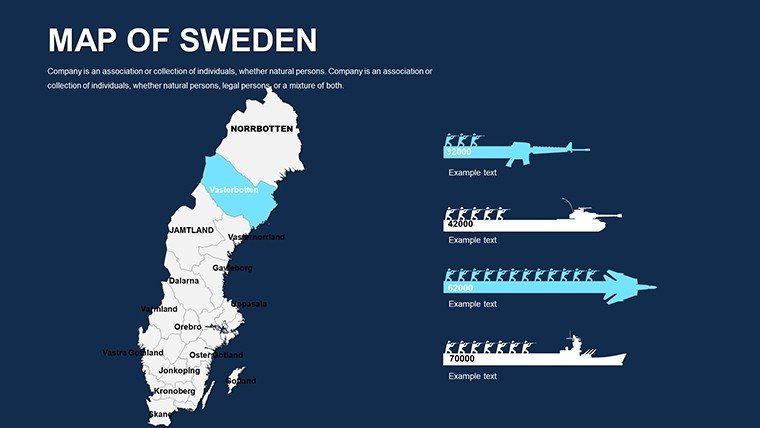
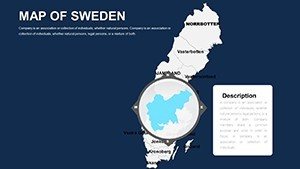
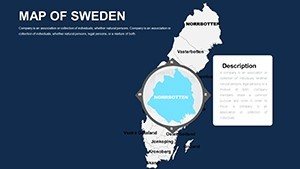
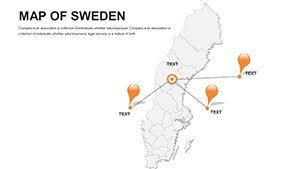
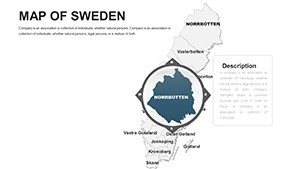
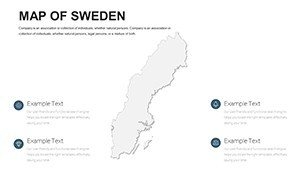
Use this template to present sales territories, demographic data, or strategic plans. Customizable colors, labels, and layouts make it easy to adapt the maps to any business or academic scenario.
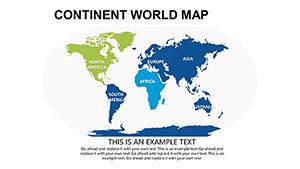
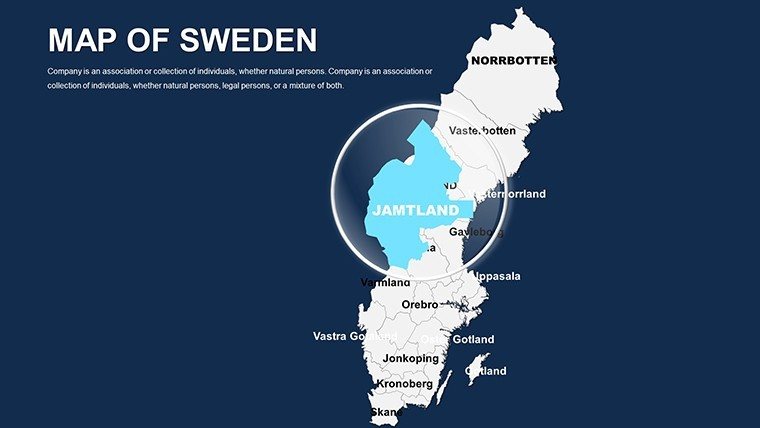
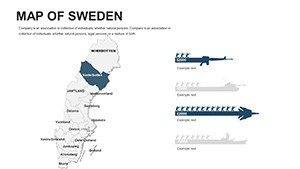
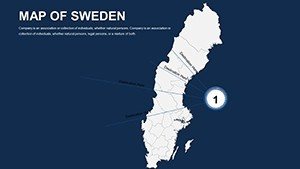
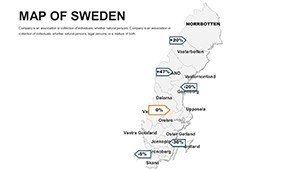
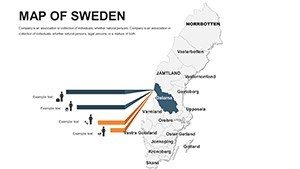
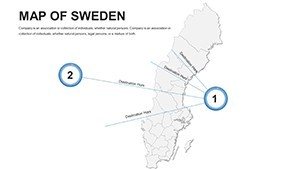
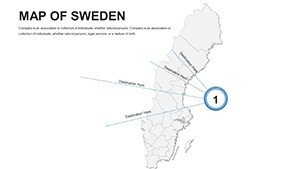
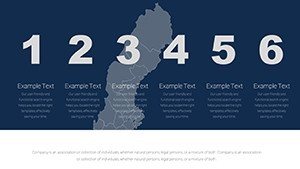
Includes multiple map styles and layouts to compare regions, showcase trends, or combine with charts and graphics for compelling presentations.
Ideal for consultants, educators, and managers aiming for visually impactful presentations.
Start editing instantly and create professional slides effortlessly.Is the Sweden map template fully editable?
Yes, you can fully edit regions, colors, labels, and layouts in PowerPoint to suit your presentation needs.
Can this template be used for corporate reports?
Yes, it's perfect for corporate presentations, business strategy sessions, and market analysis reports.
Is it suitable for educational purposes?
Absolutely, the template is ideal for geography lessons, research presentations, and academic data visualization.