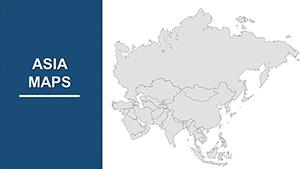
Asia PowerPoint Maps Template - Versatile Visuals
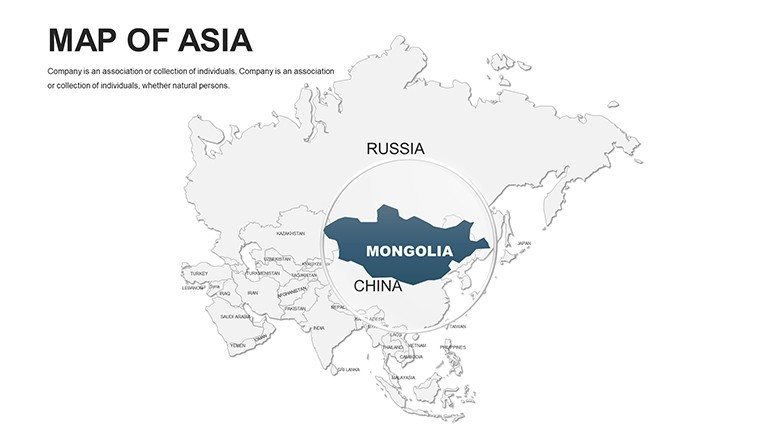

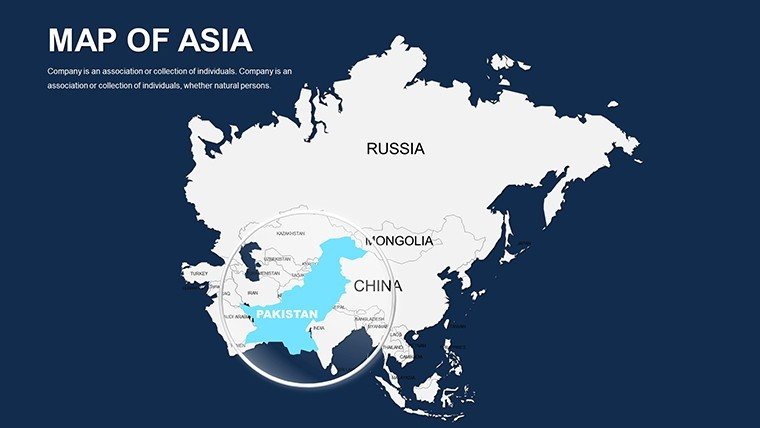


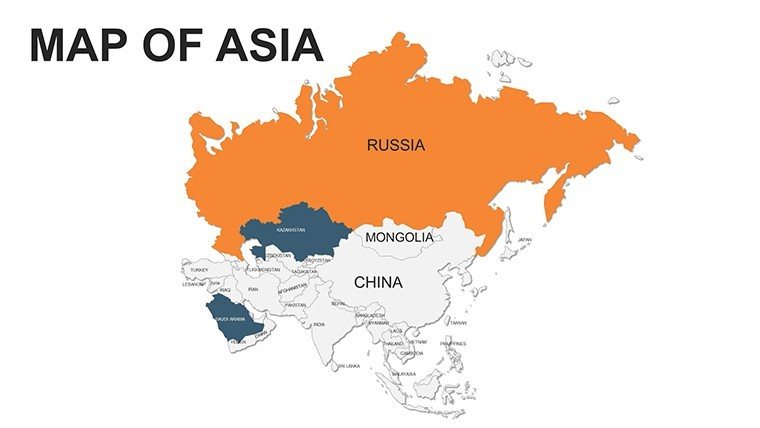


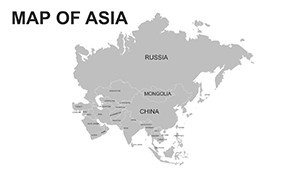


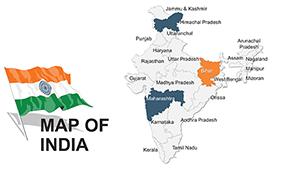
Embark on a visual journey across Asia's vast expanse with our comprehensive PowerPoint Maps Template, featuring 44 editable slides tailored for impactful storytelling. From the skyscrapers of Tokyo to the ancient temples of Angkor Wat, this template captures the continent's diversity, enabling you to present geopolitical shifts, economic booms, or cultural exchanges with unparalleled clarity. Aimed at business executives navigating Asian markets, educators exploring regional histories, and researchers analyzing demographic patterns, it offers a canvas for intricate data visualization. Customize regional overviews of Southeast Asia or detailed country maps like China or India, incorporating themed infographics for topics such as Belt and Road Initiative routes. The benefits are clear: streamline complex information, boost audience engagement with dynamic elements, and adhere to authoritative sources like World Bank data for credibility. This isn't just a template; it's a gateway to presenting Asia's multifaceted narrative, saving you time while amplifying your message's resonance in global contexts.
Diving into Asia's Multifaceted Mapping Capabilities
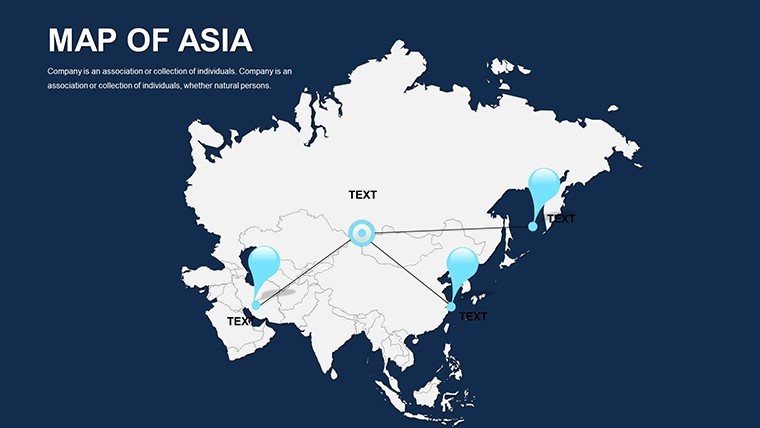
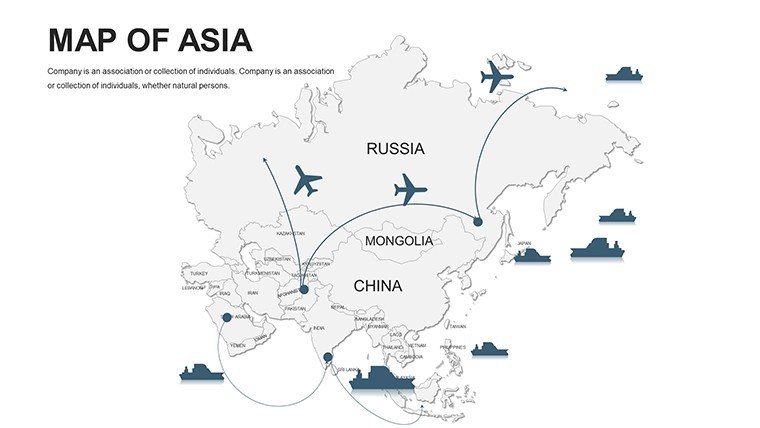
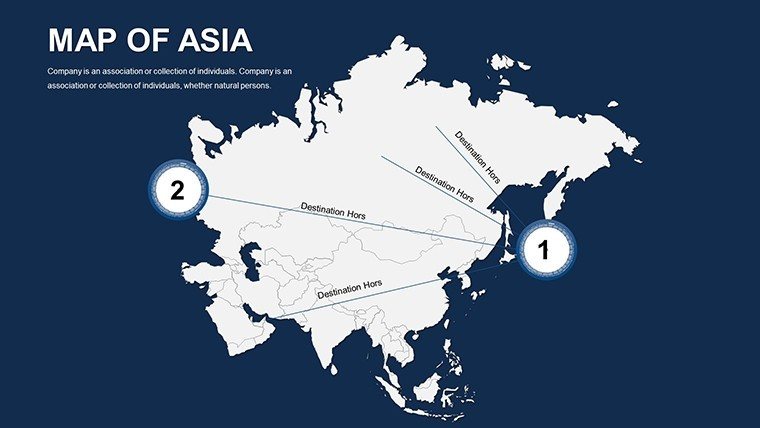
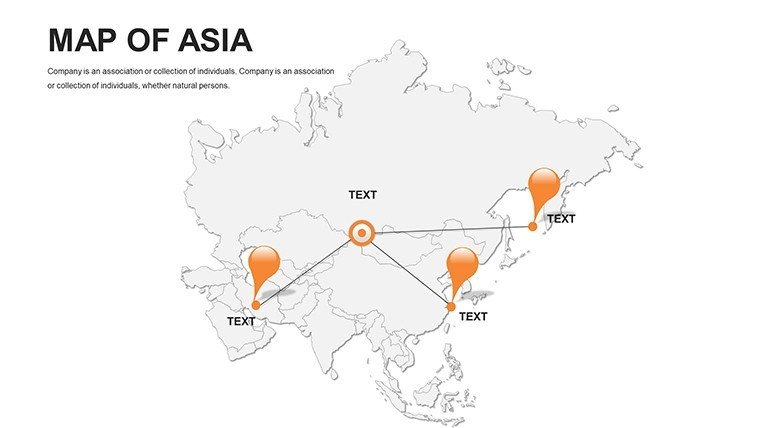
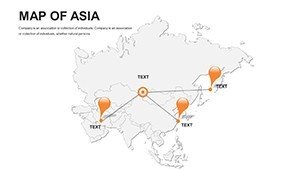
The template's robust design encompasses a spectrum of maps, from continental panoramas to nation-specific details, all fully editable for bespoke applications. For a consultant advising on supply chain optimizations, layer trade routes across the South China Sea, adding nodes for ports in Singapore or Shanghai with flow charts depicting volume trends. Educators can dissect cultural zones, animating migrations from Central Asia to the Middle East, aligned with UNESCO heritage site mappings. Superior to rudimentary tools, these vector maps scale flawlessly, supporting high-res exports for publications. Thematic visualizations tackle issues like urbanization in megacities such as Mumbai, using color gradients for population density per UN Habitat reports. Platform agnostic, it integrates effortlessly with PowerPoint or Google Slides, facilitating cross-team edits on emerging trends like Asia's tech hubs in Seoul or Bangalore.
Essential Features for Dynamic Presentations
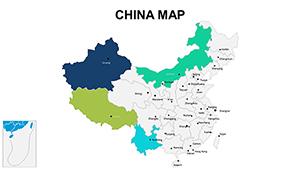
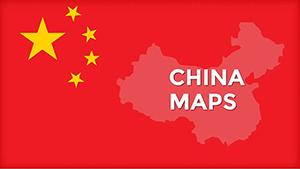
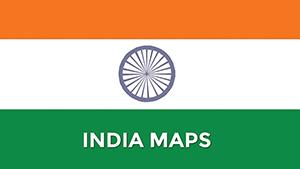
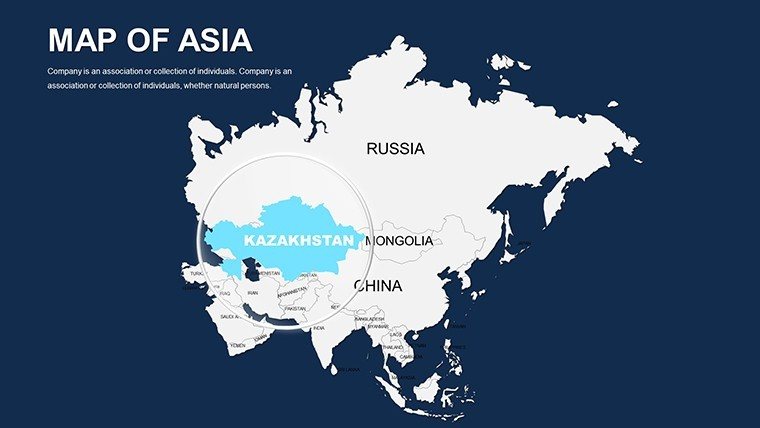
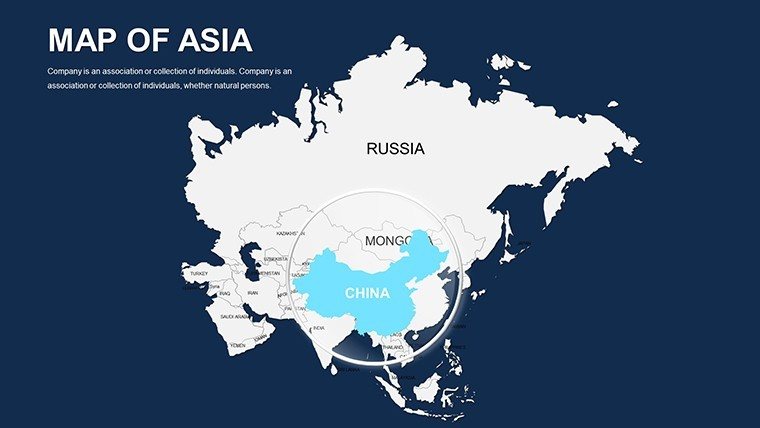
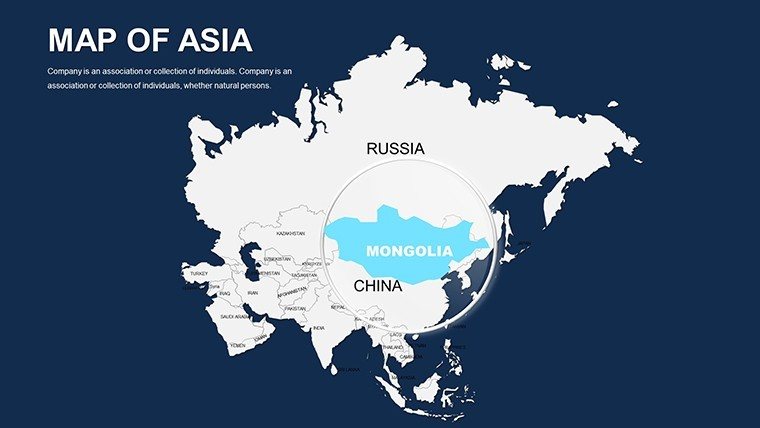
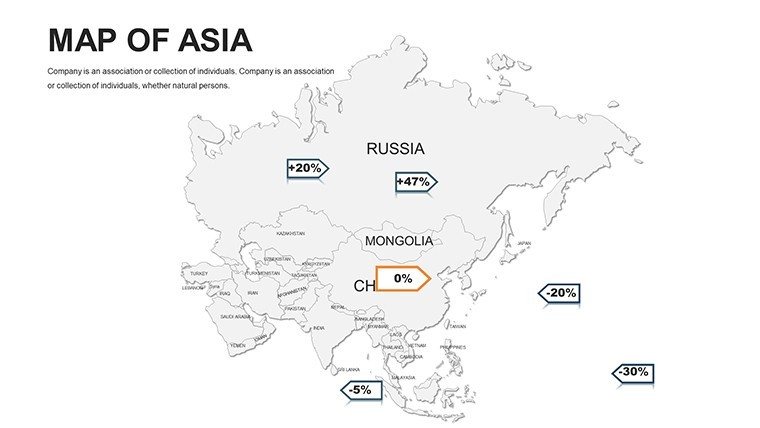
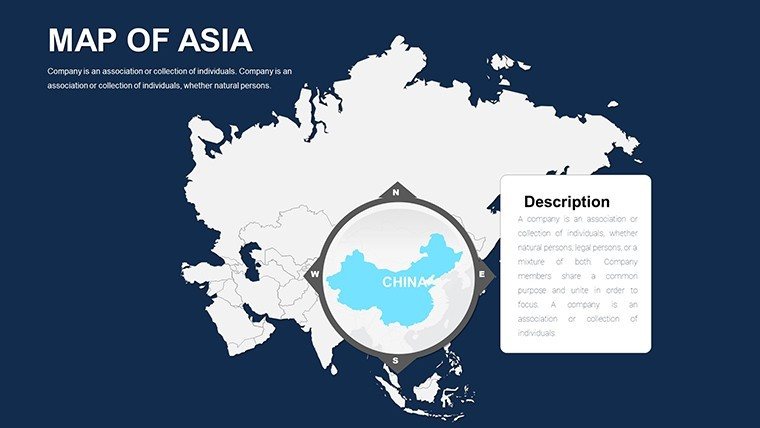
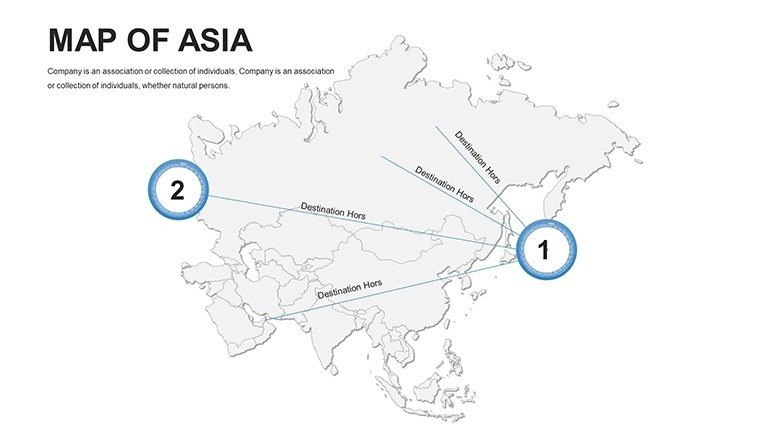
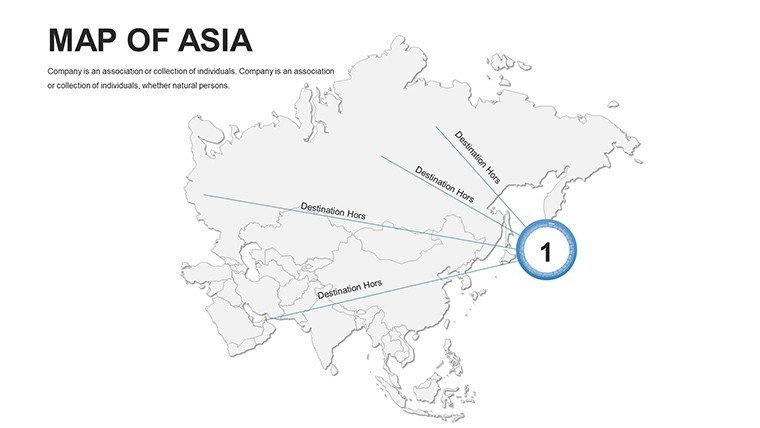
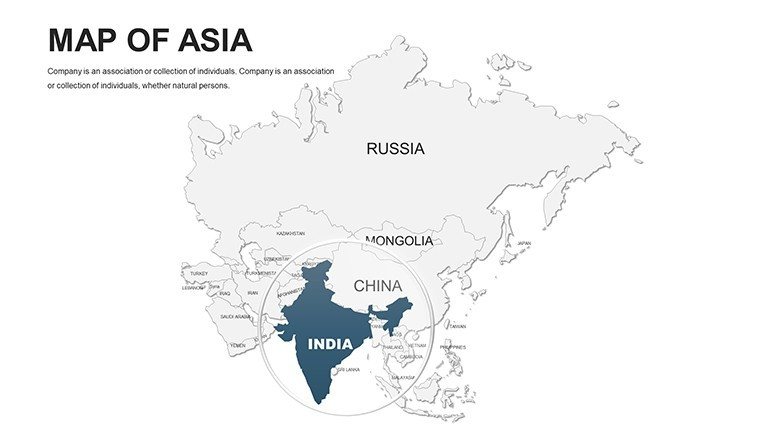
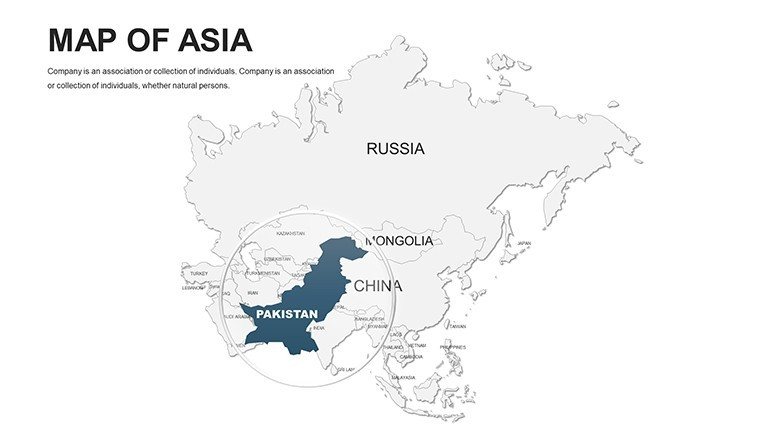
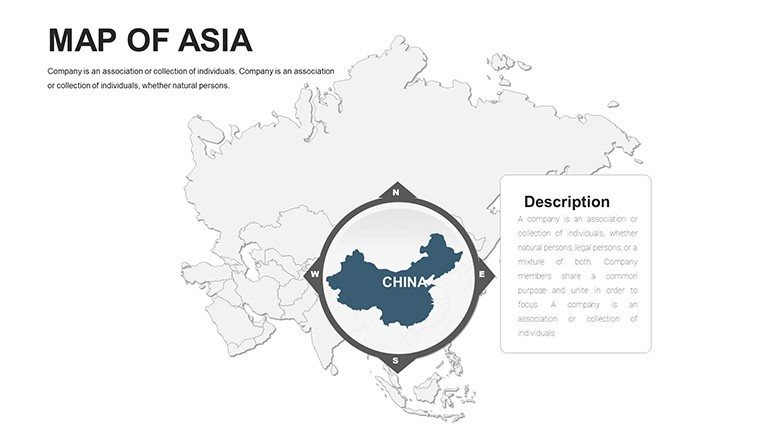
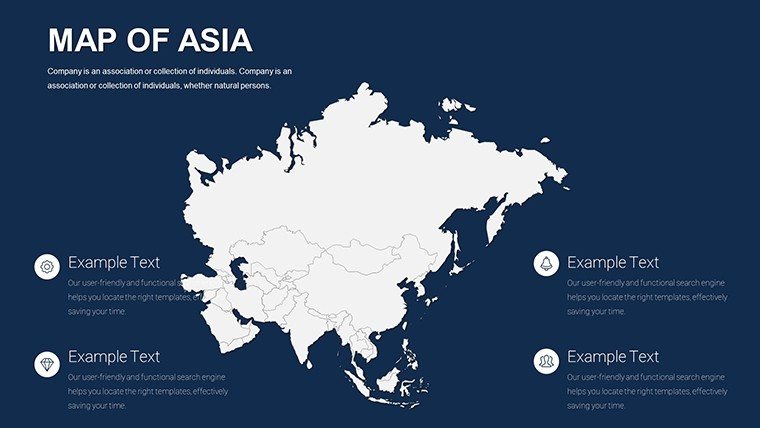
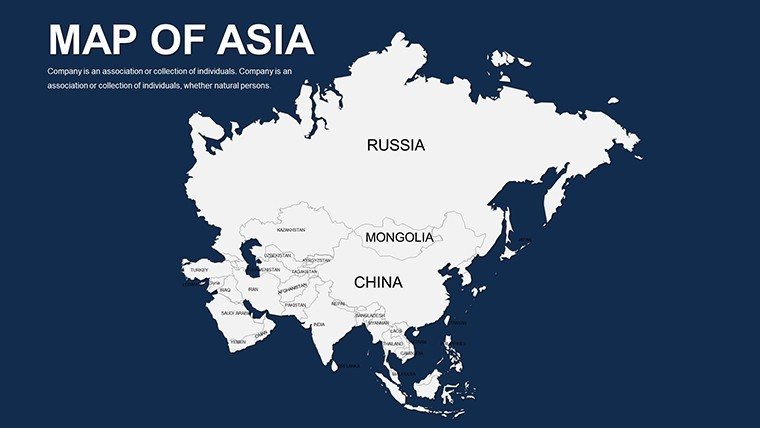
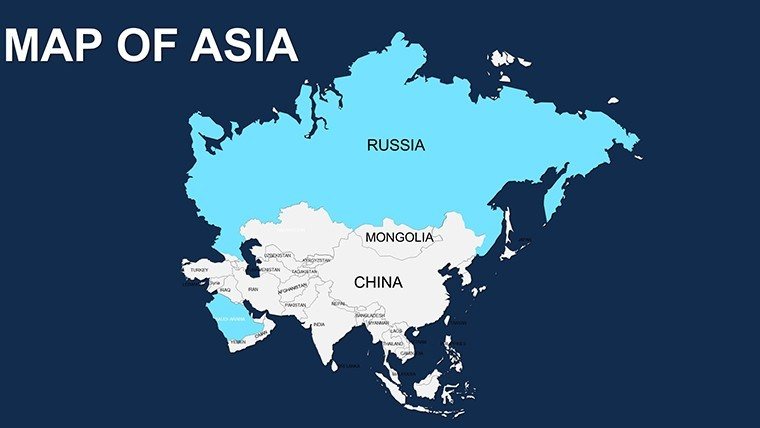
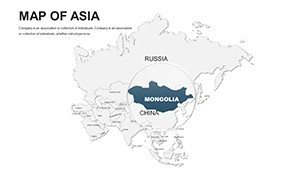
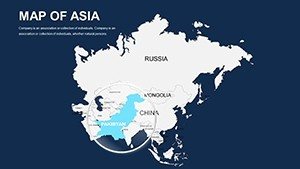
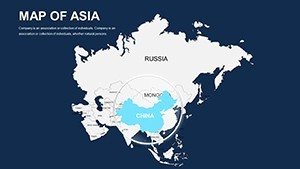
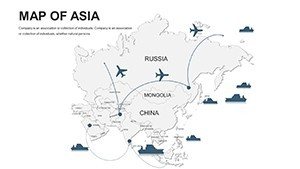
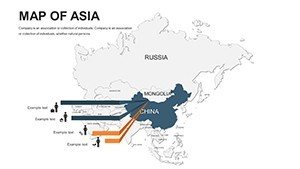
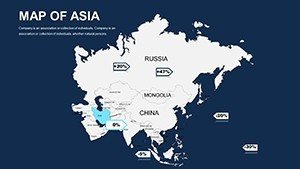
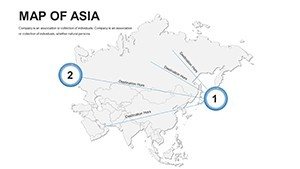
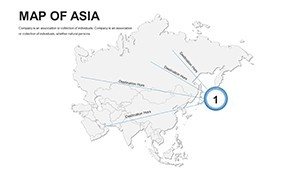
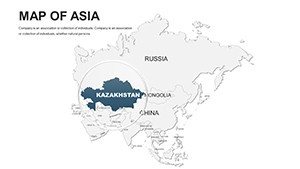
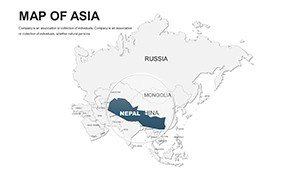
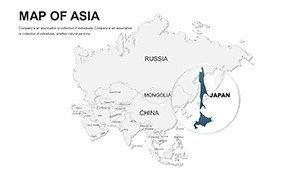
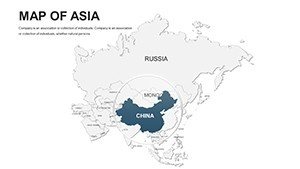
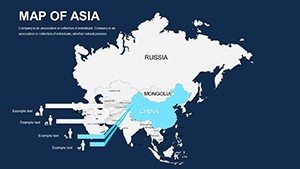
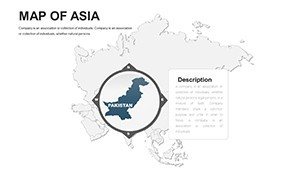
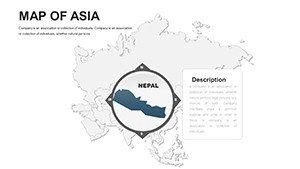
- Regional and Country Maps: In-depth coverage of subregions like East Asia, with editable boundaries for scenario planning.
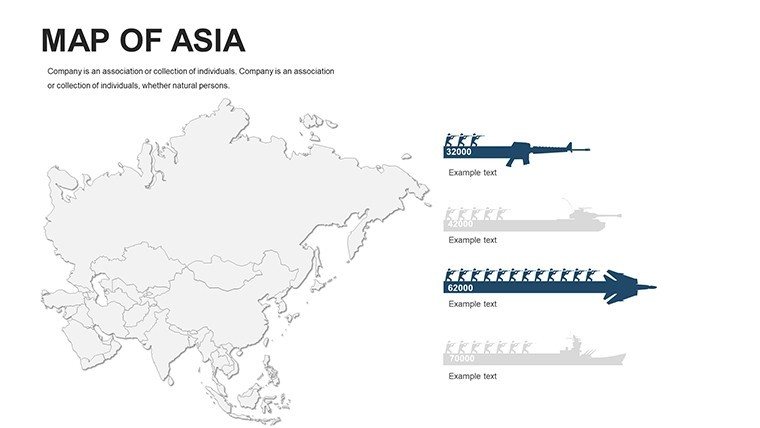
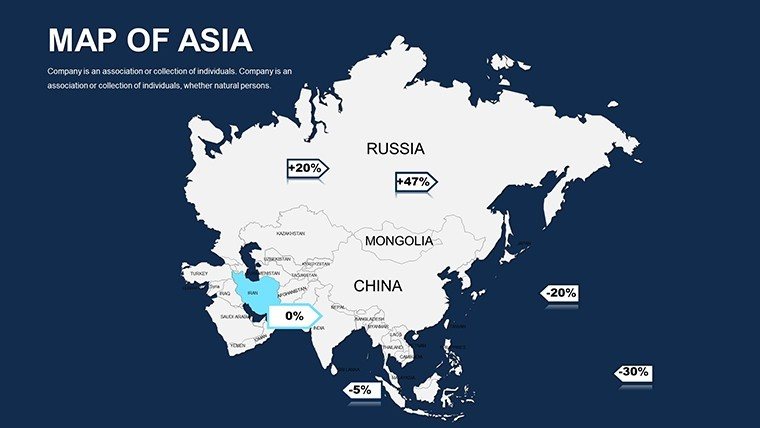
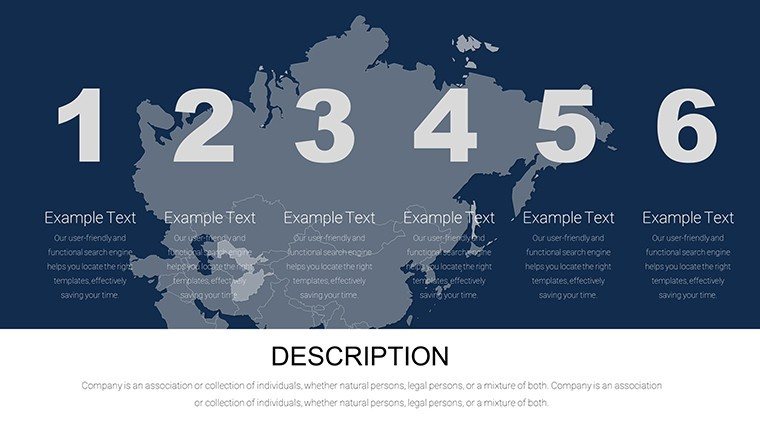
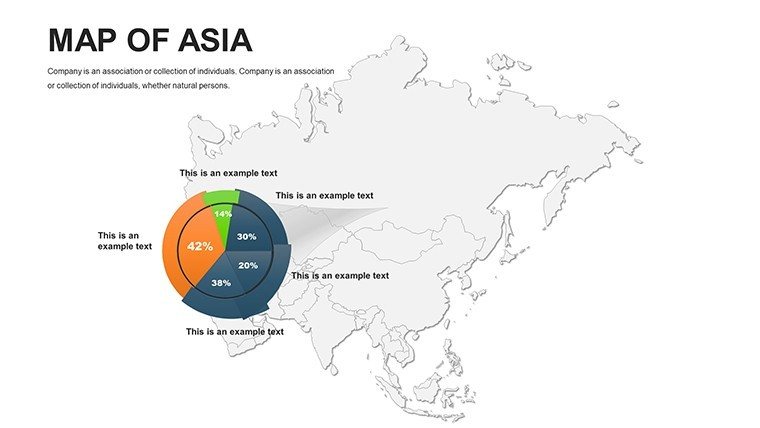
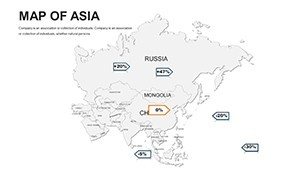
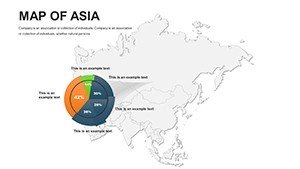
- Infographic Variety: Pre-designed elements for economic indicators, such as GDP growth radars for ASEAN nations.
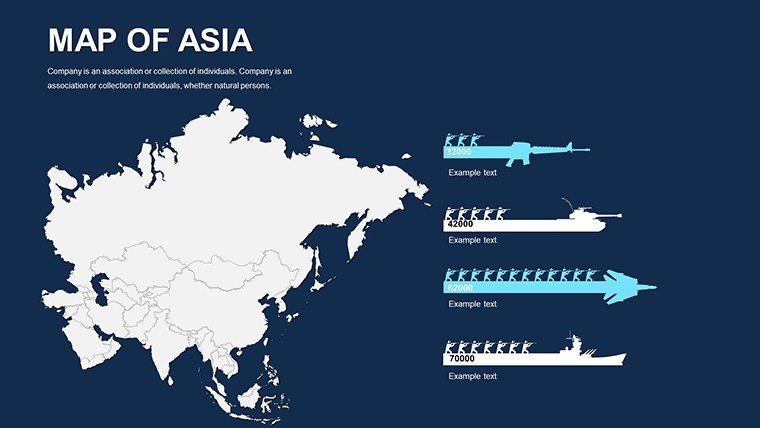
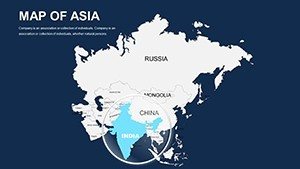
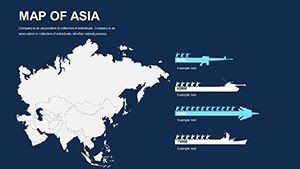
- Theme-Based Layers: Overlay environmental data, like monsoon patterns, with customizable legends.
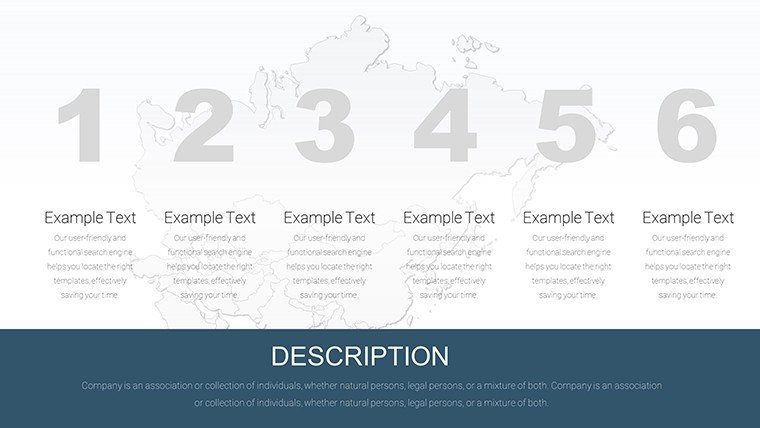
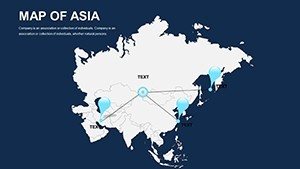
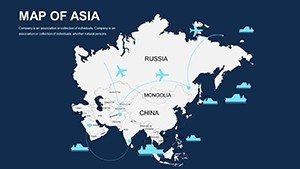
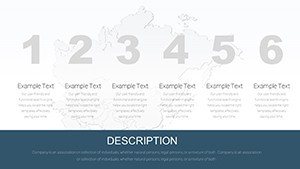
- Interactive Animations: Sequence reveals for historical timelines, e.g., Silk Road evolutions.
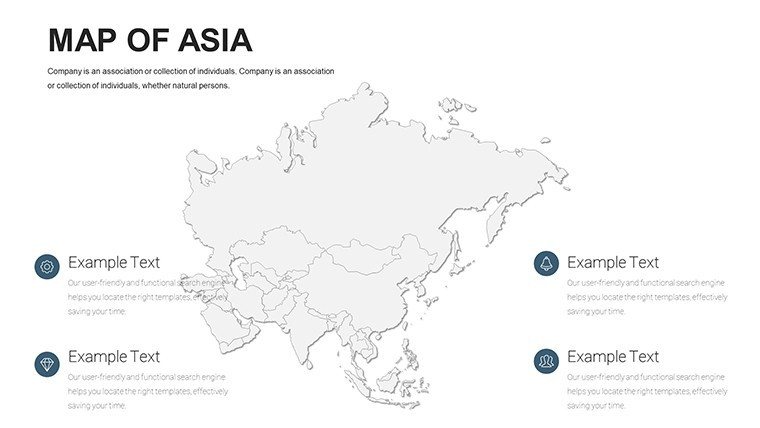
- User-Centric Design: Intuitive tools for novices, yet powerful for pros, with quick-edit panels.
Anchored in cartographic expertise, these features ensure presentations meet high standards, drawing from reliable datasets.
Strategic Use Cases Across Industries
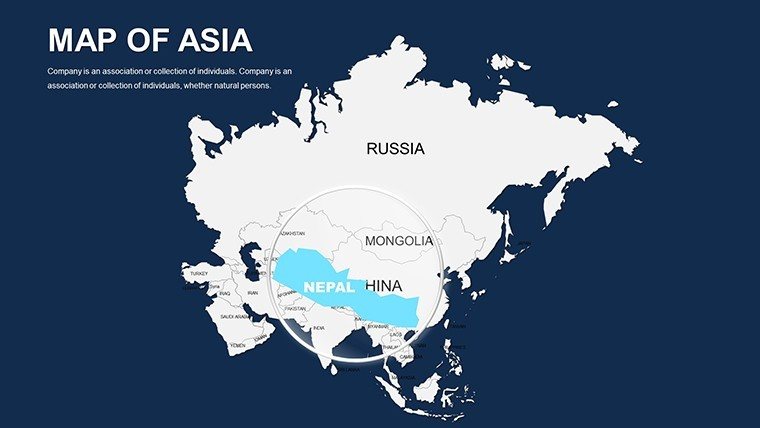
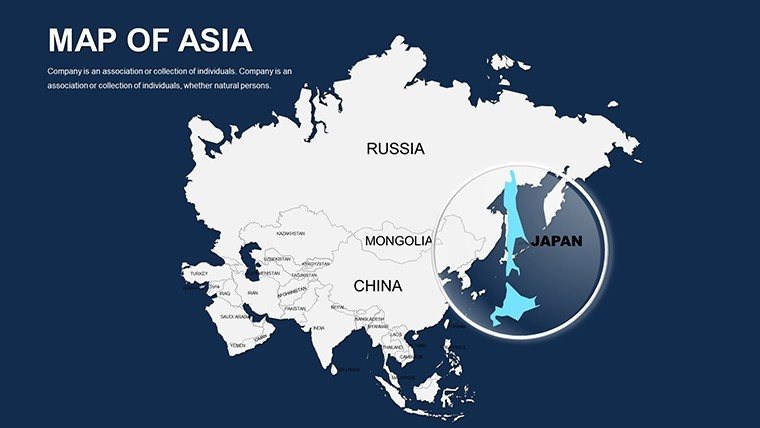
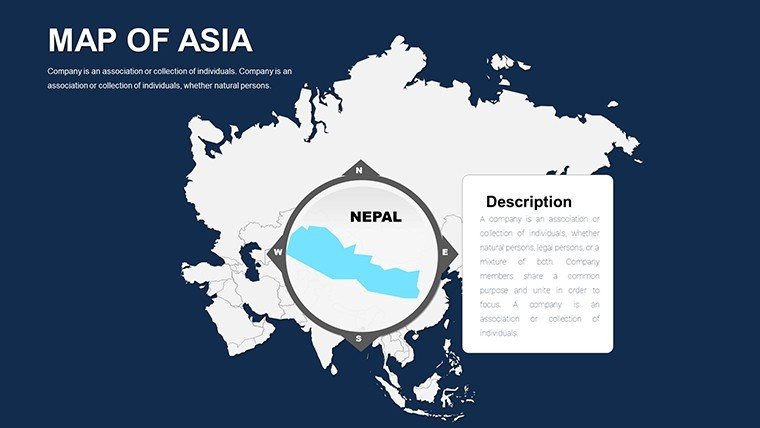
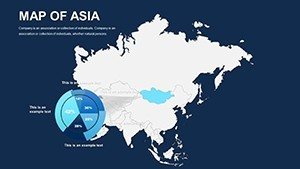
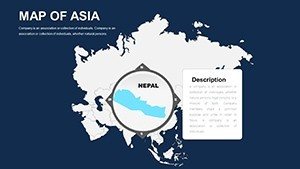
This template adapts fluidly to professional landscapes, empowering users with targeted visuals. In corporate strategy, map investment hotspots in Vietnam's manufacturing sector, integrating bar graphs for FDI inflows per ADB statistics - step-by-step: Choose a base, input data, visualize, and narrate. Researchers presenting at conferences can illustrate climate vulnerability in the Himalayas, using pie charts for affected populations in Nepal and Bhutan. Unlike static images, it enables real-time updates, halving revision times. Educators foster global awareness by creating modules on Asian diversity, from Japan's innovation economy to Indonesia's biodiversity, with embedded quizzes. Consultants impress clients with geopolitical analyses, such as tensions in the Taiwan Strait, backed by think-tank insights like CSIS. These applications demonstrate the template's prowess in turning data into actionable intelligence, as seen in how firms like Deloitte leverage similar tools for market entry reports.
Optimized Workflow for Efficient Design
- Launch the file and browse slide variants.
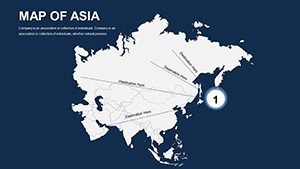
- Customize maps: Adjust scales, add markers for key cities like Beijing or Jakarta.
- Fuse data: Link to sources for auto-updating charts on metrics like export shares.
- Enhance engagement: Apply transitions and hyperlinks to external resources.
- Test usability: Simulate presentations for timing and flow.
- Deploy and refine based on audience responses.
This streamlined approach echoes lean principles used in agile teams, maximizing productivity.
Amplifying Impact with Asia-Focused Innovation
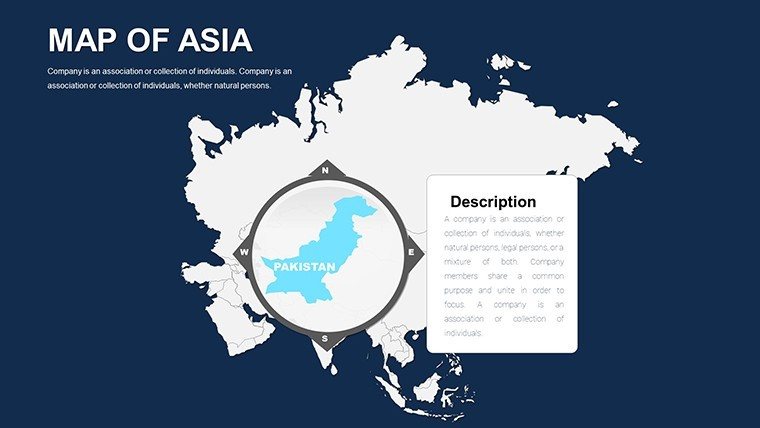
The true edge of this template lies in its capacity to distill Asia's complexity into digestible, compelling formats, addressing challenges like information overload in multicultural settings. Enjoy heightened persuasion - per Forrester research, visuals elevate message retention by 65% - and establish authority through precise, sourced mappings. For urban planners, integrate into proposals for smart cities in Singapore, aligning with ASEAN standards for sustainability. Researchers can map epidemiological trends post-COVID in populous nations like Pakistan, using heat maps for outbreak simulations. Outpacing basic alternatives, it provides thematic depth, with feedback highlighting its role in academic publications and board approvals. Rely on its professional foundation to convey expertise, crafting presentations that not only inform but also inspire cross-continental dialogues.
Unleash Asia's stories in your slides - grab this PowerPoint Maps Template today and elevate your visual narrative game.
Frequently Asked Questions
What types of maps are included?
A mix of continental, regional, and country-specific maps with thematic options.
Can I animate the maps?
Yes, with built-in presets for sequential reveals and data animations.
Is it beginner-friendly?
Absolutely, with intuitive interfaces and guides for quick mastery.
Does it handle large datasets?
Efficiently integrates extensive data for complex visualizations.
Compatible with other software?
Works with PowerPoint, Google Slides, and similar tools.