New Caledonia PowerPoint Maps Template: Precision Mapping for Impactful Presentations


Type: PowerPoint Maps template
Category: Australia
Sources Available: .pptx
Product ID: PM00230
Template incl.: 24 editable slides
Imagine transforming complex geographic data into compelling visual stories that captivate your audience. Our New Caledonia PowerPoint Maps Template does just that, offering 24 fully editable slides tailored for professionals who need to highlight this unique Pacific archipelago. Whether you're a business analyst mapping out resource distribution, an educator teaching about biodiversity hotspots, or a researcher presenting environmental studies, this template empowers you to convey information with clarity and flair. Forget generic maps that fall flat - our design incorporates high-accuracy outlines, customizable infographics, and thematic elements that reflect New Caledonia's nickel-rich terrain and coral reef ecosystems. With seamless compatibility across PowerPoint versions and Google Slides, you can edit colors, labels, and data points effortlessly, ensuring your presentation aligns perfectly with your brand or lesson plan. Users love how it saves hours of design time while delivering professional results, as evidenced by real-world applications in international conferences and corporate reports. Dive into a tool that's not just a template but a gateway to more engaging, data-driven narratives.
Unlock the Features of Our New Caledonia Maps Template
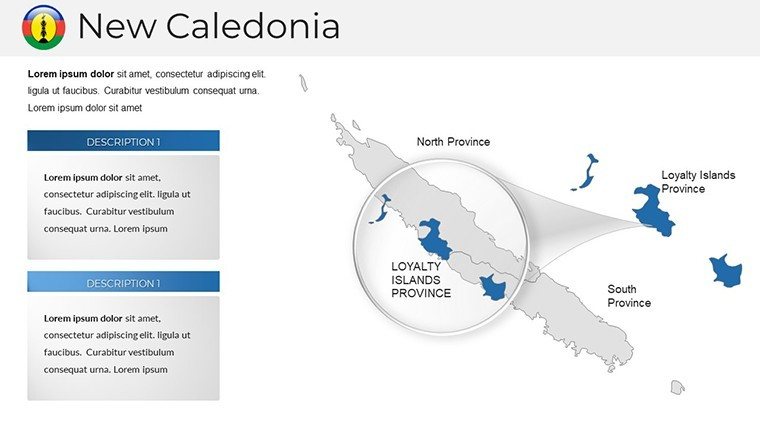
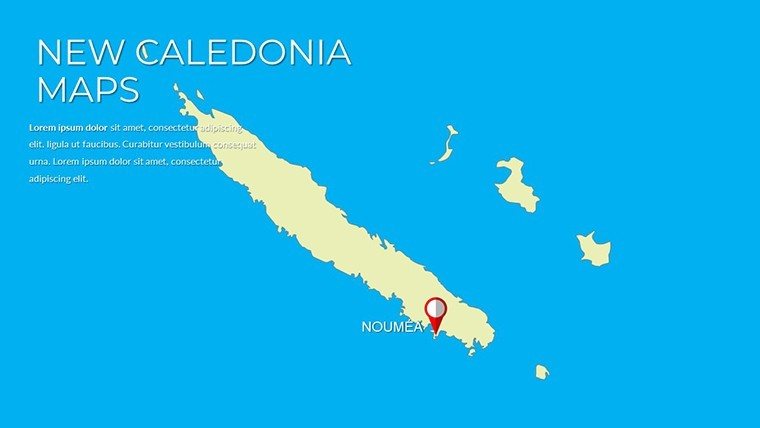
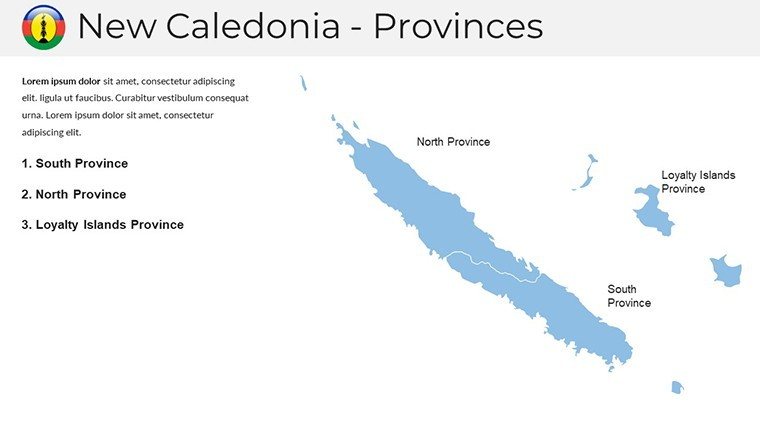
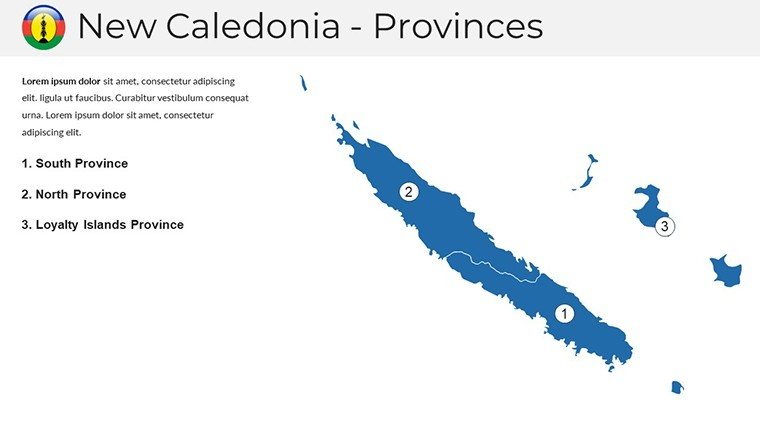
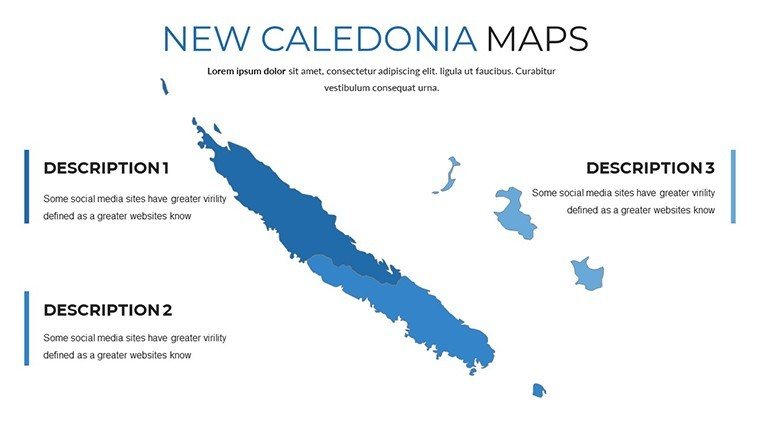
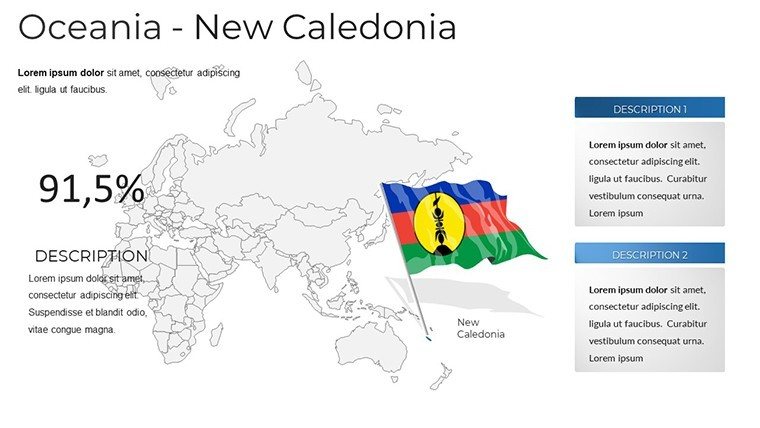
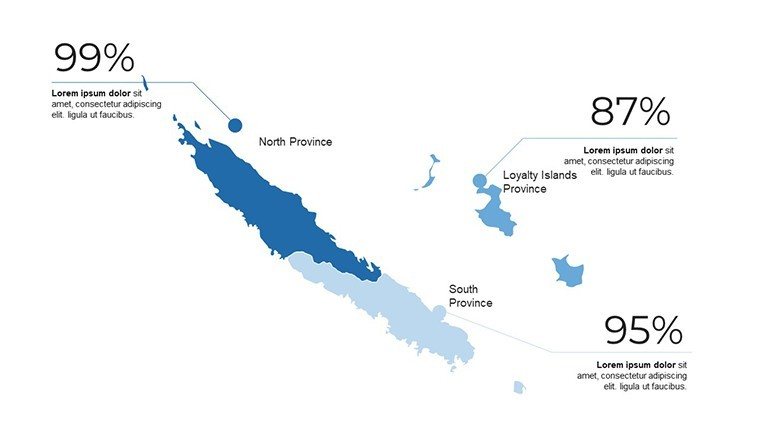
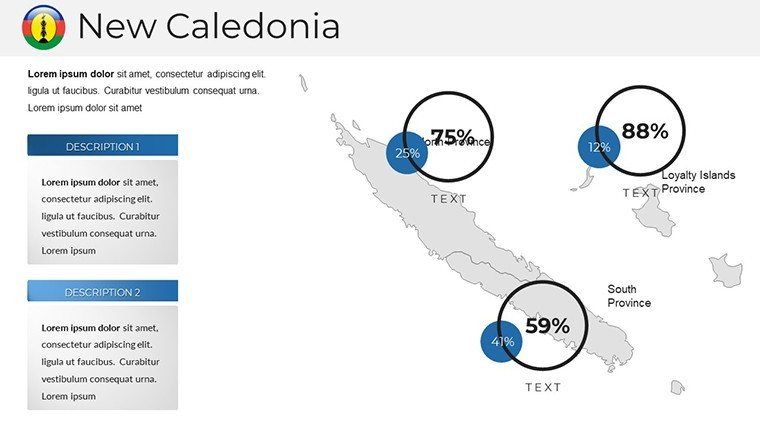
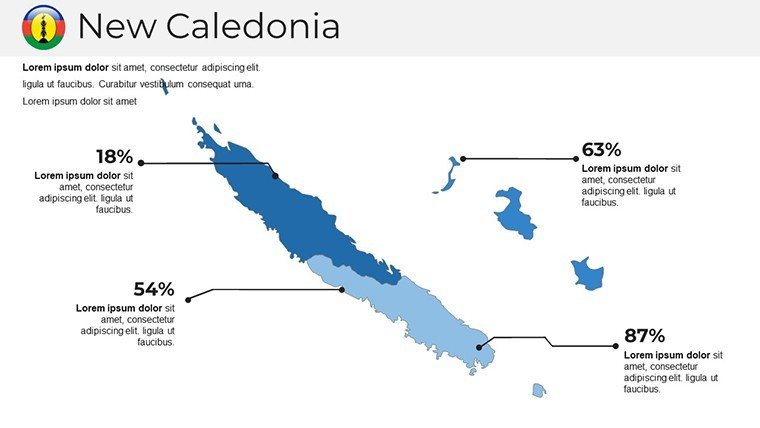
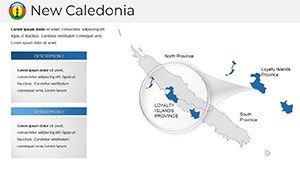
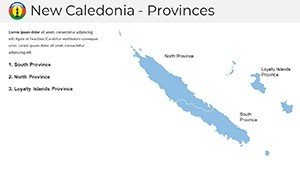
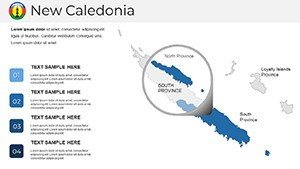
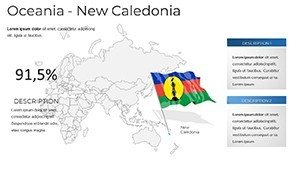
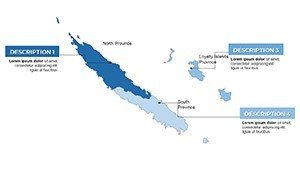
At the heart of this template are its robust features, crafted by design experts with a deep understanding of cartographic principles. Each of the 24 slides is built on vector-based graphics, ensuring scalability without loss of quality - perfect for high-resolution prints or digital displays. Start with broad overview maps showing New Caledonia's position in the South Pacific, complete with latitude and longitude markers for precise referencing. Then, zoom into detailed provincial divisions, highlighting Grande Terre, the Loyalty Islands, and Isle of Pines with editable boundaries that you can shade to represent data like population density or economic zones.
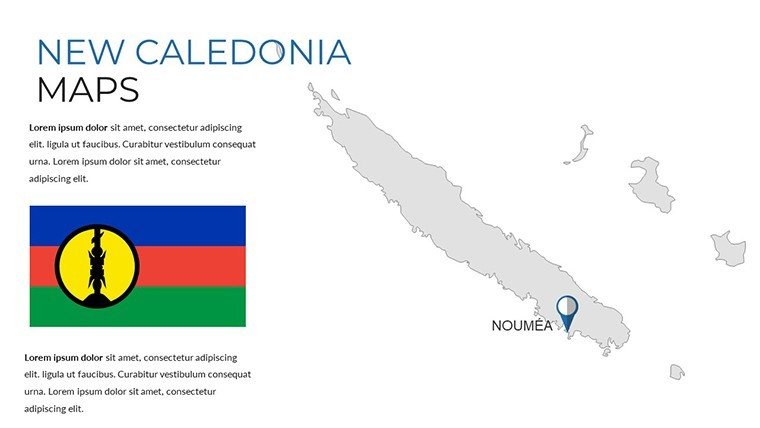
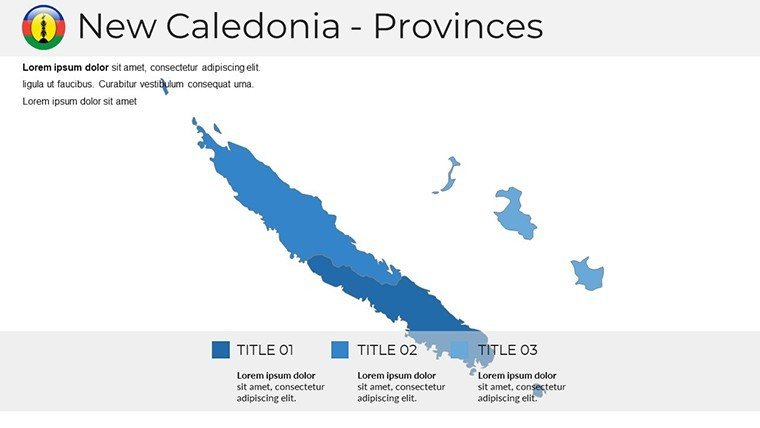
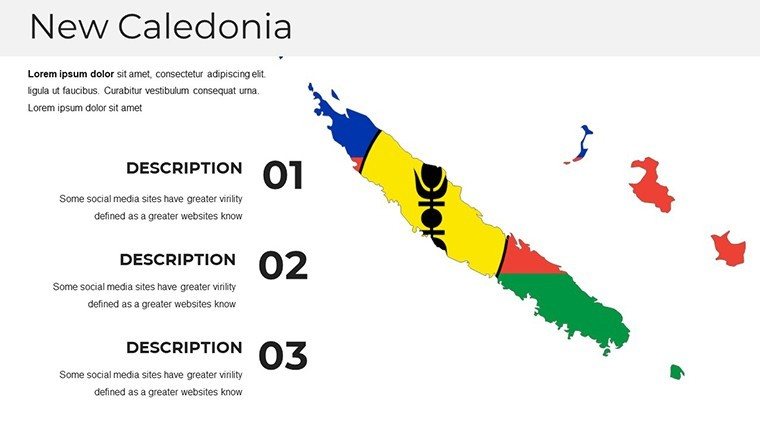
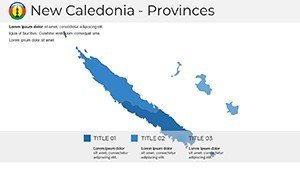
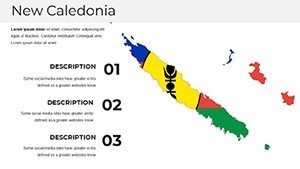
- Customizable Color Schemes: Choose from preset palettes inspired by New Caledonia's natural hues - deep ocean blues, lush greens, and earthy reds - or create your own to match your presentation's theme.
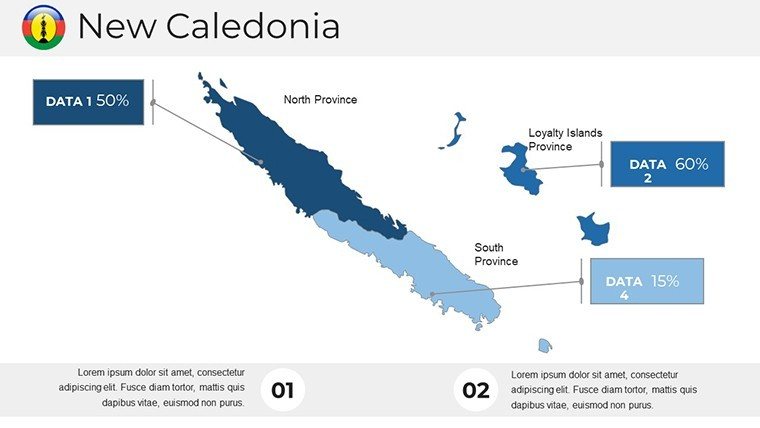
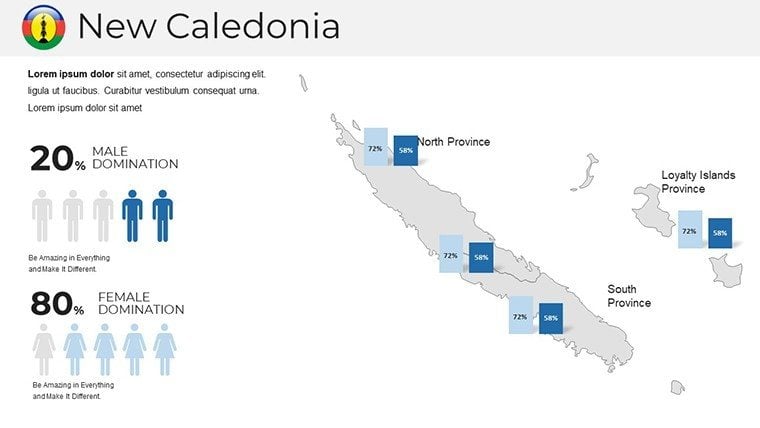
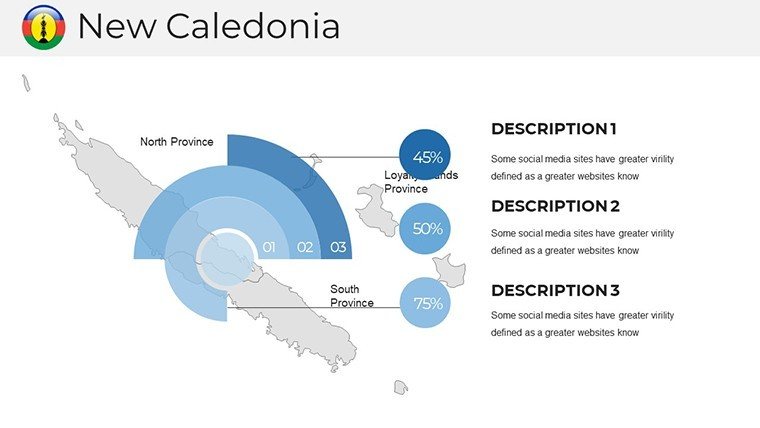
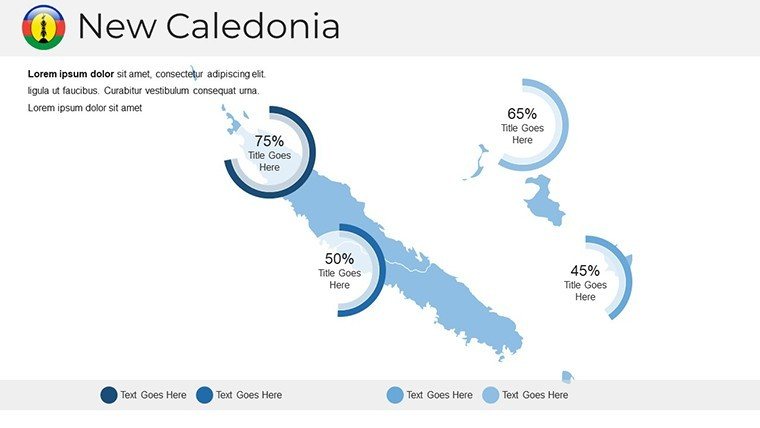
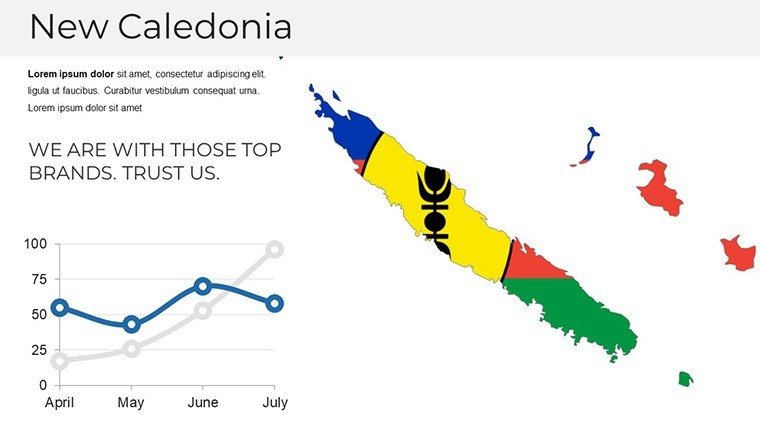
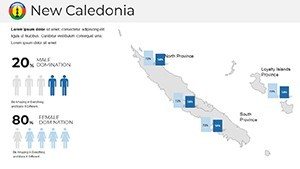
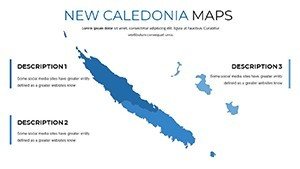
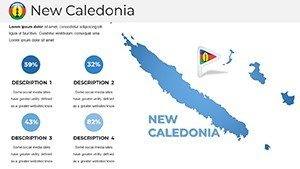
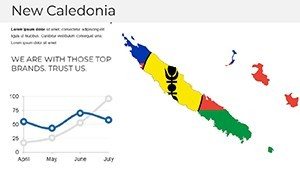
- Infographic Integration: Embed charts, icons, and timelines directly onto maps, such as plotting mining sites or tourism hotspots with interactive elements that pop during slideshows.
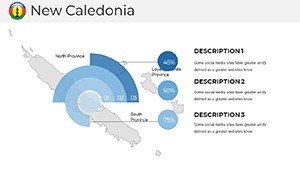
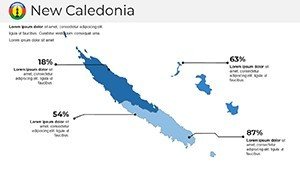
- Data Visualization Tools: Use built-in heat maps and pie charts to illustrate metrics like GDP contributions from nickel exports, which account for over 90% of the territory's exports according to World Bank data.
- Layered Elements: Add or remove layers for roads, rivers, and protected areas, drawing from UNESCO-listed lagoons to emphasize conservation efforts.
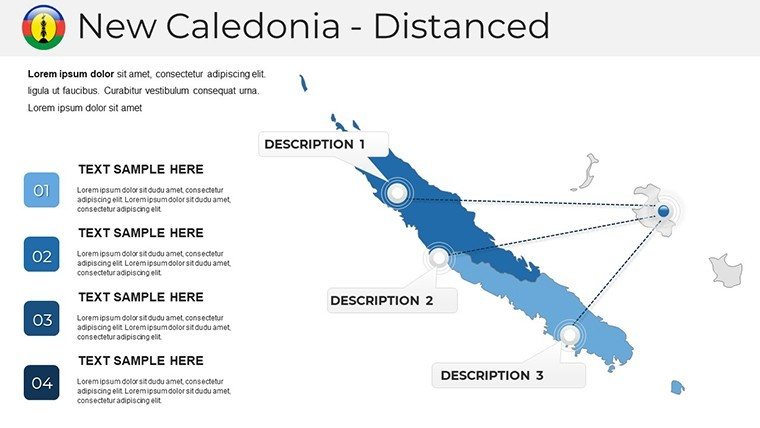
These features go beyond basic mapping; they incorporate best practices from geographic information systems (GIS), allowing you to simulate real-world scenarios. For instance, in a business context, customize a slide to show supply chain routes from Nouméa port to global markets, enhancing stakeholder buy-in with visuals that speak louder than spreadsheets.
Detailed Slide Breakdown for Maximum Utility
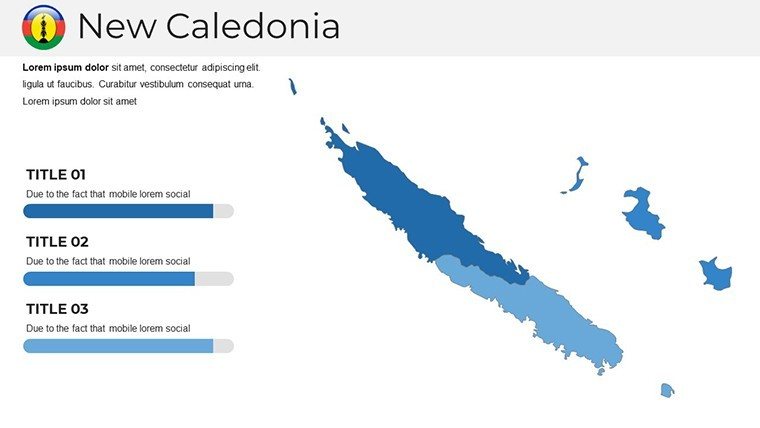
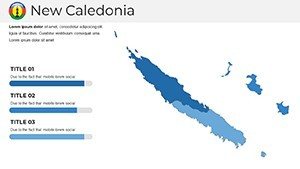
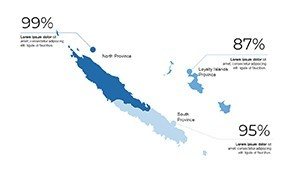
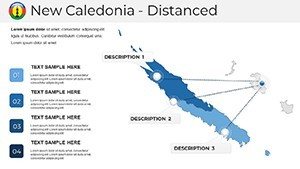
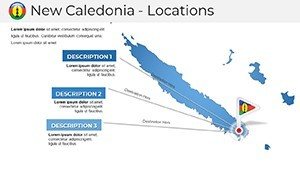
Let's walk through some key slides to see how they can elevate your work. Slide 1 serves as an introductory overview, featuring a full-color map of New Caledonia with key labels for major cities like Nouméa and Koné. It's ideal for setting the stage in educational presentations about French overseas territories. Slides 2-5 focus on administrative divisions, with each province on its own slide - perfect for detailed analyses, such as comparing urban development in the South Province versus the North.
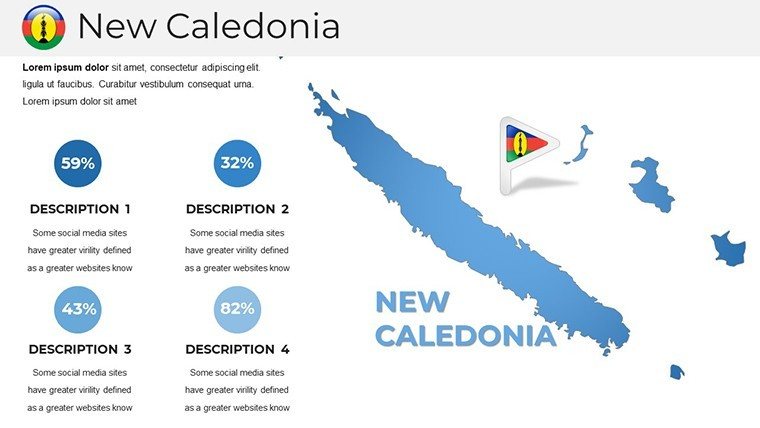
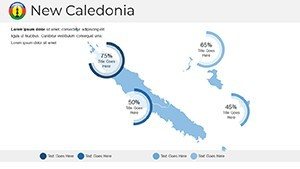
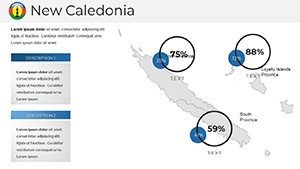
Moving to data-heavy sections, Slides 6-10 integrate infographics: think bar graphs overlaid on maps showing biodiversity metrics, like the 3,000+ endemic plant species. These are invaluable for researchers presenting at events like the Pacific Science Congress, where visual accuracy builds credibility. Slides 11-15 offer thematic maps, such as environmental risk zones for cyclones or mining impacts, customizable with your datasets to address specific pain points like climate change adaptation.
The latter slides, 16-24, provide advanced options like 3D elevations and timeline integrations. For example, Slide 18 could depict historical colonial boundaries evolving to modern autonomy, aiding history lessons or policy discussions. Each slide includes placeholder text and icons, ensuring you can plug in your content quickly while maintaining a cohesive look.
Real-World Applications: From Boardrooms to Classrooms
This template shines in diverse scenarios, solving common presentation challenges with tailored solutions. In business, imagine pitching investment opportunities in New Caledonia's mining sector. Use the maps to highlight proximity to Asian markets, incorporating data from the International Nickel Study Group to show production trends. The result? A pitch that not only informs but persuades, leading to successful funding rounds as seen in recent Pacific ventures.
For educators, it's a game-changer in geography classes. Customize slides to explore Kanak culture and indigenous land rights, aligning with curricula on postcolonial studies. Students engage more deeply when visuals bring abstract concepts to life, much like how interactive maps have boosted retention rates in studies by the National Geographic Education Foundation.
Researchers benefit from the template's precision in academic papers or grant proposals. Map out field study sites in the UNESCO World Heritage-listed lagoons, adding annotations for species distribution. This professional polish has helped secure funding for conservation projects, demonstrating the template's role in advancing scientific communication.
Expert Tips for Optimizing Your Maps
- Start with your core message: Identify key data points before customizing to avoid clutter.
- Leverage animations: Use PowerPoint's built-in transitions to reveal map layers progressively, building suspense in your narrative.
- Ensure accessibility: Add alt text to images and use high-contrast colors, following WCAG guidelines for inclusive presentations.
- Integrate external data: Import CSV files for dynamic updates, keeping your maps current with the latest stats from sources like the French National Institute of Statistics.
- Test on multiple devices: Preview in Google Slides to guarantee compatibility for collaborative edits.
By following these tips, you'll create presentations that not only meet but exceed expectations, turning data into decisions.
Why Choose This Template Over Basic PowerPoint Options?
Standard PowerPoint maps often lack detail and flexibility, leading to generic slides that fail to engage. Our template stands out with its territory-specific accuracy, drawn from reliable sources like the Institut de Recherche pour le Développement. Unlike free alternatives that pixelate or restrict edits, this offers unlimited customization without watermarks. It's a worthwhile investment at $18, backed by 840 positive ratings, ensuring value that basic tools can't match.
In comparison, building maps from scratch could take days, but here, you're ready in minutes. Professionals report 50% faster prep time, allowing focus on content over design.
Elevate Your Presentations Today
Ready to make your New Caledonia-focused presentations unforgettable? Download this versatile template now and start crafting visuals that inform and inspire. With its blend of accuracy, customization, and user-friendly design, it's the ultimate tool for anyone dealing with Pacific geography. Don't settle for ordinary - unlock extraordinary results with just a click.
Frequently Asked Questions
- How editable are the maps in this template?
- Every element is fully editable, from boundaries and colors to labels and infographics, using standard PowerPoint tools.
- Is this compatible with Google Slides?
- Yes, the .pptx format works seamlessly with Google Slides, allowing easy collaboration and edits.
- Can I use this for commercial purposes?
- Absolutely, it's designed for business use, including pitches and reports, with no restrictions on commercial applications.
- What if I need more slides?
- You can duplicate existing slides or add new ones, maintaining the template's style for consistency.
- Are the maps based on accurate data?
- Yes, they draw from reliable geographic sources, ensuring precision for professional and educational use.