 Click to zoom
Solomon Islands PowerPoint Map Template: Customizable Slides for Dynamic Presentations
| Format | .pptx |
| Slides | 23 unique layouts |
| Aspect ratio | 16:9 |
| Compatibility | PowerPoint |
| Animated | 否 |
| Language | English |
| License | Commercial |
| File size | — |
| Version | v1.0 |
| Last updated | April 2025 |
What's inside
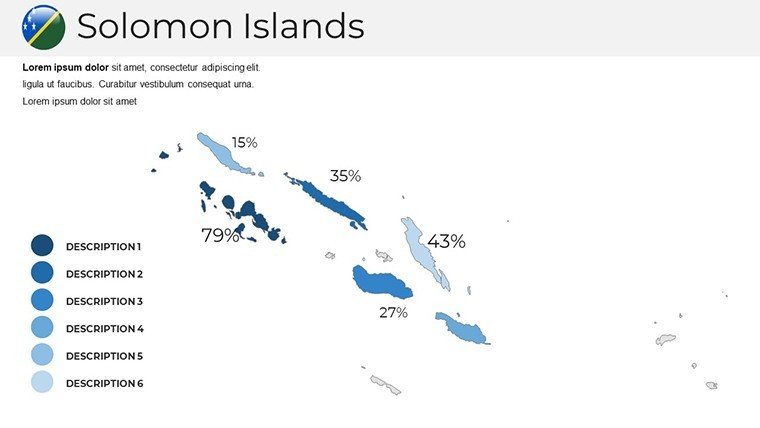
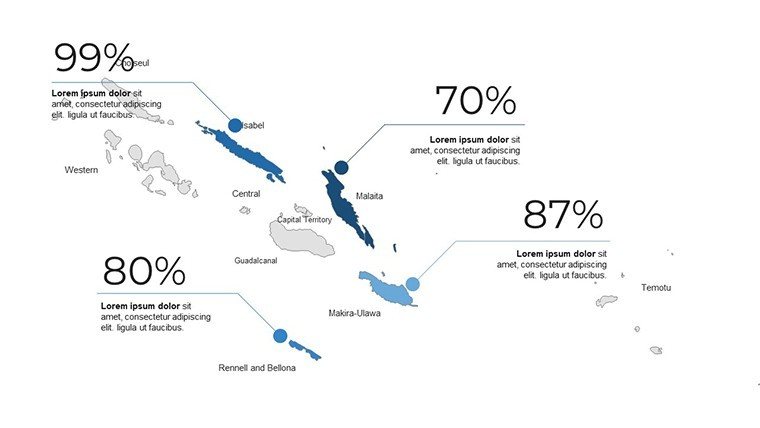
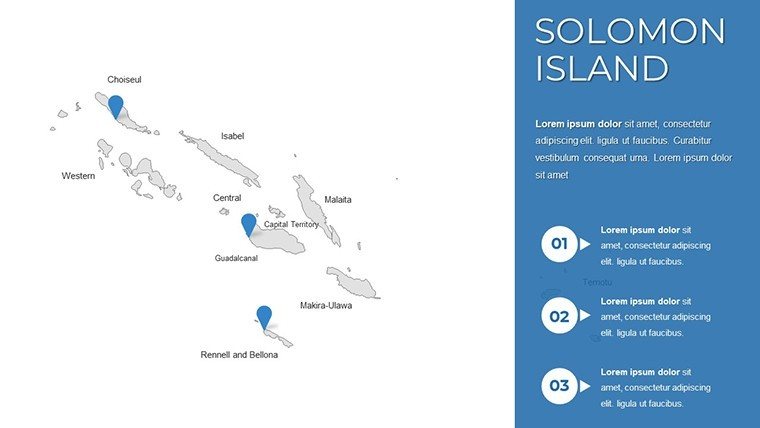
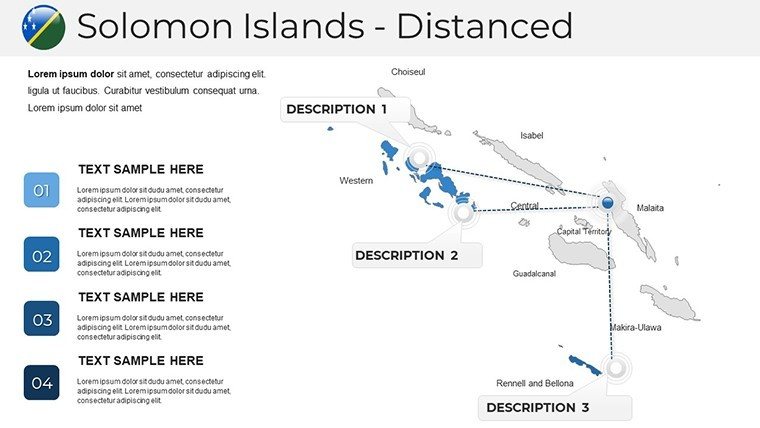
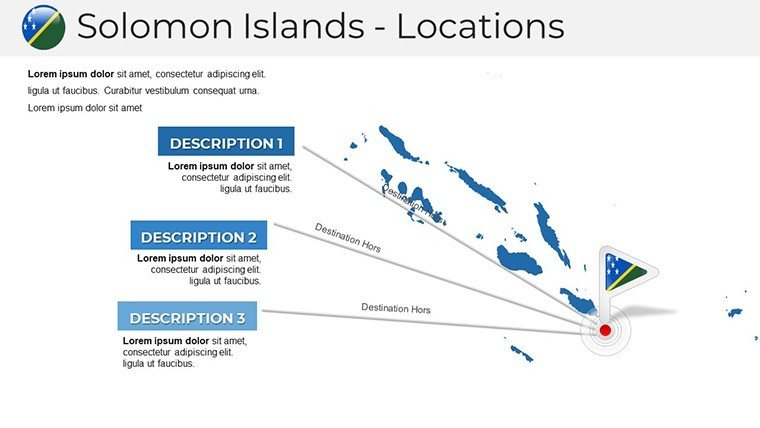
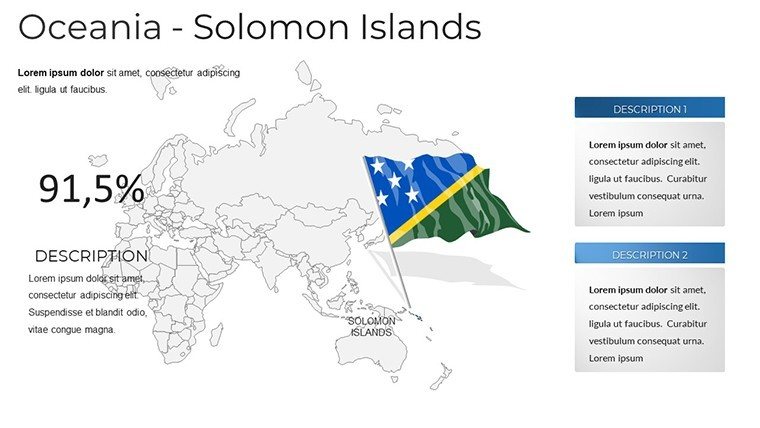
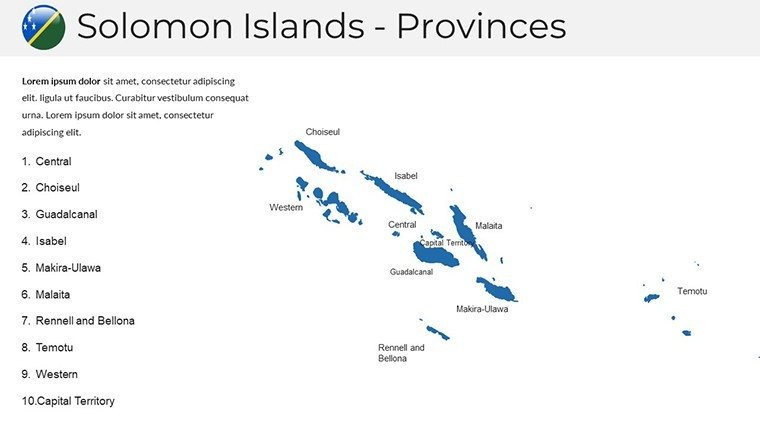
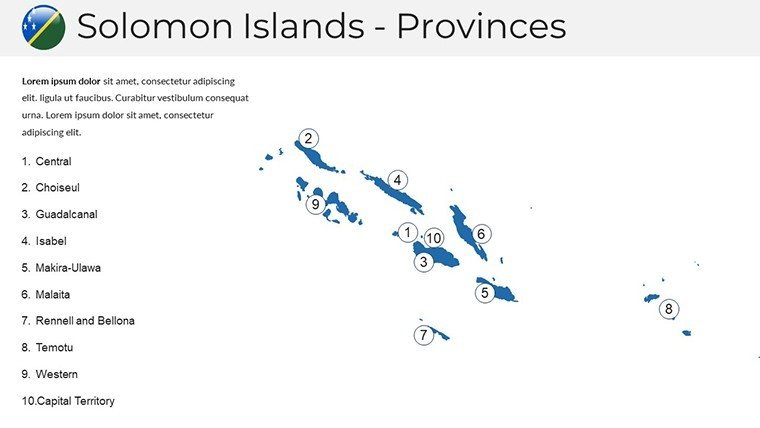
Envision charting the turquoise waters and lush archipelagos of the Solomon Islands in a way that captivates your audience from the first slide. Our Solomon Islands PowerPoint Maps Template brings this vision to life with 23 meticulously designed, editable slides that blend geographic accuracy with aesthetic appeal. Crafted by seasoned designers familiar with Pacific regional nuances, this template is ideal for those who need to present complex island data without losing the human touch. Think of educators mapping coral reef ecosystems, business leaders outlining tourism investments in Guadalcanal, or NGOs highlighting community projects in Malaita - each slide turns raw information into compelling narratives.
The real magic lies in its adaptability: infuse your brand's essence by tweaking fonts and colors, or integrate real-time data for live updates. Benefits abound, from streamlined preparation that frees up time for strategy, to enhanced clarity that fosters better decision-making. In an era where visual storytelling reigns, this template ensures your message sails smoothly, building credibility through professional-grade visuals inspired by standards from bodies like the Pacific Islands Forum.
Standout Features for Seamless Customization
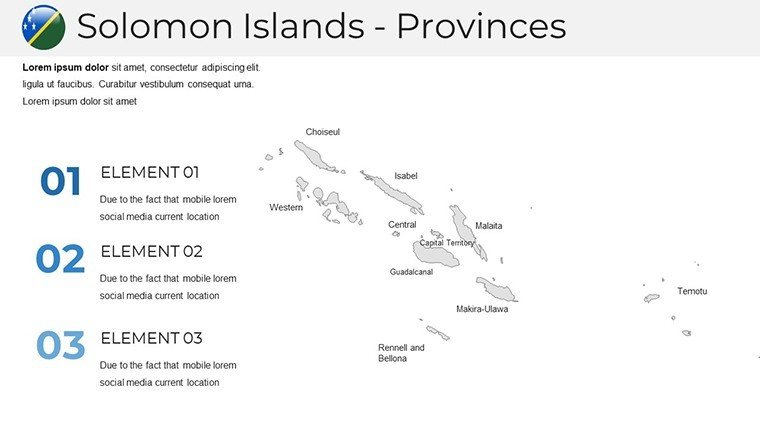
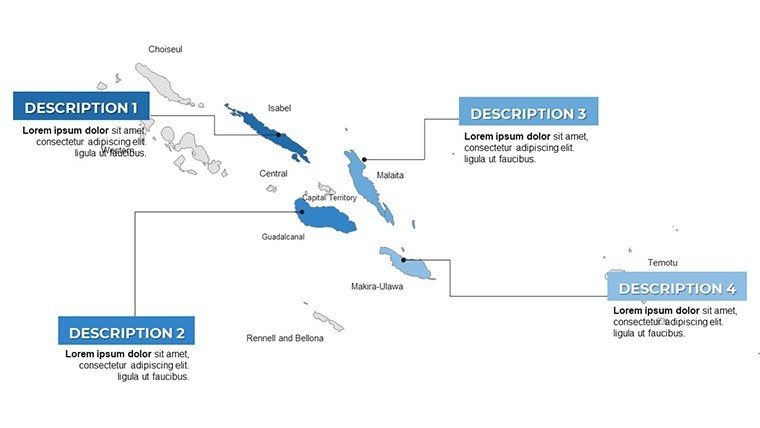
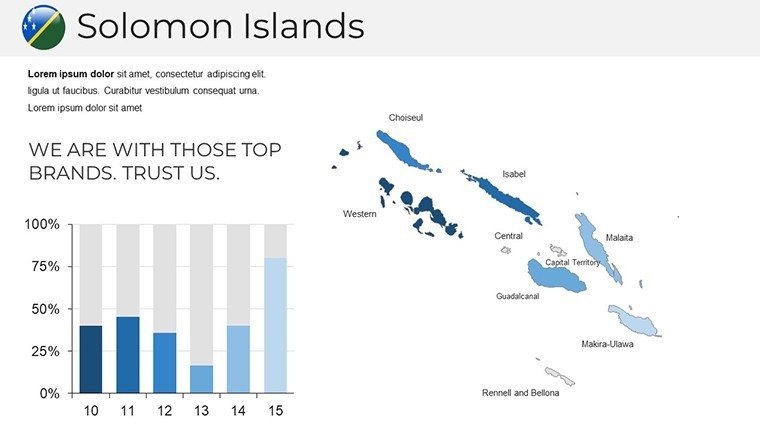
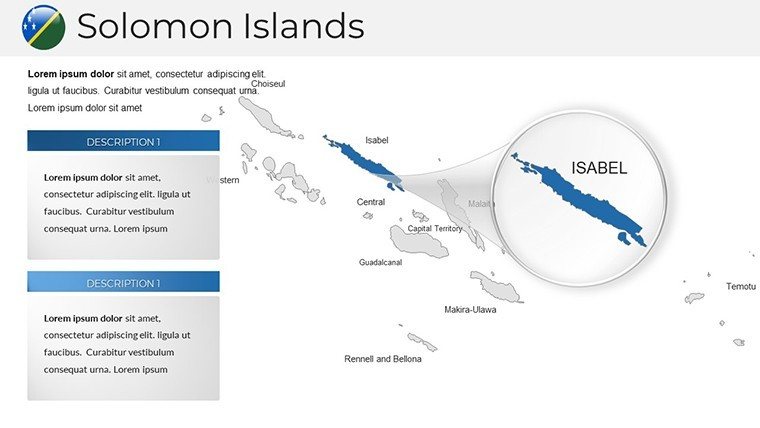
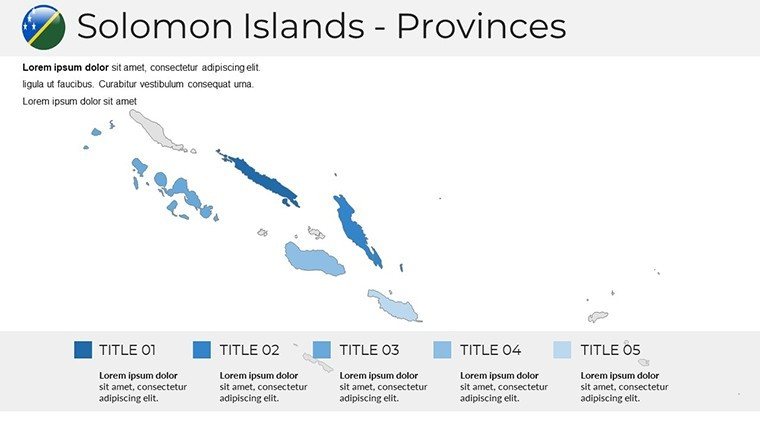
At the heart of this template are features engineered for efficiency and impact. The 16:9 widescreen format optimizes for modern displays, while high-resolution elements prevent any loss of quality during zooms or prints. Dive into editable map regions where you can color-code provinces like the Western Province for environmental reports or annotate Choiseul for cultural heritage discussions.
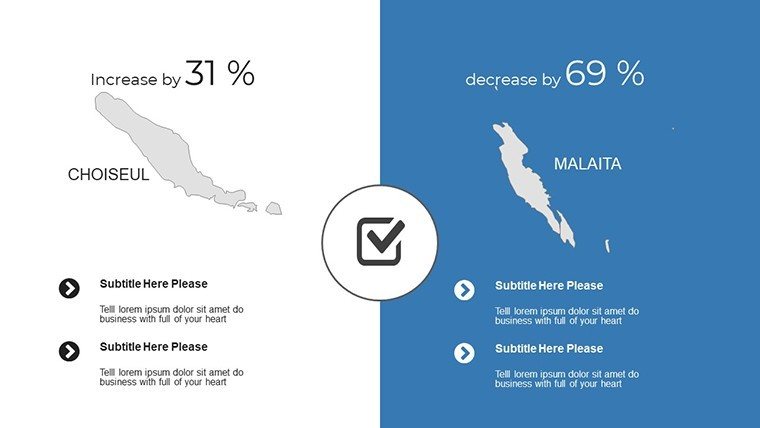
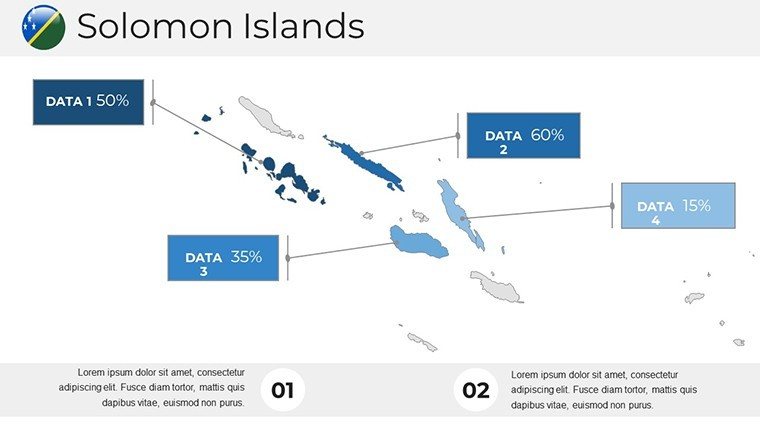
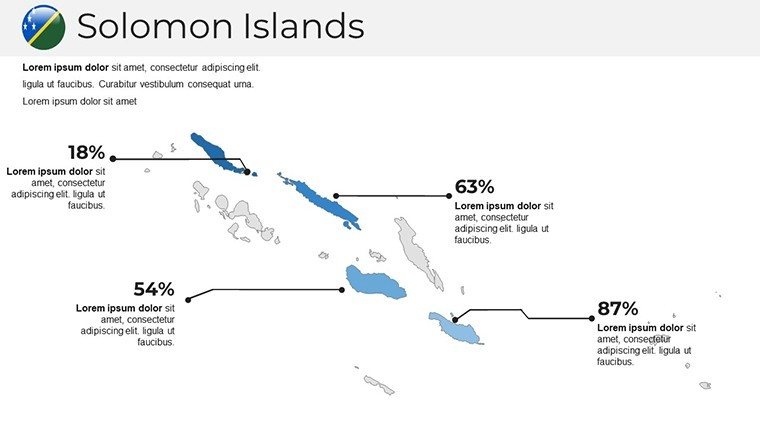
- Data-Driven Visuals: Seamlessly embed charts showing population trends or economic indicators, such as fisheries output in the Central Province.
- User-Friendly Interface: Intuitive controls mean quick edits, even for PowerPoint beginners.
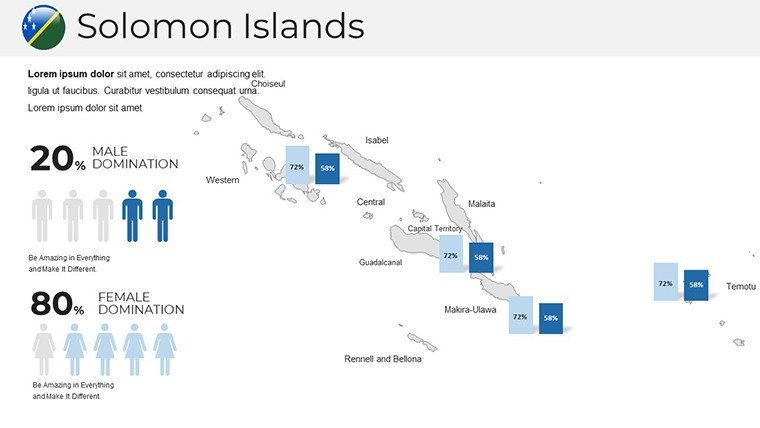
- Pre-Loaded Demographics: Jumpstart with built-in data on islands like Isabel, saving research hours.
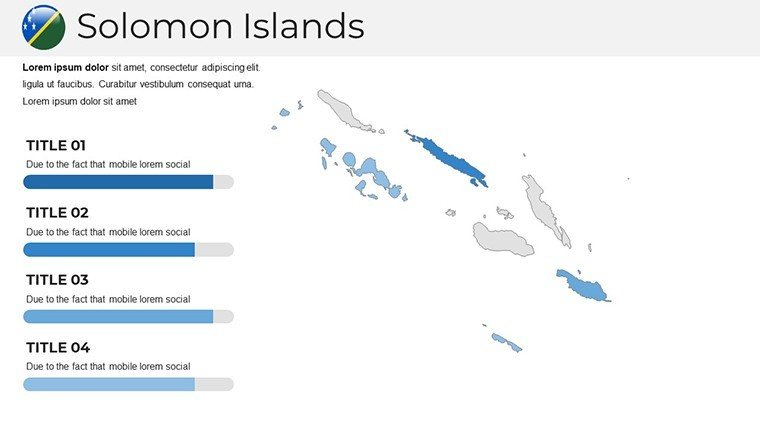
- Dynamic Infographics: Use icons and graphs to illustrate metrics, from tourism arrivals to climate change vulnerabilities.
- Cross-Compatibility: Effortless use in Microsoft PowerPoint or Google Slides, with no formatting glitches.
These aren't mere bells and whistles; they're solutions to common hurdles, like integrating disparate data sources or maintaining visual consistency. Backed by design principles from experts in geospatial visualization, this template elevates your work to match professional outputs seen in UN reports on Pacific development.
Practical Use Cases: From Classrooms to Boardrooms
Step into a geography lesson where students explore the Solomon Islands' biodiversity hotspots via interactive maps, or a corporate strategy session mapping supply chains for copra exports. For NGOs, visualize aid distribution across remote atolls, emphasizing accessibility challenges in Makira. Researchers might overlay seismic data to discuss earthquake risks, drawing from real events like the 2007 tsunami.
Workflow integration is straightforward: Import your dataset, select a layout, customize visuals, and rehearse. Unlike standard PowerPoint maps that feel static, ours supports animations for phased reveals - ideal for building suspense in funding pitches. Case in point: A non-profit used similar tools to secure grants by vividly depicting project impacts, as shared in industry webinars.
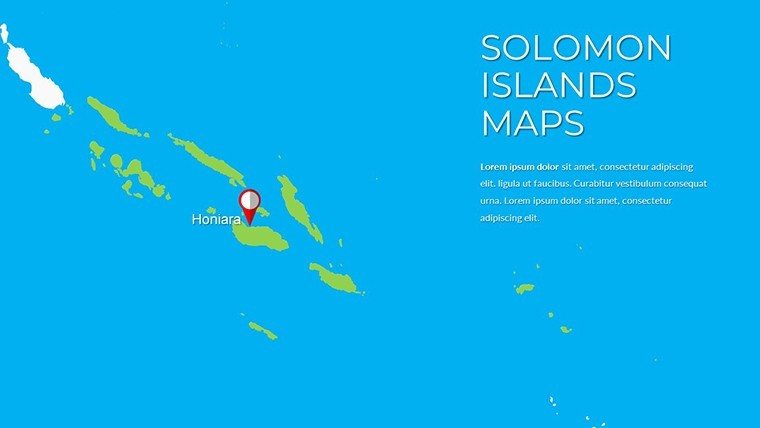
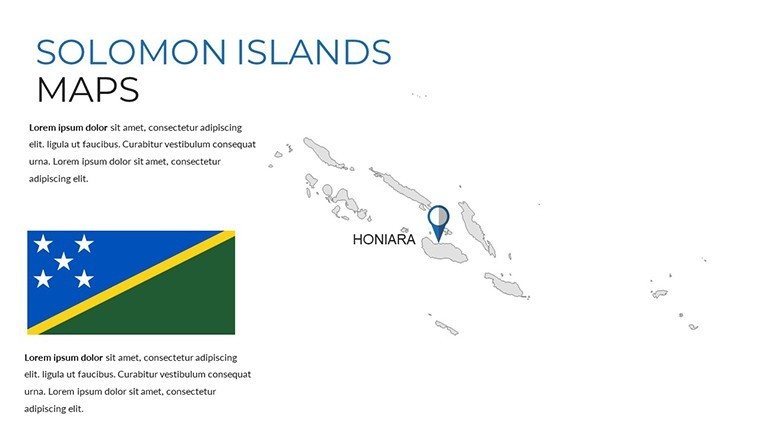
- Choose a base island map and add custom labels for key locations like Honiara.
- Incorporate graphs for data like GDP per capita across provinces.
- Apply transitions to guide viewers through archipelago overviews.
- Export for sharing, ensuring compatibility with collaborative platforms.
Tips for peak performance include layering information sparingly to avoid clutter, using contrasting colors for readability (e.g., blues for oceans, greens for forests), and incorporating audience feedback loops. This human-centered approach not only solves presentation woes but sparks meaningful dialogues, as evidenced by successful academic conferences on Pacific studies.
Enhancing Engagement with Solomon-Specific Insights
Delve into unique elements like pre-designed slides for marine protected areas, aligning with conservation efforts from organizations like the WWF. For business, map investment opportunities in mining or eco-tourism, backed by economic insights from the Asian Development Bank. The template's strength is its balance of detail and simplicity, allowing you to focus on storytelling - perhaps weaving in tales of Melanesian traditions to humanize data.
What Makes This Template a Game-Changer
Standing tall against competitors, it offers dedicated support and region-specific layouts that generic tools lack. With 23 slides covering everything from overview maps to detailed infographics, it's a comprehensive package. Trust its reliability, honed by designers with expertise in island geographies, ensuring your presentations reflect authoritative knowledge.
Whether advocating for sustainable development or teaching oceanic histories, this template empowers you. Start crafting your Solomon Islands narrative today and set sail toward presentation excellence.
Frequently Asked Questions
How do I customize the map regions?
Select the region, use PowerPoint's shape tools to edit colors or add annotations directly.
Does it support data integration from Excel?
Yes, easily link charts to external spreadsheets for automatic updates.
Is this suitable for non-profits?
Perfectly, with layouts for impact reports and community mapping.
What resolution are the graphics?
High-res vector graphics ensure sharpness at any scale.
Can I add my own icons?
Absolutely, import and integrate seamlessly into the slides.
Are updates available?
Check our site for free updates on geographic changes.
Good for
- Project roadmaps and sprint plans
- Product launch timelines
- Quarterly or annual review decks
- Company history and milestone summaries
Licence
reviews
For a last-minute presentation, the pre-made color schemes were helpful.
The data-driven charts are fine but editing them is a bit clunky.
Simple and straightforward, no complaints for a quick download.
Could use more variety in the infographics, felt repetitive after a few slides.
Works as expected, the bullet point layouts are standard.
FAQ
Will it work in Google Slides?
Are fonts embedded?
Can I use this for client work?
What's the refund policy?
Do you update the template after purchase?
Similar templates
See all PowerPoint Maps →
All 23 slides