Basis of CSR PowerPoint Diagrams Template


Type: PowerPoint Diagrams template
Category: Cycle, Process, Pie, Organizational
Sources Available: .pptx
Product ID: PD00012
Template incl.: 14 editable slides
In a world where stakeholders demand transparency on ethics and sustainability, your presentations need to rise above the jargon and deliver genuine insight. Enter the Basis of CSR PowerPoint Diagrams template - a collection of 14 editable slides crafted to unpack the pillars of Corporate Social Responsibility with elegance and precision. From environmental impacts to community engagements, these diagrams turn abstract commitments into visual roadmaps that resonate, helping executives, sustainability officers, and consultants build trust one slide at a time.
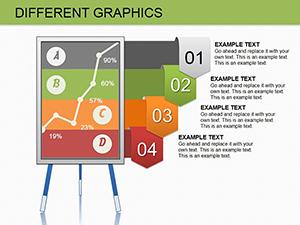
The challenge in CSR reporting often lies in balancing data density with digestibility. Generic charts fall flat, leaving audiences adrift in numbers. This template counters that with purpose-built visuals: pie charts segmenting responsibility areas, cycle diagrams looping through policy implementation, and organizational trees branching into governance structures. Tailored for those steering ethical strategies, it empowers you to spotlight progress in areas like labor practices or carbon footprints, fostering dialogues that inspire action rather than just applause.
Exploring the Template's Structured Visuals
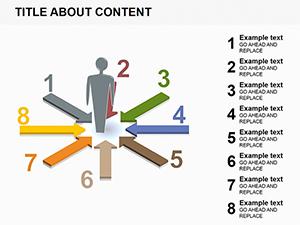
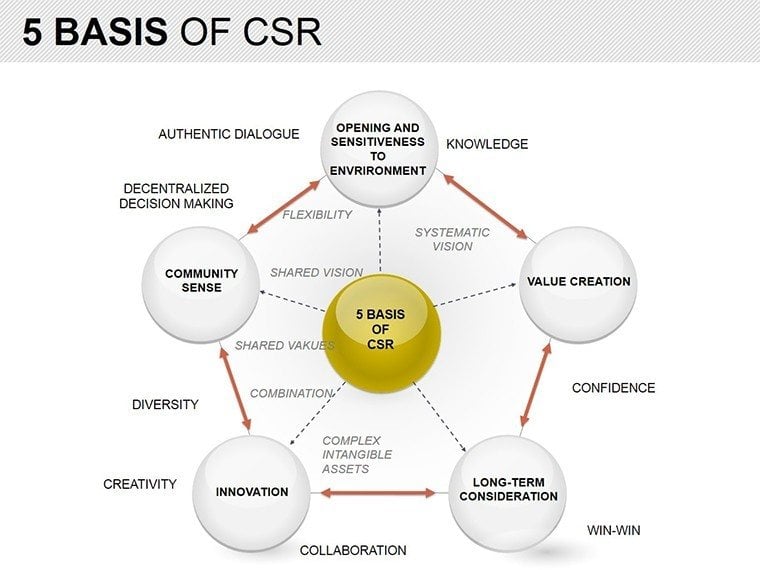
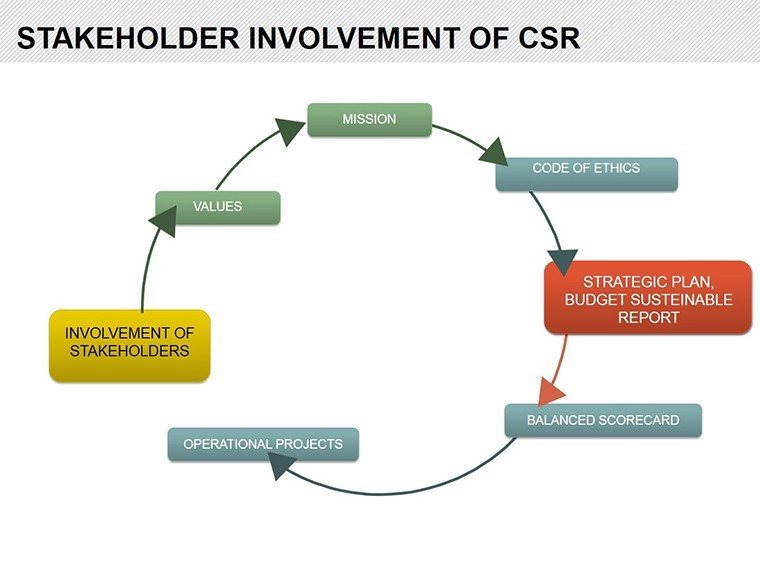
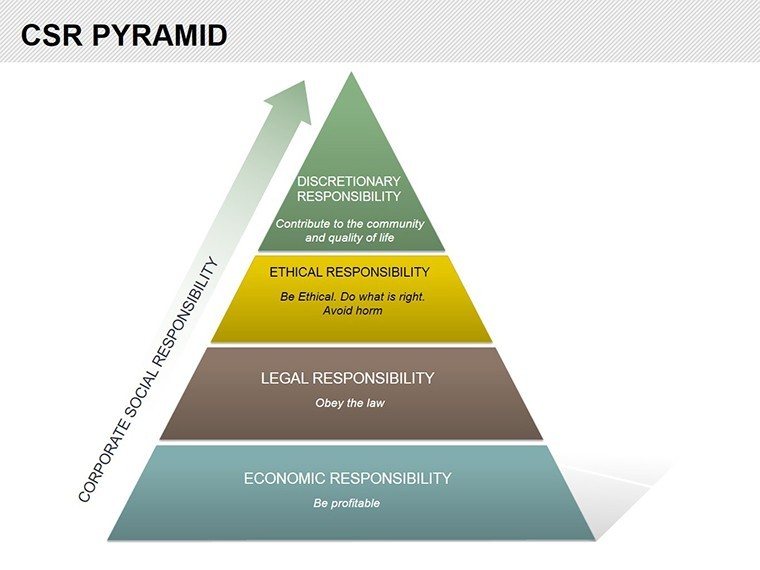
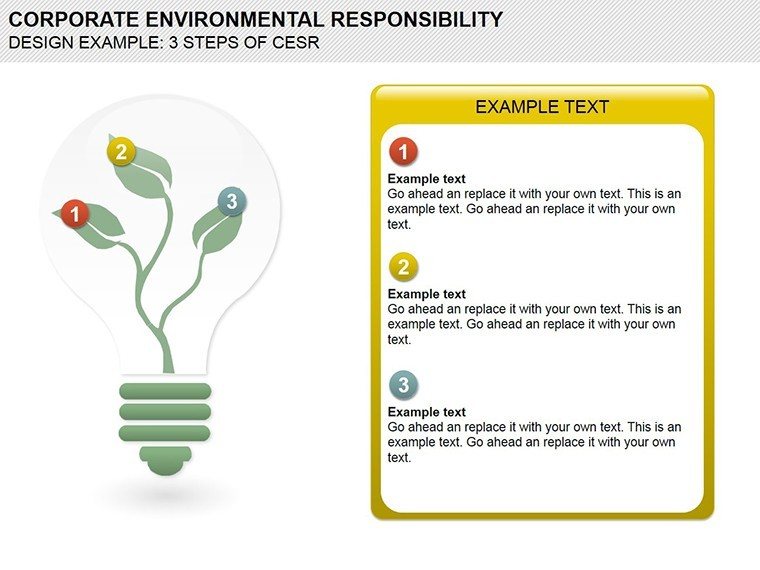
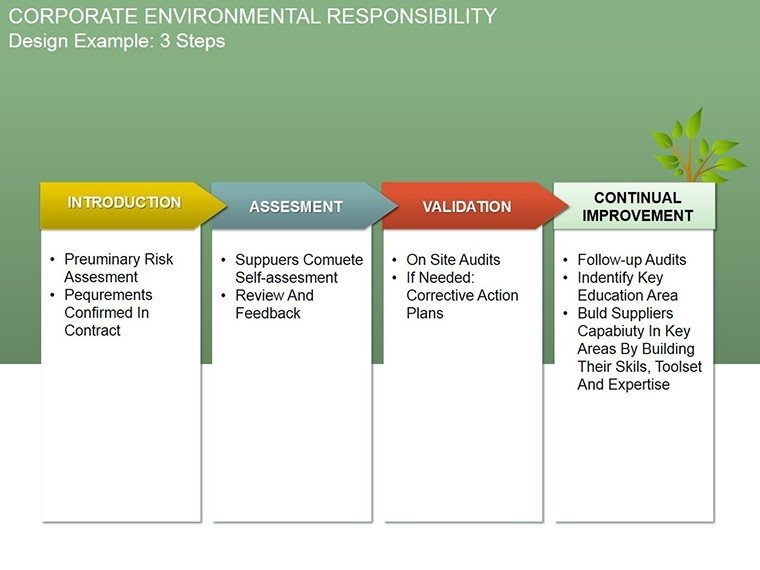
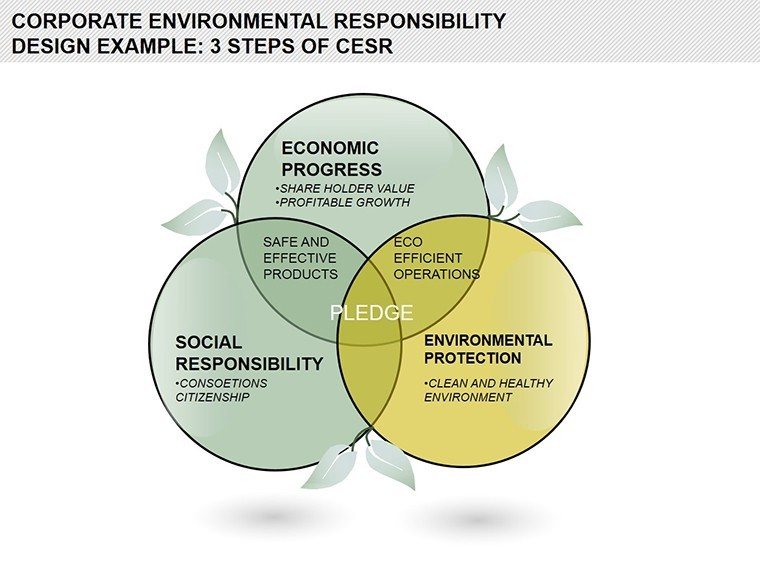
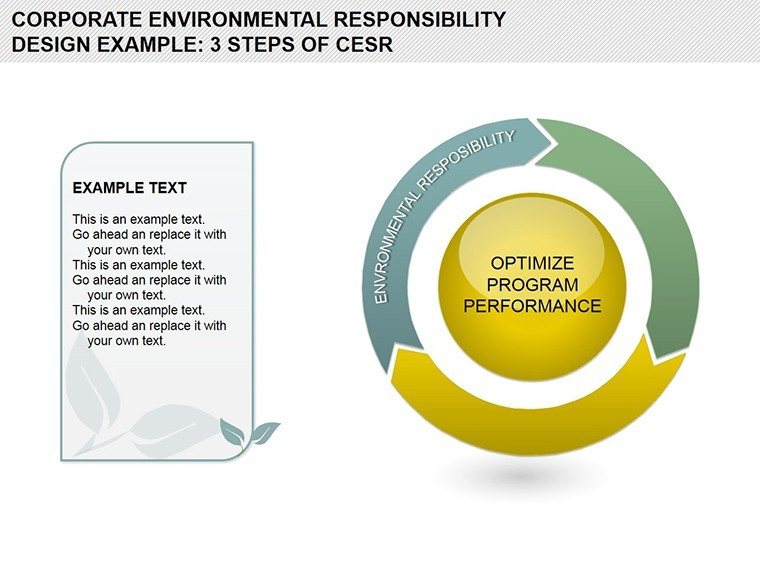
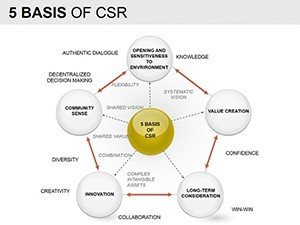
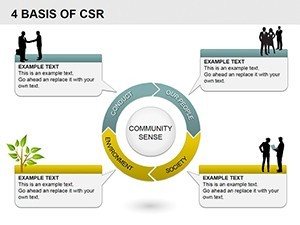
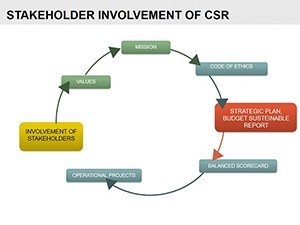
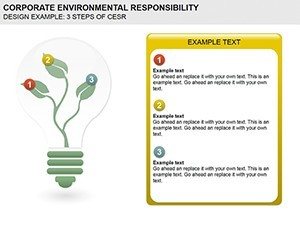
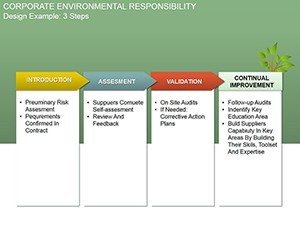
Begin with the foundational slide: a balanced wheel diagram dividing CSR into core domains - economic, legal, ethical, and philanthropic. Each spoke is independently adjustable, so you can emphasize, say, ethical sourcing by expanding its arc and infusing it with your brand's green hues. Follow up with process flows that trace compliance journeys, from assessment to auditing, using connected nodes that reveal interdependencies at a glance.
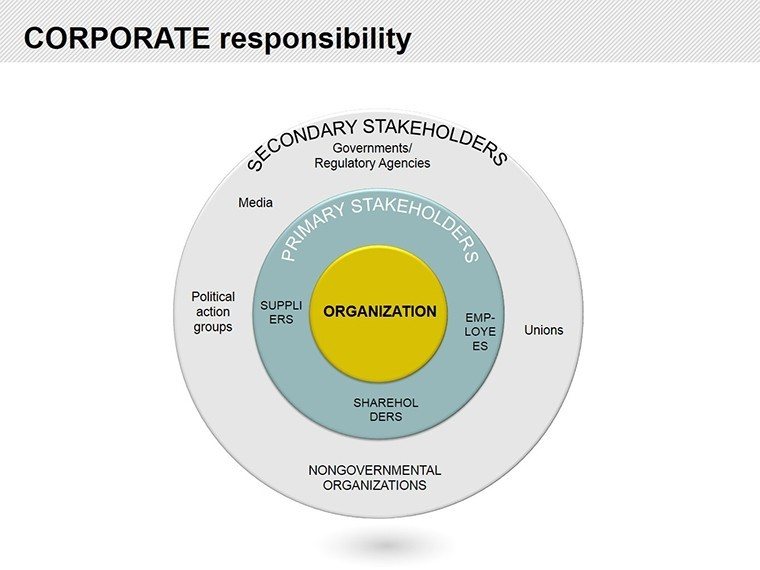
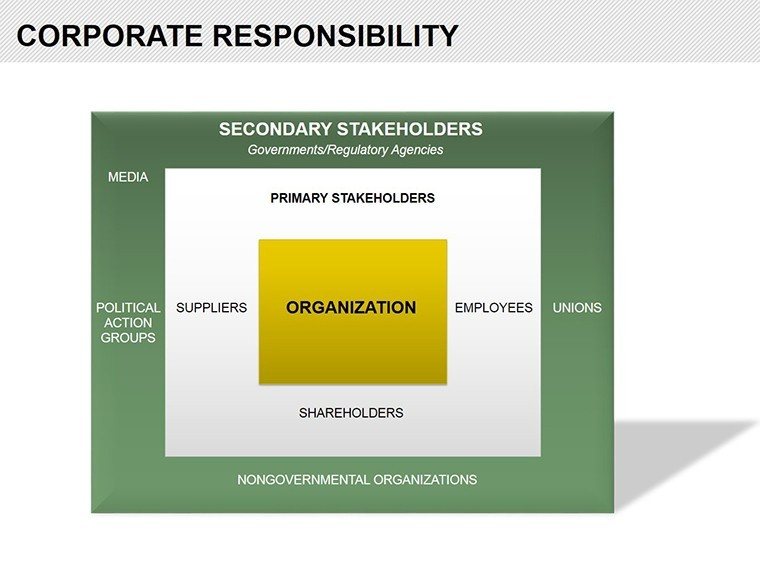
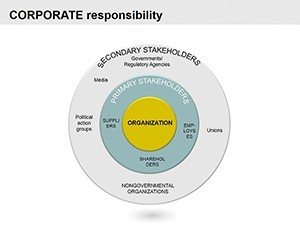
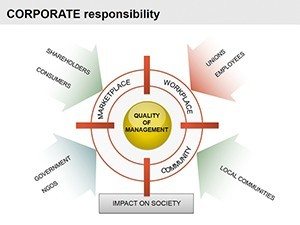
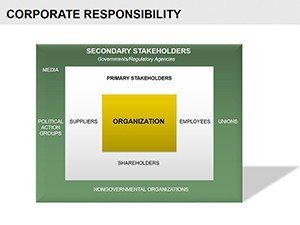
For deeper dives, organizational hierarchies map reporting lines, with expandable branches for sub-committees on diversity or supply chain ethics. These aren't rigid frameworks; they're malleable, with text placeholders that accommodate bullet-point evidence or hyperlinks to supporting docs. High-resolution icons - recycling symbols for eco-initiatives, handshakes for partnerships - add a layer of intuitive symbolism, making your points stick without explanation.
Built for PowerPoint 2016+, the template shines in collaborative settings, syncing via SharePoint for team refinements. Unlike clunky defaults, every element is grouped for effortless repositioning, ensuring your CSR story flows as smoothly as the principles it champions.
Applying These Diagrams in Key Scenarios
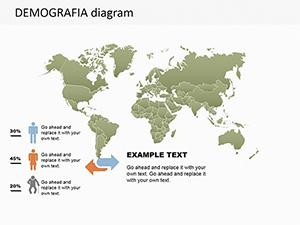
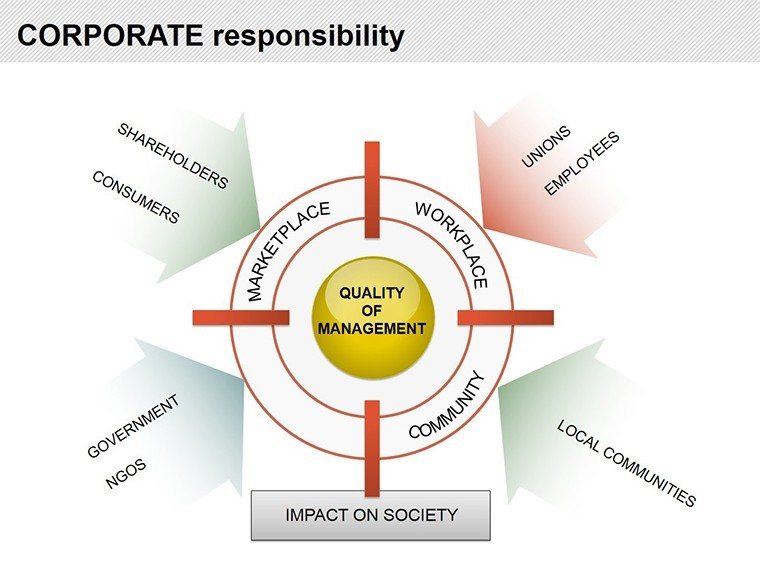
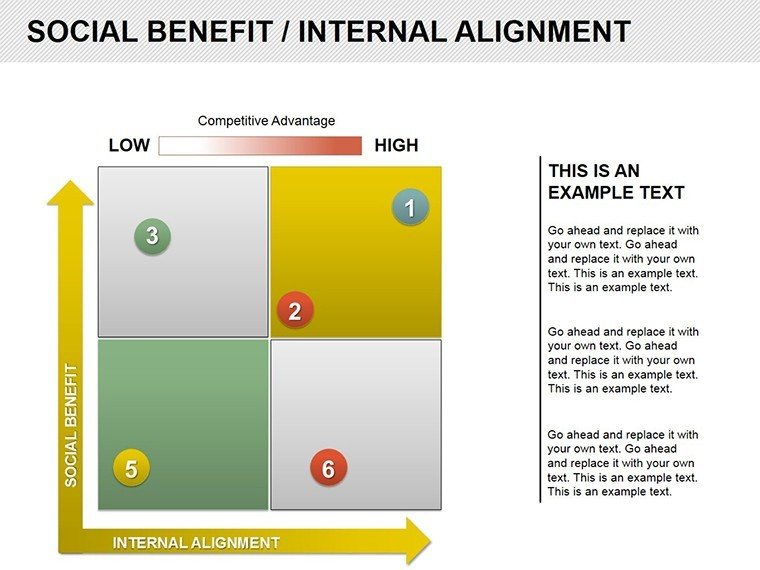
Consider a nonprofit director gearing up for a donor briefing. Slide five's radial chart radiates impact metrics from a central mission hub, curving outward to show ripple effects on communities - visually linking dollars donated to lives changed. Animating the expansion draws eyes to growth trajectories, turning a routine update into a compelling case for continued support.
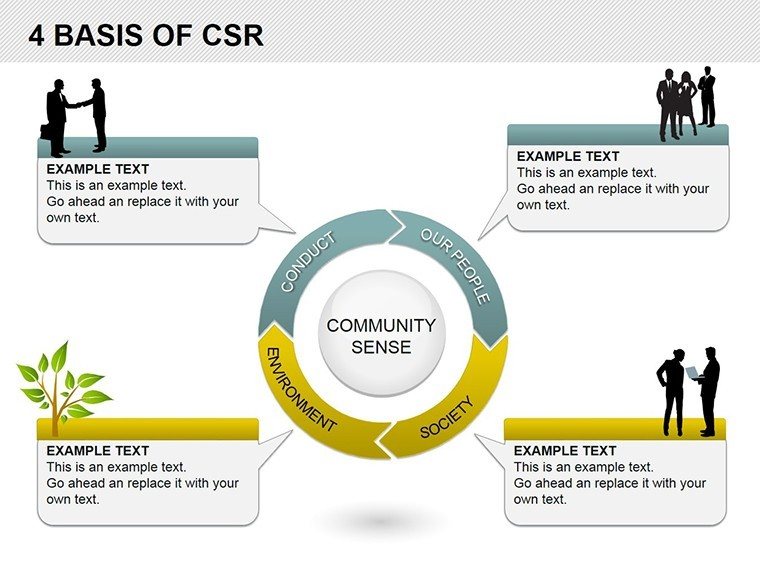
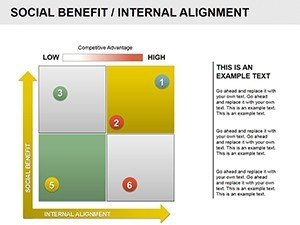
In a corporate boardroom, adapt the pie series for benchmarking: slice sustainability goals against industry averages, with editable labels calling out variances like reduced emissions. A strategy consultant might layer in a cycle for ongoing improvement, looping audit findings back to action plans, mirroring frameworks from global standards without copying them verbatim.
Step-by-step, here's how to integrate: First, import your data into the placeholders - Excel links keep it live. Next, theme the palette to evoke trust, perhaps earth tones for environmental slides. Finally, rehearse transitions to ensure the narrative arcs from challenges to triumphs, keeping viewers hooked.
- Domain Breakdowns: Segment responsibilities into digestible pies for quick scans.
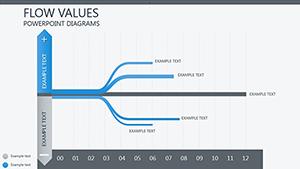
- Implementation Cycles: Trace policies through stages with flowing arrows and checkpoints.
- Governance Trees: Illustrate hierarchies to clarify accountability chains.
These tools extend beyond reports - to workshops where facilitators use them to brainstorm ethical dilemmas, or training sessions demystifying ESG metrics for new hires.
Enhancing Impact with Built-In Flexibility
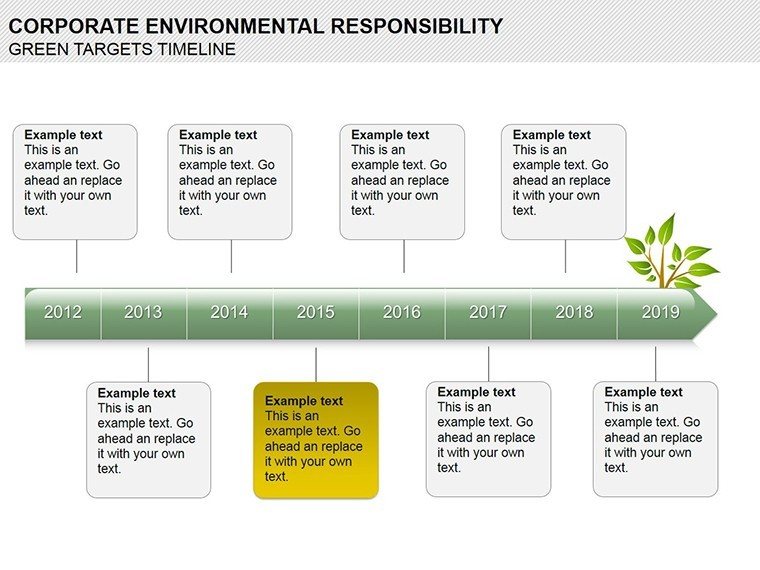
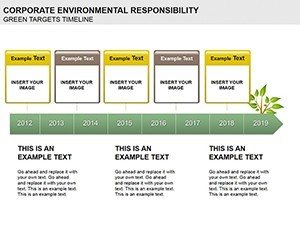
The true value emerges in adaptability: Reshape a cycle into a linear timeline for historical overviews, or fuse tables with icons for side-by-side policy comparisons. Vector graphics ensure sharpness across formats, from PDFs to interactive kiosks, while the compact file size supports quick loads in virtual meetings.
Aimed at leaders in sustainability and compliance, it addresses the gap between intention and illustration, much like how clear signage guides ethical navigation in real life. Elevate your voice in the responsibility conversation - download this template for $28 and start shaping narratives that matter.
Frequently Asked Questions
How flexible are the CSR diagrams for different reporting standards?
Highly adaptable; adjust segments and labels to align with GRI, SASB, or custom frameworks while maintaining visual coherence.
Does the template support data import from spreadsheets?
Yes, link charts directly to Excel for dynamic updates, refreshing visuals automatically as figures change.
Can I add animations to the process cycles?
Absolutely - use PowerPoint's built-in tools to sequence node appearances, revealing steps progressively for emphasis.
Is this suitable for non-profit presentations?
Perfectly; the neutral designs work for any sector, with icons versatile for community or advocacy focuses.
What versions of PowerPoint are compatible?
From 2016 onward, including Office 365, with full feature support on desktop apps.
How secure is the download and file format?
Instant .pptx delivery via secure link; files are password-free but editable only by you post-purchase.