Green Progress PowerPoint Diagrams Template


Tracking progress in projects or business initiatives demands visuals that are both eco-friendly in theme and efficient in communication. The Green Progress PowerPoint Diagrams template caters to project managers, analysts, and vendors seeking to integrate sustainable motifs with robust data visualization. Boasting 20 editable slides, it features matrix and table designs ideal for proposals, partner distributions, and performance reviews, echoing strategies from agile methodologies endorsed by the Project Management Institute (PMI). This template turns complex datasets into green-themed narratives, much like how environmental firms like Siemens use visuals for sustainability reports.
Feel the momentum build as your audience grasps key milestones through intuitive diagrams. Fully compatible with PowerPoint, it ensures trustworthiness with high-res graphics that adapt to various screen resolutions.
Standout Features for Progress Tracking
Centered on matrix layouts and tables, the slides allow for multi-dimensional data display, with full editability to fit your metrics.
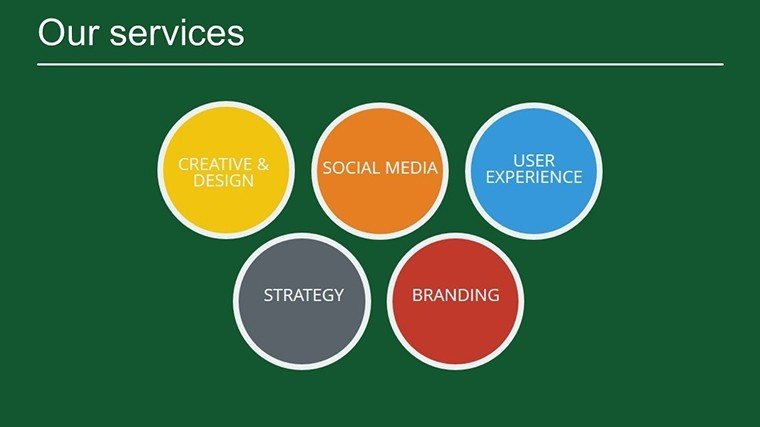
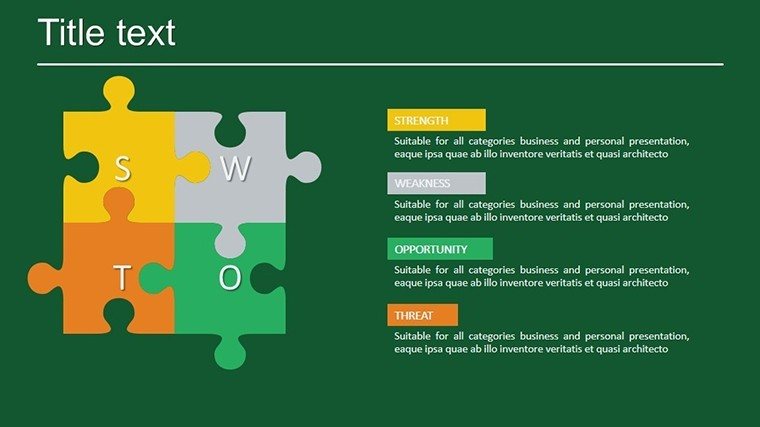
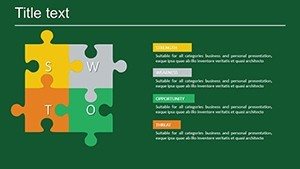
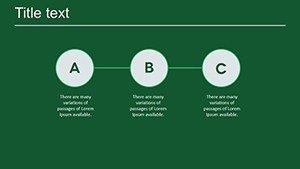
- Matrix Diagrams: For comparative analyses, like SWOT or risk assessments.
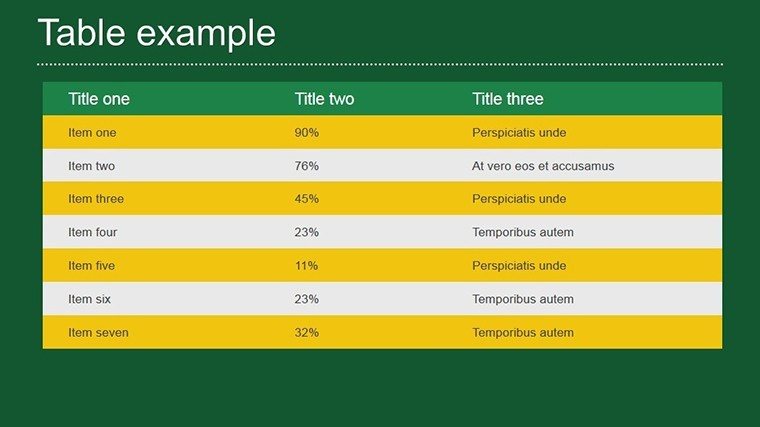
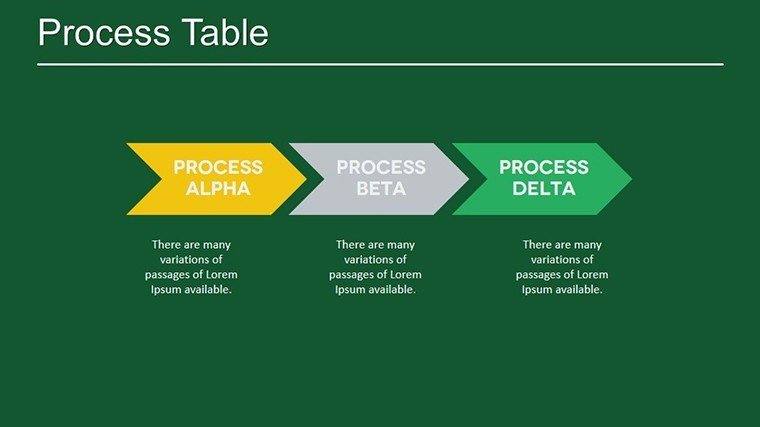
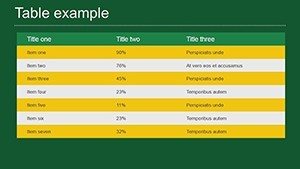
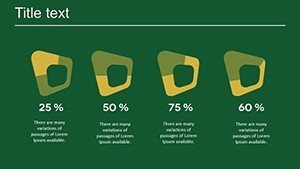
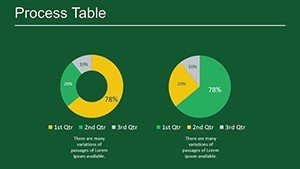
- Progress Tables: Track KPIs with color-coded cells in green hues.
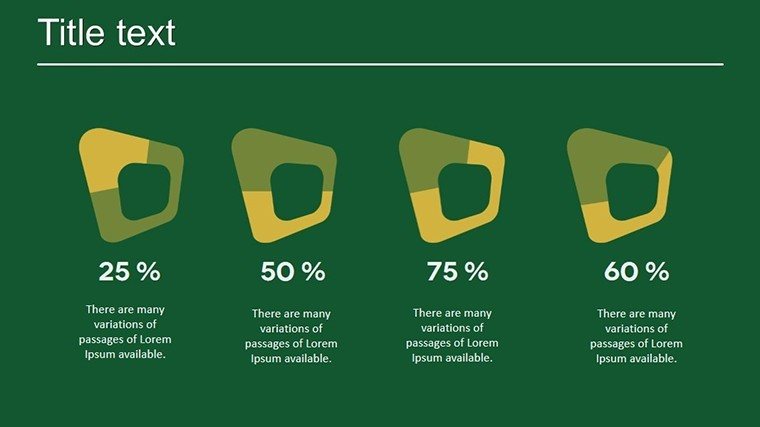
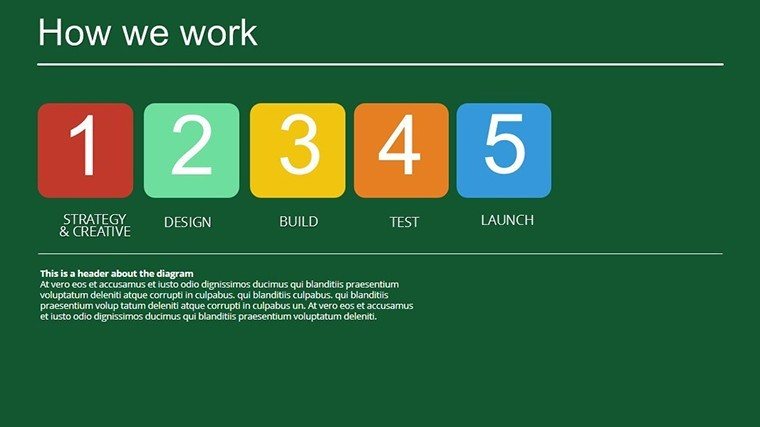
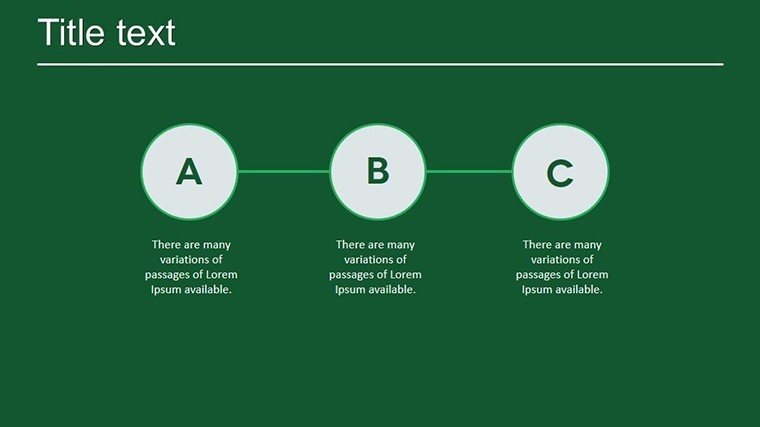
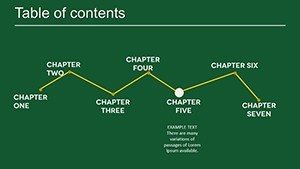
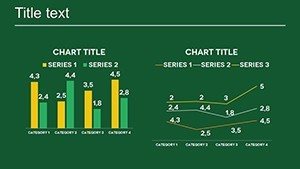
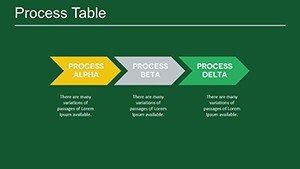
- Timeline Visuals: Sequential bars for project phases.
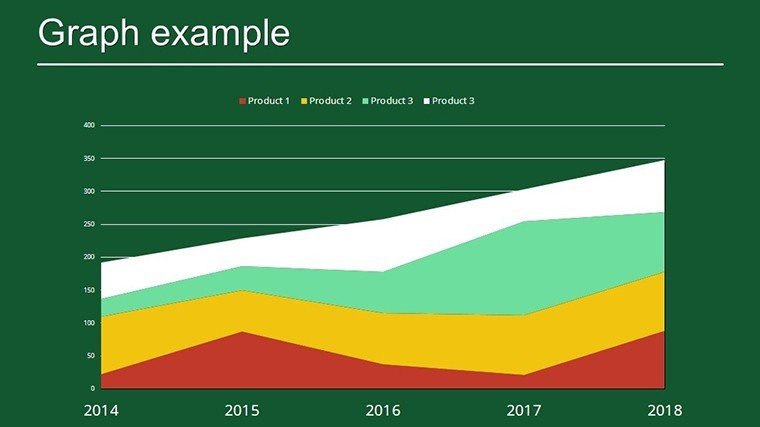
- Data Integration: Easy embedding from Excel for real-time updates.
- Thematic Consistency: Green palette symbolizing growth and eco-progress.
Incorporating terms like "project progress charts" organically enhances relevance.
Applications in Professional Scenarios
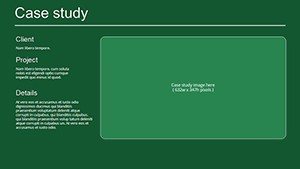
For vendor proposals, utilize Slide #4's grid matrix to compare options, customizing with your data for persuasive impact. In partner meetings, Slide #9's table highlights shared goals, as in case studies from Scrum Alliance where visuals accelerated alignment by 35%.
Implementation steps: Load the .pptx, edit a matrix on Slide #1 by selecting cells and inputting values. For Slide #15, add conditional formatting for visual cues on progress.
Edges Over Built-In Tools
This template surpasses default tables with pre-designed themes, ensuring a cohesive, professional output that instills confidence.
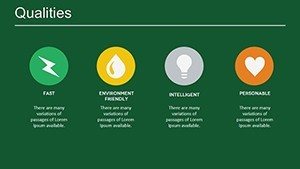
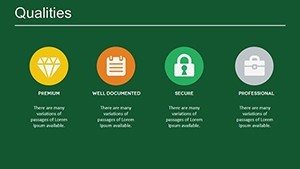
Expert advice: Use the rule of thirds for layout balance, and incorporate icons for quick comprehension, per design principles from Nielsen Norman Group.
Advancing Your Data Storytelling
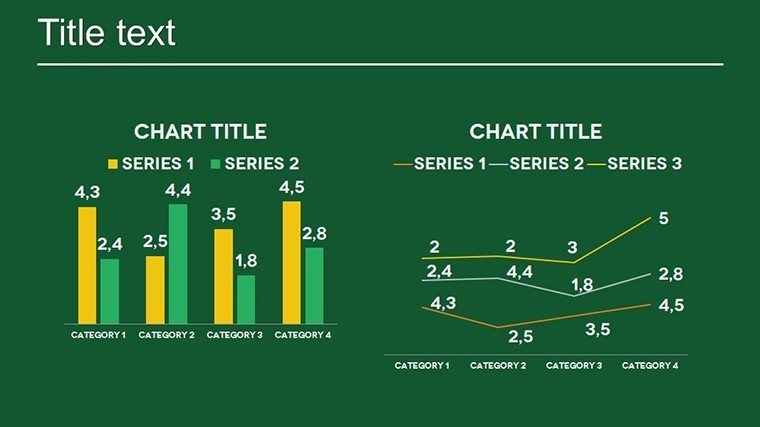
Extend to sustainability reports by merging Slide #18's charts with external links. A tech startup credited similar templates for clearer investor pitches. It's your tool for forward momentum.
Unlock progress visuals - download and customize this template to propel your projects forward.
Frequently Asked Questions
How flexible are the progress diagrams?
Fully flexible, edit all elements to match your data needs.
Works with older PowerPoint versions?
Yes, compatible from PowerPoint 2010 onward.
Ideal for eco-themed presentations?
Perfect, with green designs emphasizing sustainability.
File format details?
.pptx for easy PowerPoint access.
Can I animate the matrices?
Yes, add animations for step-by-step reveals.
Suitable for team collaborations?
Absolutely, share via OneDrive for edits.