Conditions PowerPoint Diagrams: Mastering Event-Driven Visuals


Type: PowerPoint Diagrams template
Category: Relationship, Venn
Sources Available: .pptx
Product ID: PD00198
Template incl.: 45 editable slides
In today's fast-paced professional world, where decisions hinge on understanding intricate conditions and their outcomes, having the right tools to visualize these dynamics can make all the difference. Imagine transforming abstract concepts like event triggers and behavioral sequences into clear, compelling diagrams that captivate your audience. That's exactly what our Conditions PowerPoint Diagrams template offers - a comprehensive set of 45 fully editable slides designed specifically for presenters who need to convey relationships, overlaps, and conditional flows with precision and flair.
Whether you're a project manager outlining contingency plans, a software developer mapping if-then logic in algorithms, or a marketer analyzing consumer behavior patterns, this template empowers you to turn data into stories. Drawing from real-world applications, such as those seen in agile methodologies where conditions dictate sprint outcomes, these diagrams align with industry standards like those from the Project Management Institute (PMI). No more struggling with basic shapes; dive into professionally crafted Venn diagrams for intersection analysis and relationship charts that highlight dependencies, all while maintaining a sleek, modern aesthetic that resonates with stakeholders.
Key Features That Set This Template Apart
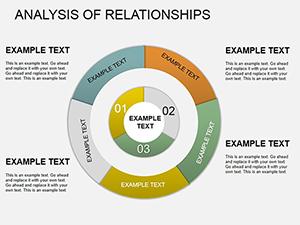
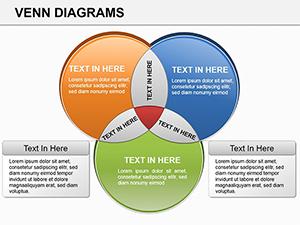
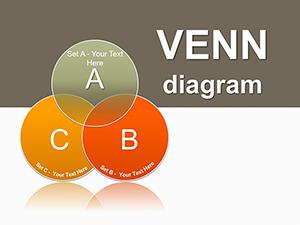
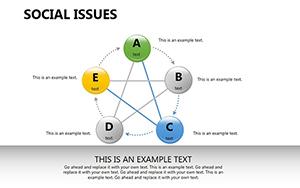
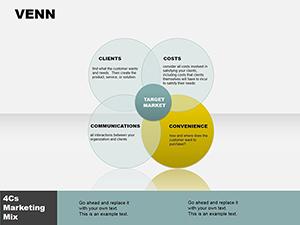
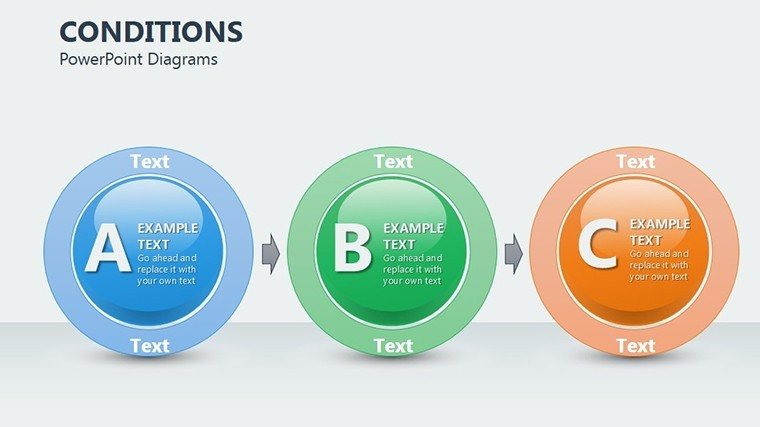
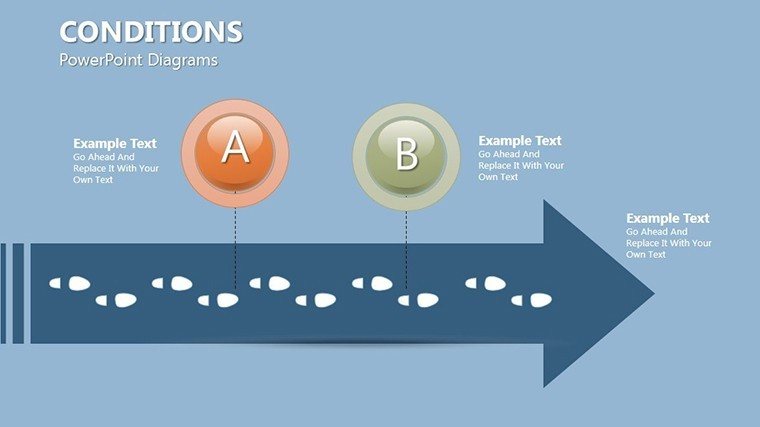
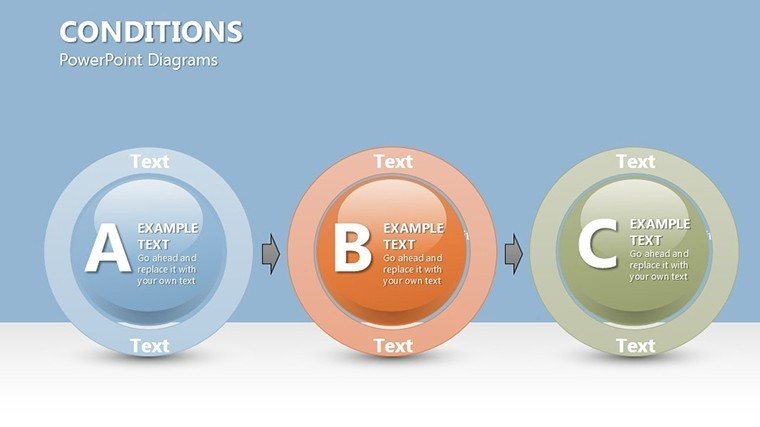
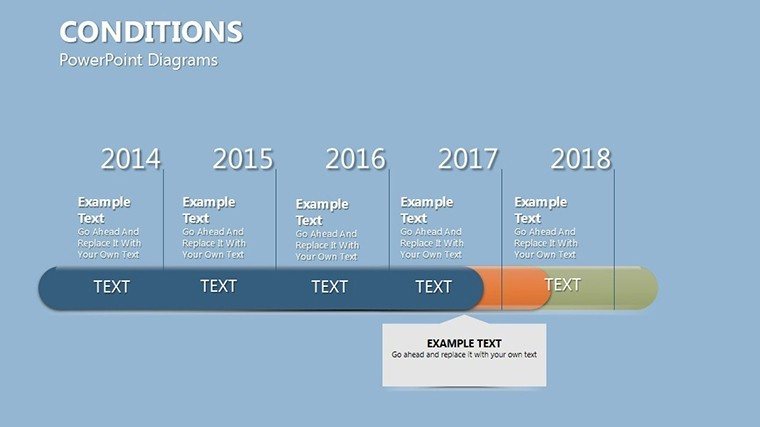
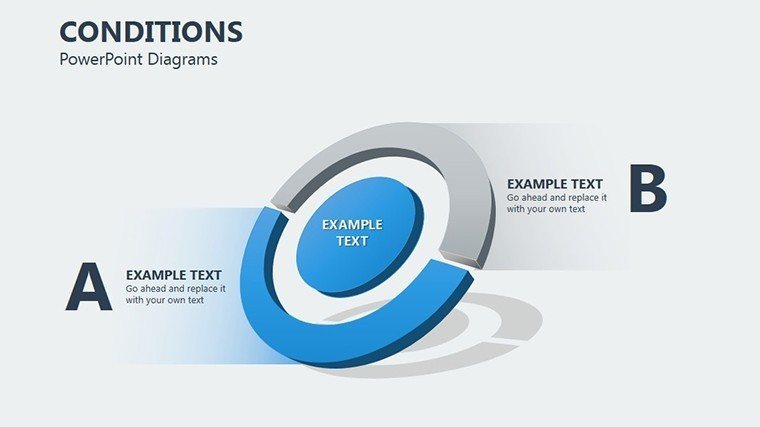
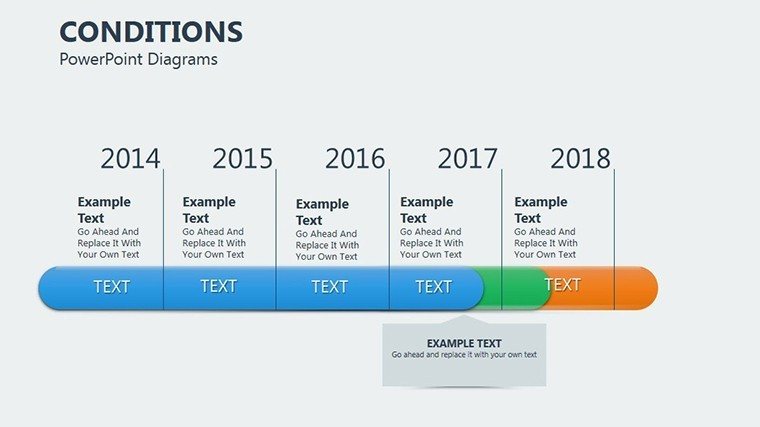
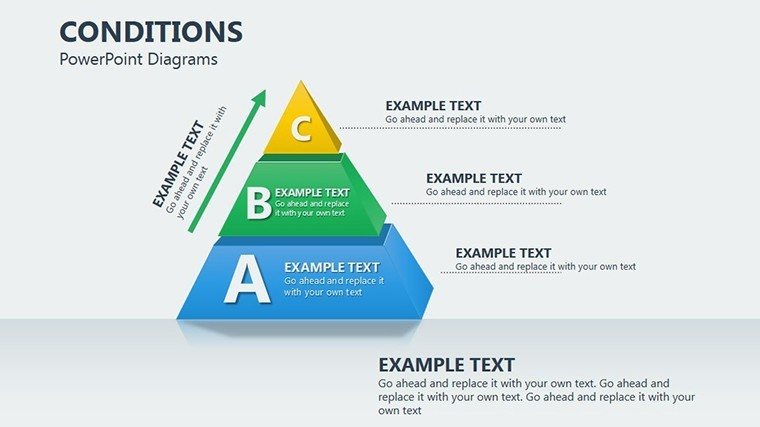
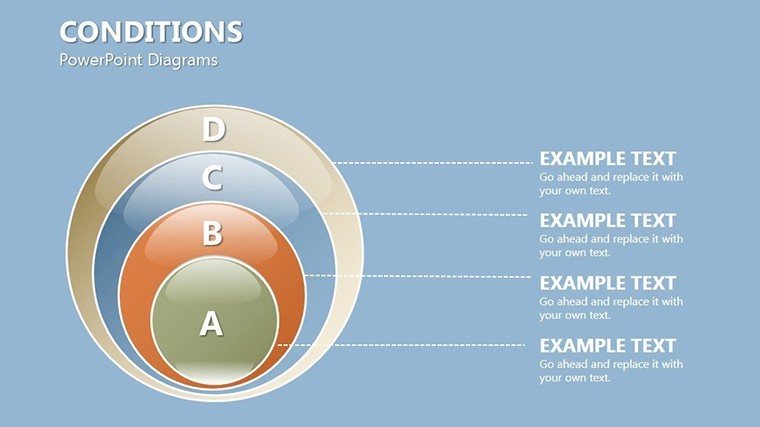
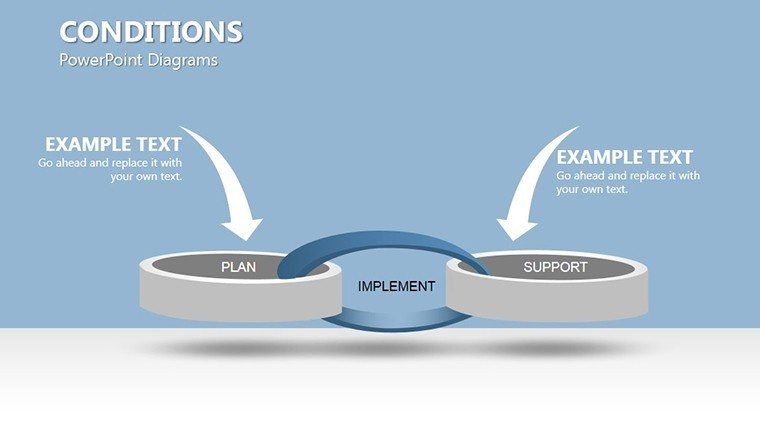
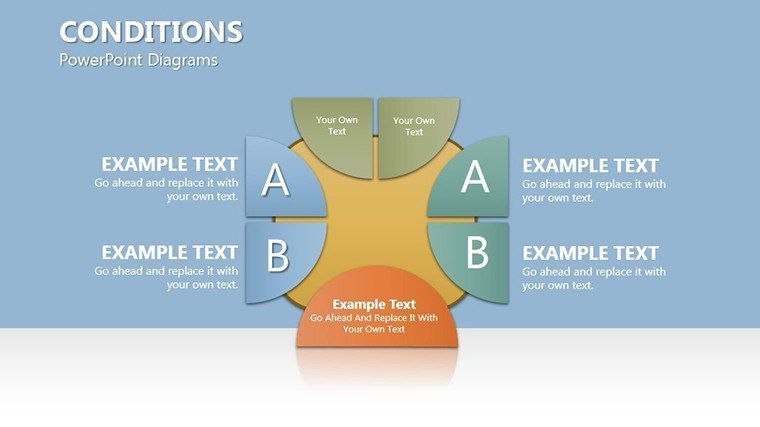
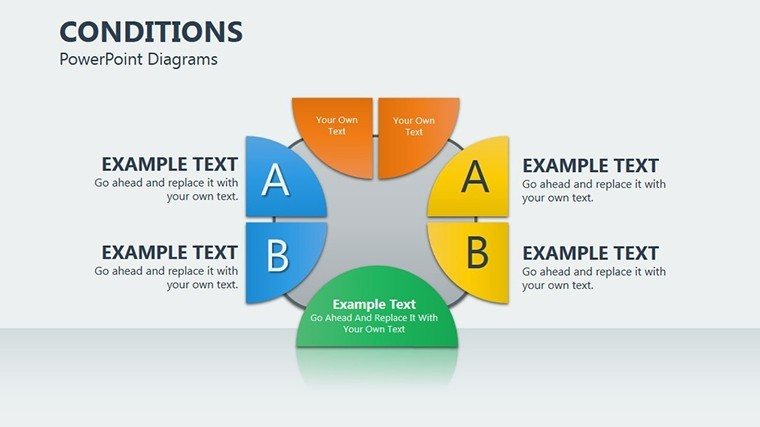
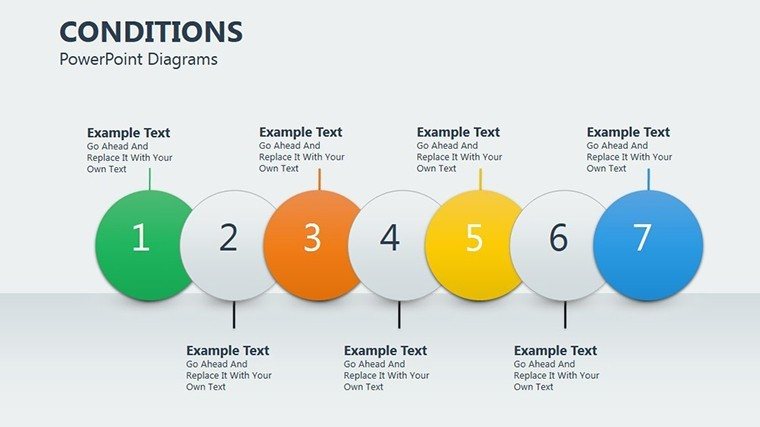
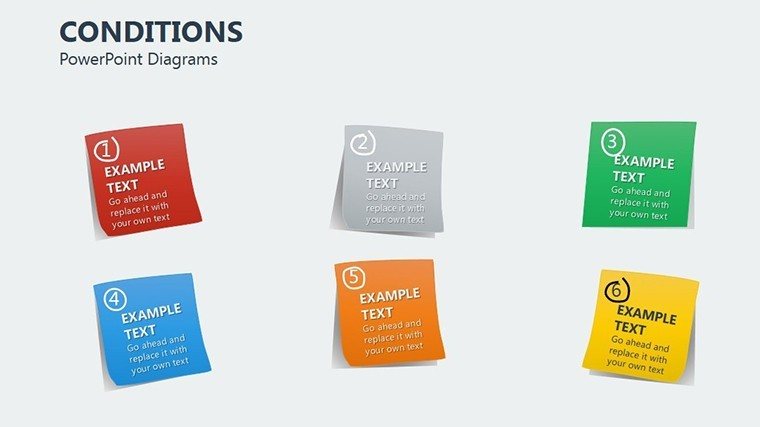
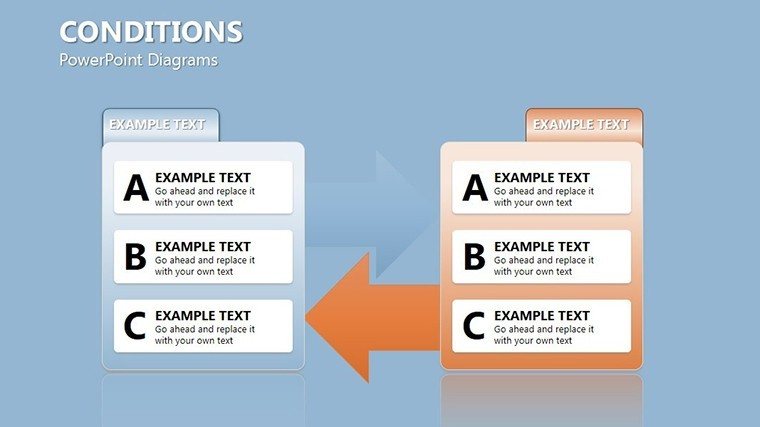
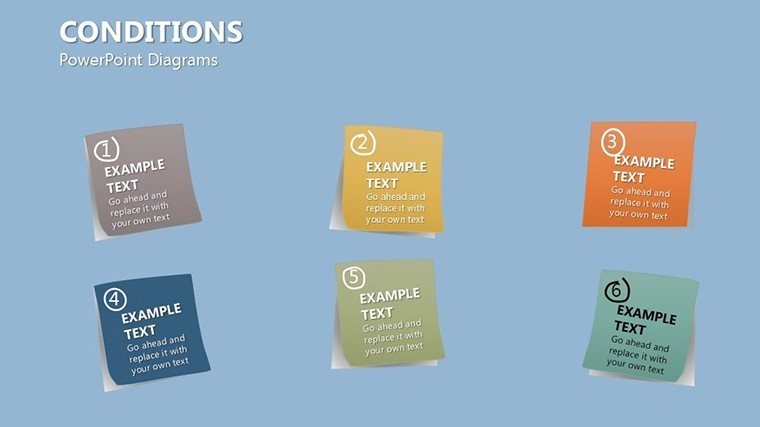
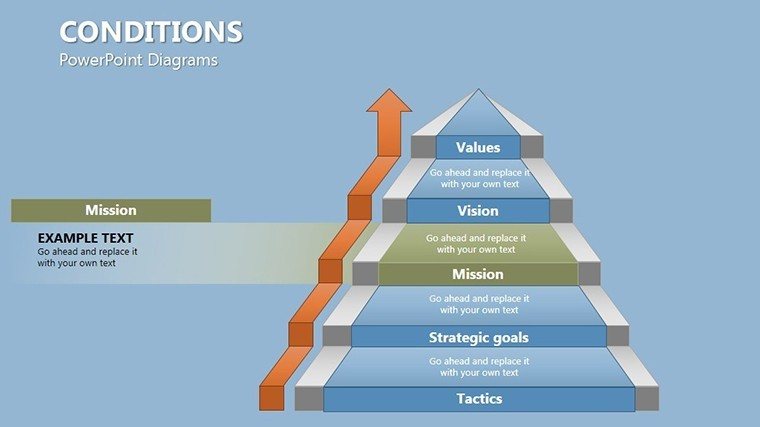
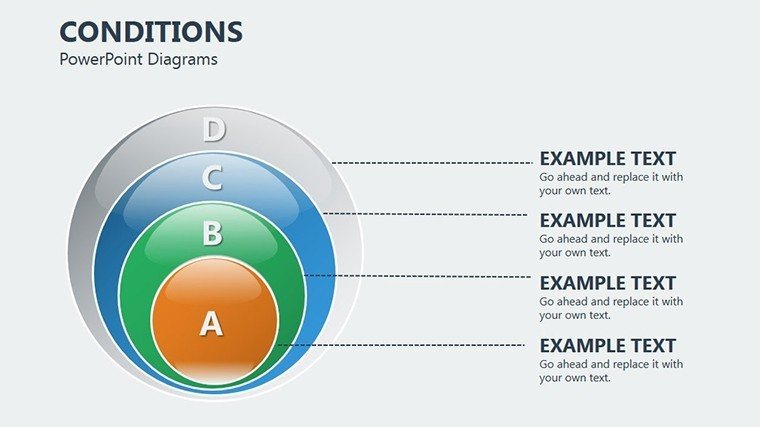
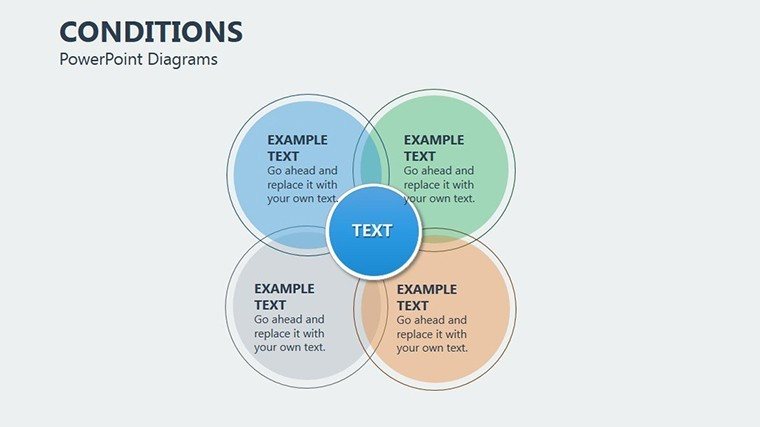
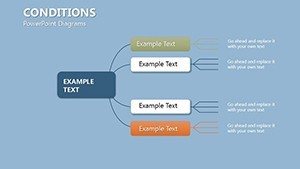
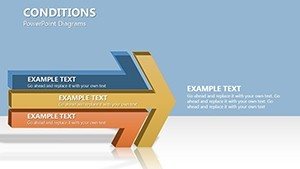
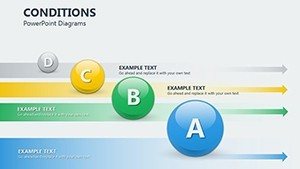
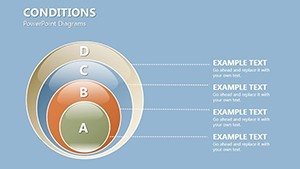
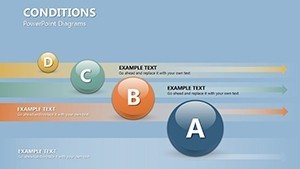
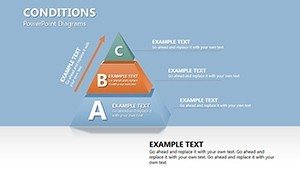
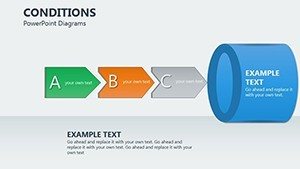
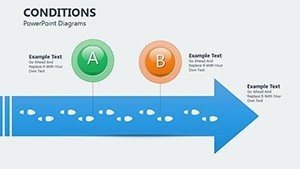
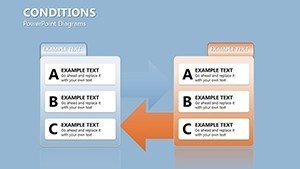
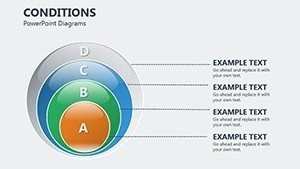
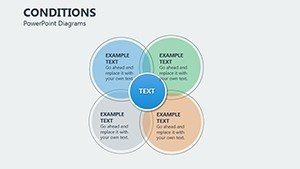
At the heart of this template are its versatile features, tailored to enhance your workflow without overwhelming you with complexity. Each of the 45 slides is built with scalability in mind, allowing you to resize elements, change colors, and adjust text effortlessly in PowerPoint. For instance, the Venn diagram slides come in multiple configurations - two-circle for simple comparisons, three-circle for multifaceted overlaps, and even advanced four-set versions for detailed event condition mapping.
- Editable Graphics: All shapes and lines are vector-based, ensuring crisp quality at any zoom level. Customize icons representing events or agents to fit your narrative, like swapping a generic trigger symbol for a industry-specific one, such as a code snippet for tech presentations.
- Color Themes: Pre-set palettes inspired by conditional logic visuals - think cool blues for stable conditions and warm reds for high-impact events - but fully adjustable to match your brand guidelines.
- Animation Ready: Built-in transitions that reveal conditions sequentially, perfect for walking audiences through behavioral chains without cluttering the slide.
- Compatibility Assurance: Seamlessly works with Microsoft PowerPoint 2016 and later versions, including Office 365, ensuring no compatibility hiccups during collaborations.
Beyond these, the template includes placeholder text that's contextually relevant, drawing from behavioral economics principles, like those discussed in Daniel Kahneman's work, to guide your content creation. This isn't just a set of slides; it's a toolkit that boosts your authority by aligning with expert practices in data visualization.
Detailed Slide Breakdown for Maximum Utility
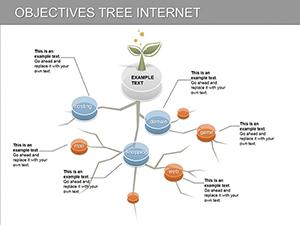
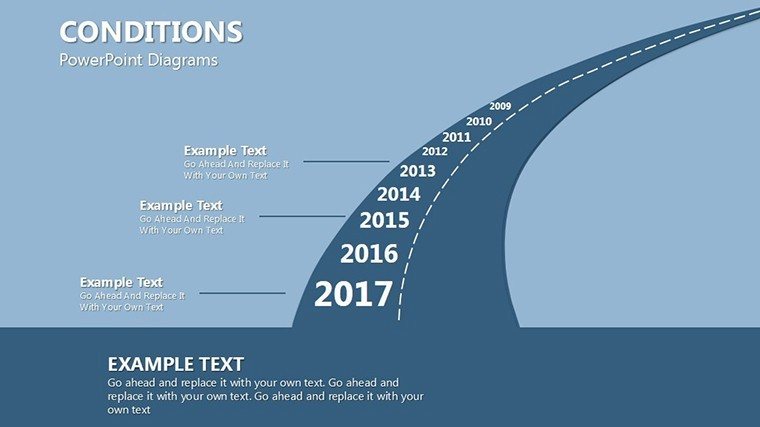
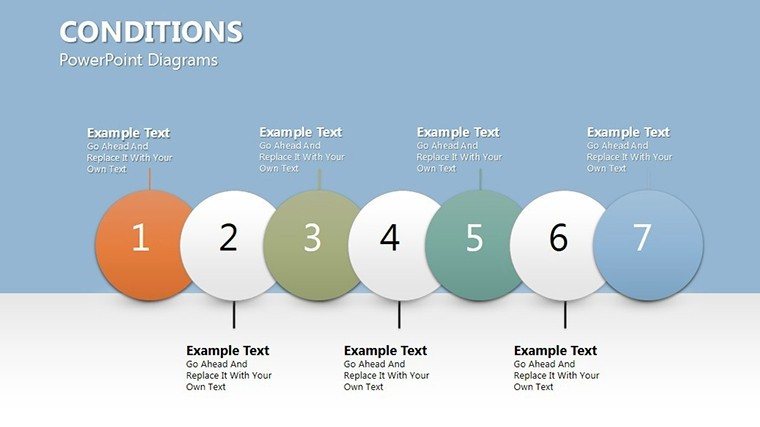
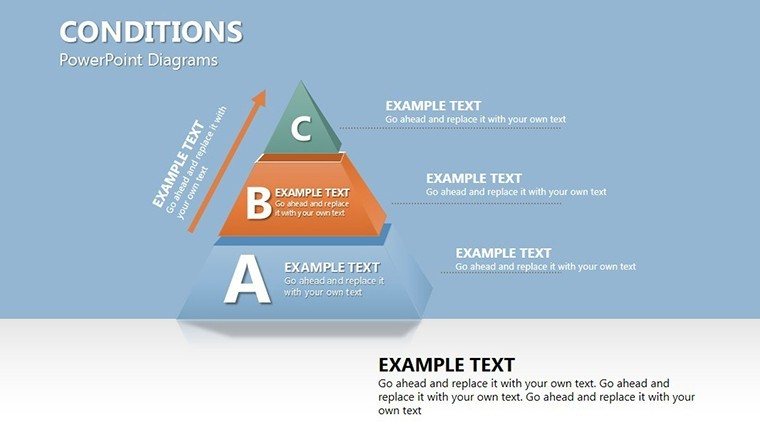
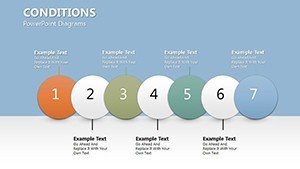
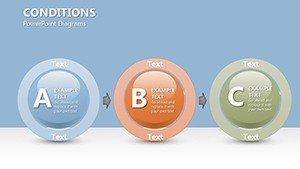
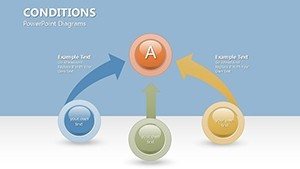
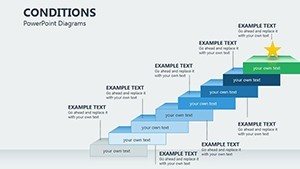
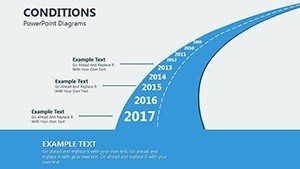
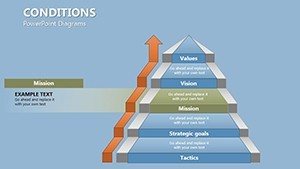
Let's delve deeper into what you'll find across these 45 slides. The collection is organized thematically, starting with basic condition setups and progressing to complex multi-agent scenarios. Slide 1-5 focus on introductory Venn diagrams, ideal for showing how single events can branch into multiple conditions - think of it as visualizing a decision tree in a business strategy session.
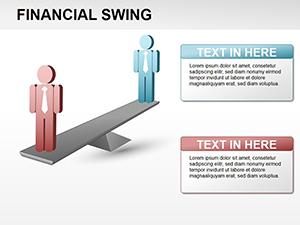
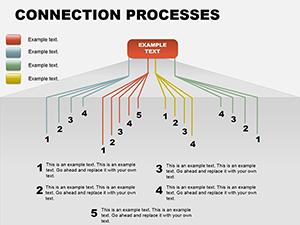
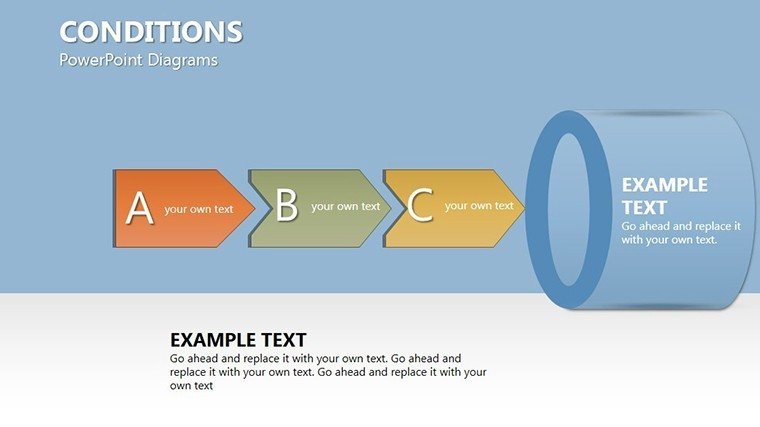
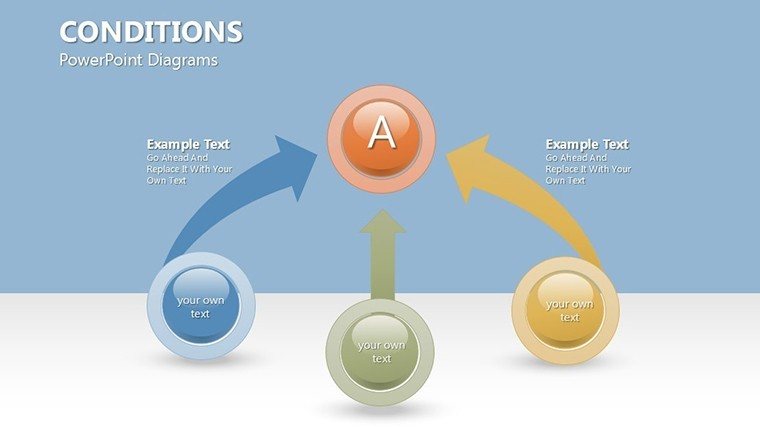
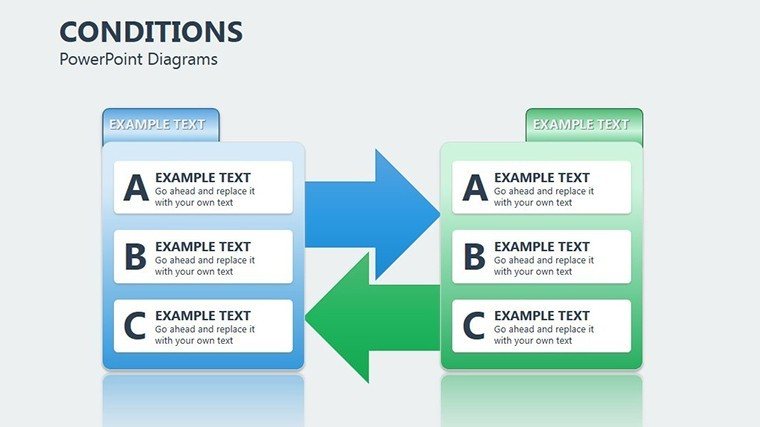
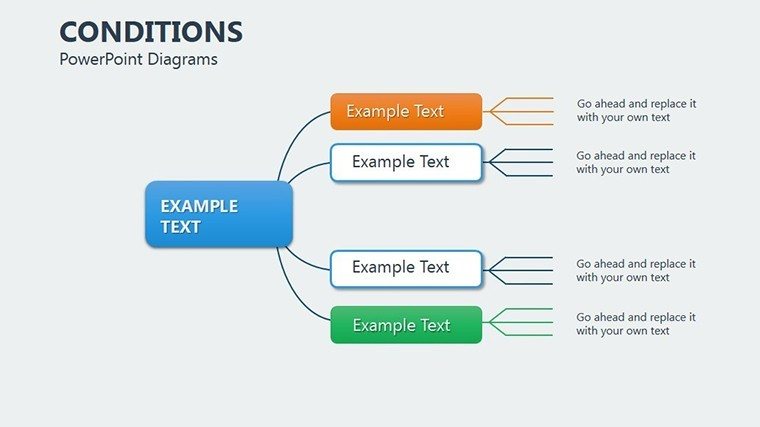
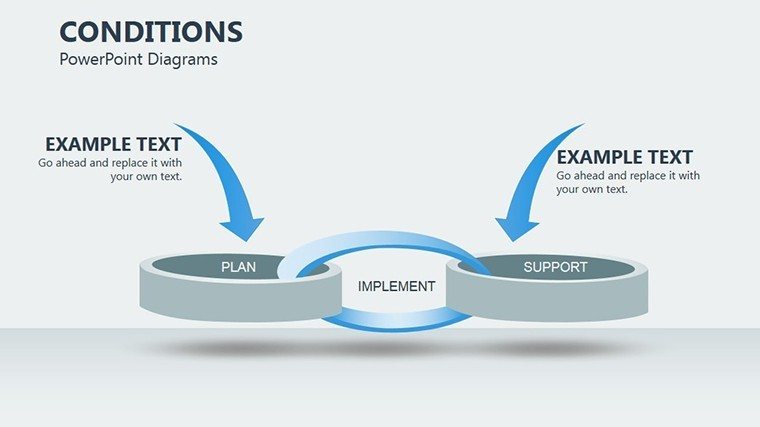
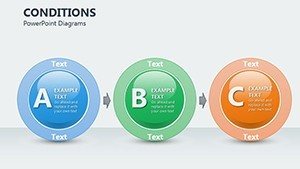
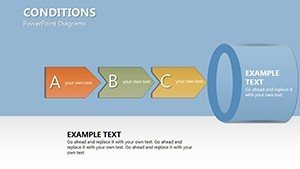
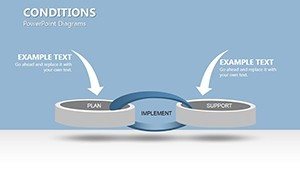
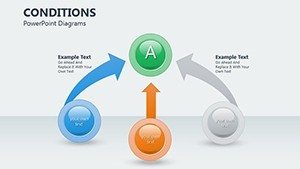
Moving to slides 6-15, you'll encounter relationship charts that map successive behaviors. For example, Slide 8 features a linear flow diagram where conditions trigger actions, complete with editable arrows and nodes. This is particularly useful in case studies, such as a healthcare presentation on patient treatment paths, where conditions like symptoms lead to diagnostic events.
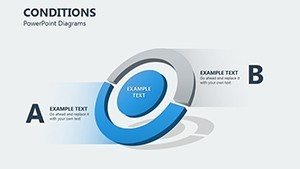
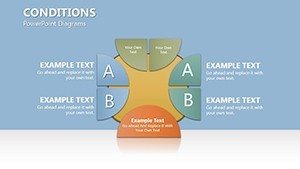
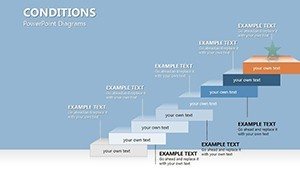
Slides 16-30 expand into hybrid models, combining Venn overlaps with relational links. Here, you can illustrate qualitative differences in agent behaviors, perhaps in an educational context explaining ecological systems where environmental conditions affect species interactions. Each slide includes subtle grid lines for alignment, a nod to design best practices from pros like Edward Tufte, ensuring your visuals are both informative and aesthetically pleasing.
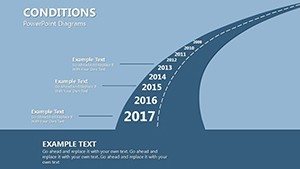
The final batch, slides 31-45, offers advanced customizations, including 3D-rendered Venn spheres for a modern twist and interactive hotspots for hyperlinks to supporting data. Imagine presenting a financial report where clicking a condition node reveals market trend graphs - this template makes it straightforward.
Real-World Applications and Use Cases
One of the standout benefits of this template is its adaptability across industries. Take, for instance, a software engineering team at a firm like Google, where conditions diagrams are used to prototype user experience flows. By customizing these slides, they can simulate event-driven architectures, reducing development time by up to 30%, as per studies from the IEEE on visual modeling tools.
In marketing, professionals leverage these diagrams to dissect campaign triggers. A case study from a digital agency showed how Venn diagrams helped identify overlapping audience segments, leading to a 25% increase in engagement rates. For educators, these slides bring abstract concepts to life - picture a psychology lecture on behavioral conditioning, where relationship charts clarify Pavlovian responses versus operant ones.
- Project Planning: Map out risk conditions and mitigation strategies, aligning with PMI's risk management framework.
- Scientific Research: Visualize experimental conditions and variables, enhancing clarity in peer-reviewed presentations.
- Business Analytics: Analyze market events and behavioral patterns, supporting data-driven decisions with tools like those from Gartner reports.
To integrate seamlessly, start by importing your data - perhaps from Excel - and use the template's smart guides to align elements. Add your touch with fonts that match AIA standards for architectural pitches if needed, though this template shines in logical domains. The result? Presentations that not only inform but inspire action, turning passive viewers into engaged participants.
Expert Tips for Customization and Best Practices
As an SEO and design expert with years in crafting high-impact visuals, I recommend starting small: Select a core slide, like a basic Venn, and build your narrative around it. Use contrasting colors for conditions versus outcomes to guide the eye, a technique backed by color theory in UX design. Avoid overcrowding - aim for no more than five elements per slide to maintain focus, as per Nielsen Norman Group's usability heuristics.
For advanced users, layer animations to simulate event sequences: Fade in conditions one by one, revealing behaviors dynamically. If collaborating, utilize PowerPoint's co-authoring features with this template's clean structure to prevent version conflicts. And remember, trustworthiness comes from accuracy - cross-reference your diagrams with reliable sources, like academic journals on event modeling, to bolster your in presentations.
In a world where attention spans are short, these diagrams cut through the noise, making your points stick. Whether pitching to executives or teaching a class, the clarity they provide can be the edge you need.
Elevate Your Event Visuals Today
Ready to transform how you present conditions and behaviors? With this template's robust features and user-centric design, you're set to create standout slides that drive results. Don't settle for generic visuals - customize these now and watch your presentations soar.
Frequently Asked Questions
- How editable are the diagrams in this template?
- All 45 slides are fully editable, allowing changes to shapes, colors, text, and layouts directly in PowerPoint.
- Is this compatible with Google Slides?
- While optimized for PowerPoint, you can import .pptx files into Google Slides, though some animations may need adjustments.
- What industries benefit most from these condition diagrams?
- Ideal for tech, marketing, education, and project management, where visualizing events and behaviors is key.
- Can I add my own data to the charts?
- Yes, easily integrate data from Excel or other sources to populate the diagrams.
- Are there any usage restrictions?
- No, once purchased, use freely for personal or professional presentations.