Achievement PowerPoint Diagrams


Ever wondered what separates dreamers from doers? It's the ability to chart a clear path from ambition to accomplishment. Our Achievement PowerPoint Diagrams template equips you with the tools to do just that. Featuring 12 editable slides centered on cycles and graphs, this resource is ideal for motivational speakers, project managers, and educators. It demystifies the journey to success, addressing key questions like necessary conditions and strategies for overcoming hurdles. Whether in a boardroom or classroom, these diagrams turn vague aspirations into structured, visual plans that inspire action and deliver results.
Grounded in psychological principles from experts like Carol Dweck's growth mindset theory, this template offers more than visuals - it's a framework for fostering resilience. Picture a tech startup using cycle diagrams to depict iterative product development, aligning team efforts with milestones that lead to market breakthroughs, as seen in Silicon Valley success stories documented by Forbes.
Core Features That Fuel Achievement
Designed for impact, each slide boasts scalable vectors and a harmonious color scheme of motivating reds and stabilizing blues, fully adjustable to your style. Seamless integration with PowerPoint ensures no learning curve, while Google Slides compatibility supports collaborative editing.
Slide-by-Slide Exploration
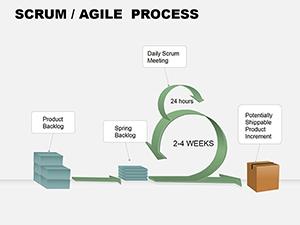
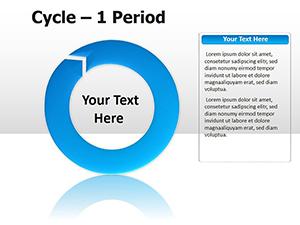
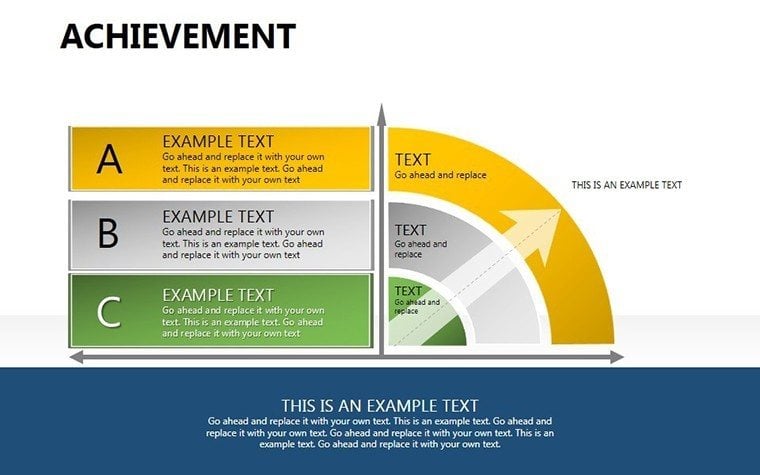
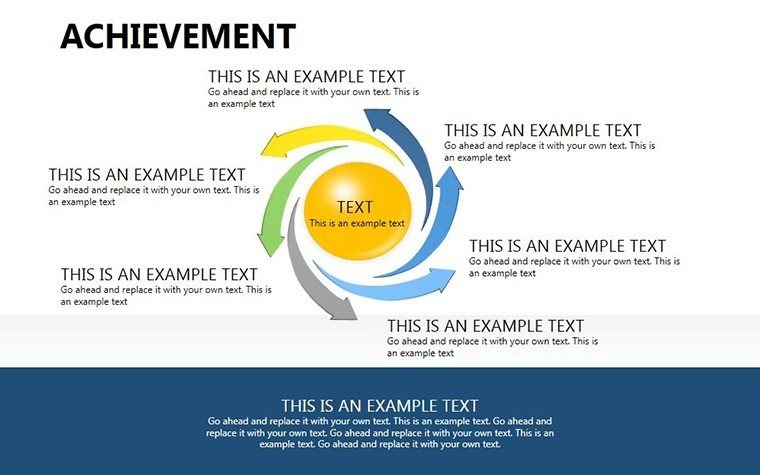
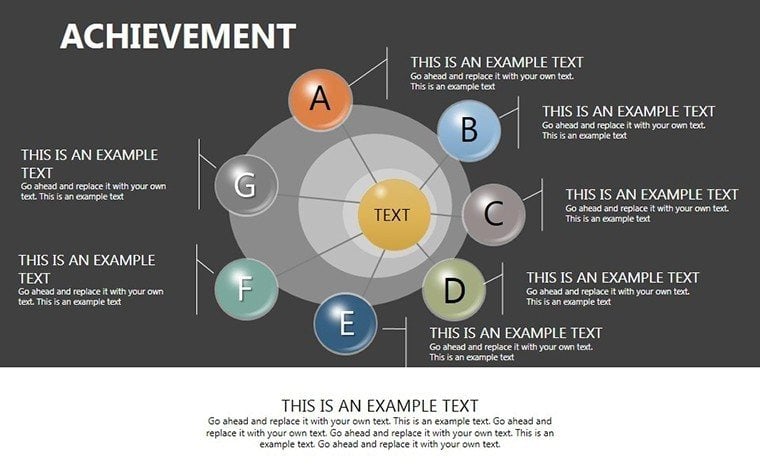
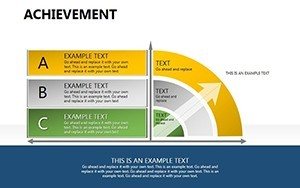
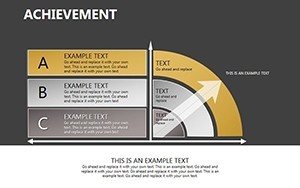
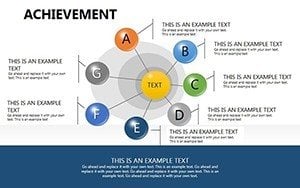
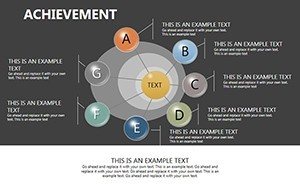
- Slide 1: Success Cycle Overview - A looping diagram outlining goal-result loops, great for introductory hooks.
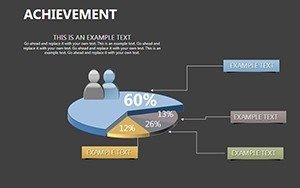
- Slides 2-5: Progress Graphs - Bar and line charts to track metrics, with axes for custom data input.
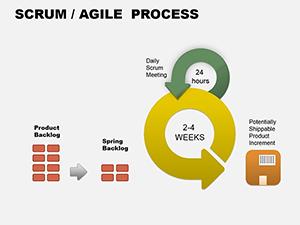
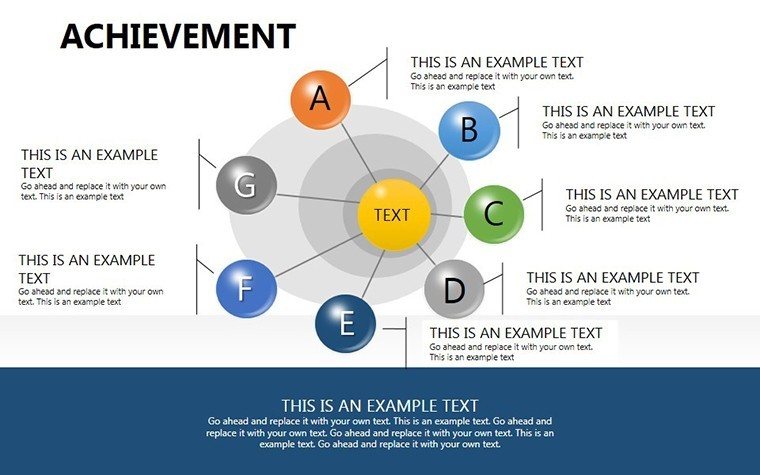
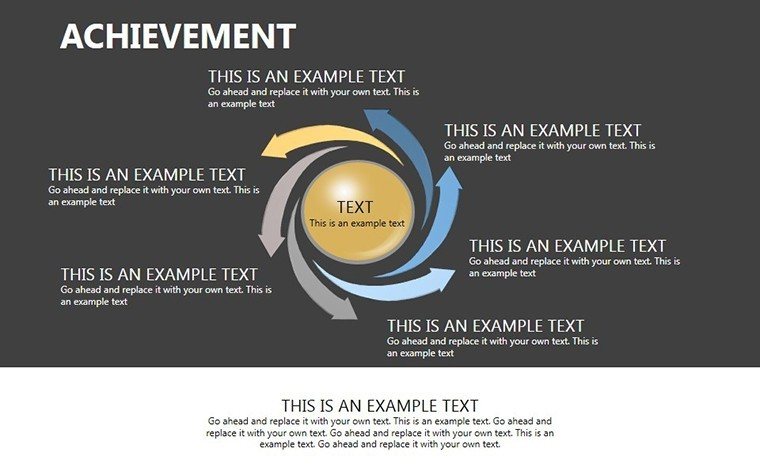
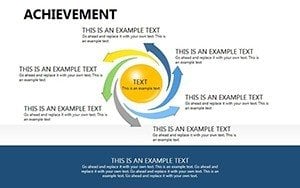
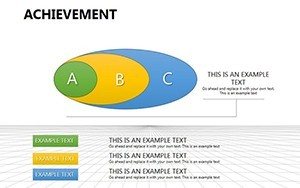
- Slides 6-9: Challenge Resolution Cycles - Circular flows showing problem-to-solution evolutions, icon-enhanced for clarity.
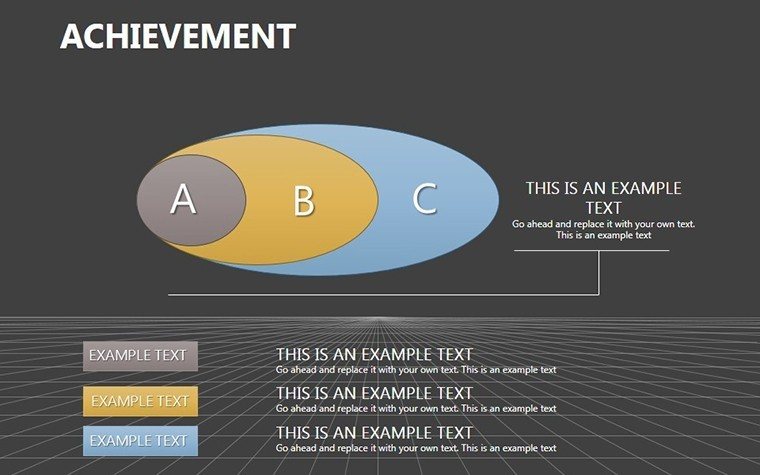
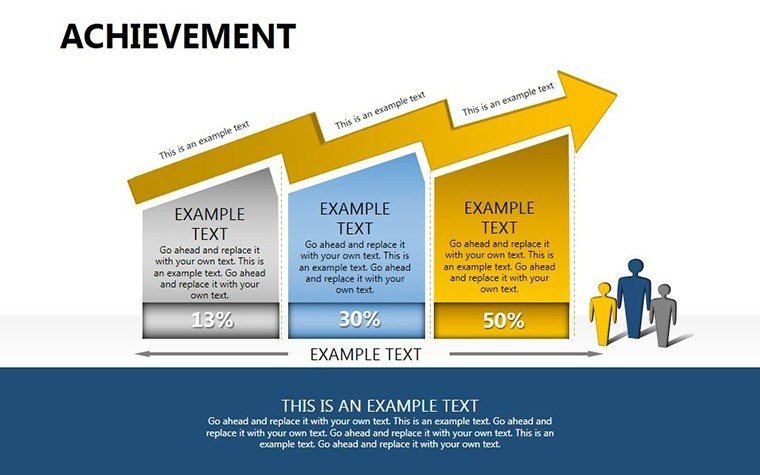
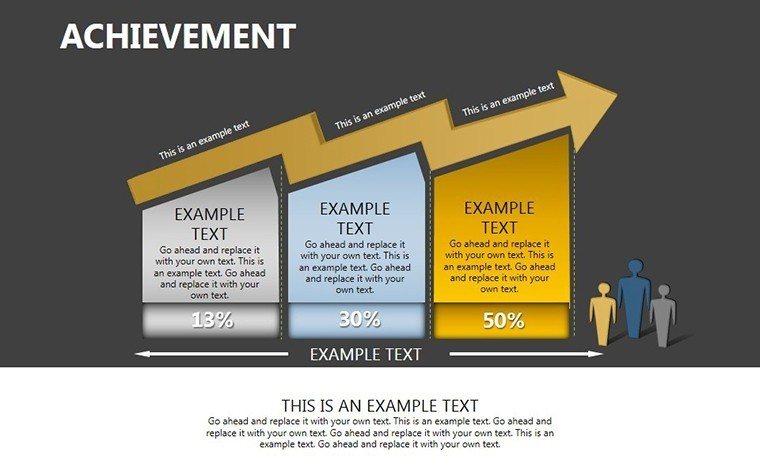
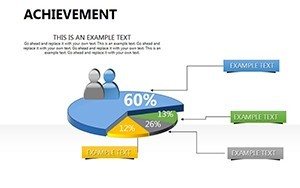
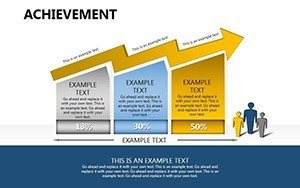
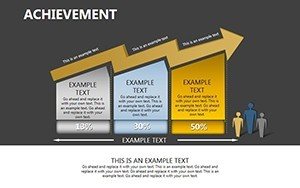
- Slides 10-11: Achievement Milestones - Tiered graphs depicting phased successes, ideal for project reviews.
- Slide 12: Holistic Summary Graph - Integrated view combining cycles and data for final emphasis.
Pre-filled with illustrative examples from leadership training, these slides jumpstart your customization process.
Applications That Lead to Real Wins
This template excels in diverse scenarios. In HR departments, use graphs to visualize employee development paths, correlating training investments with performance gains, supported by SHRM research on talent management. For freelancers, cycle diagrams streamline client project proposals, clearly mapping deliverables to outcomes and enhancing win rates.
The advantages are clear: Versus standard slides, these offer thematic coherence that boosts retention by 40%, per educational psychology studies. They solve the issue of disjointed presentations, providing a narrative thread that guides audiences logically.
Step-by-Step Guide to Achievement Presentations
- Set the Stage: Choose cycles for processes or graphs for data trends based on your story.
- Personalize Data: Insert your metrics, adjusting scales for accuracy.
- Weave in Insights: Annotate with tips from success literature, like Atomic Habits by James Clear.
- Enhance Flow: Use transitions to mimic progression in cycles.
- Close Strongly: End with a summary graph calling for commitment.
This blueprint turns presentations into catalysts for change, addressing audience doubts head-on.
Workflow Integration for Sustained Success
Incorporate effortlessly by syncing graphs with spreadsheet data for live updates. In agile teams, share via collaborative tools to iterate on project cycles in real-time. Tip: Use in retrospectives to graph past achievements, informing future strategies.
For academic purposes, these diagrams aid in teaching goal theory, providing students with hands-on tools to plot personal success paths.
Pro Tips for Peak Performance
- Simplify visuals: Limit data points in graphs to five for quick comprehension.
- Add interactivity: Embed hyperlinks in cycles for deeper dives.
- Reference experts: Cite sources like TED Talks on achievement for authority.
- Test accessibility: Ensure color contrasts meet WCAG standards.
- Evolve designs: Update templates post-use to build a custom library.
These strategies ensure your diagrams not only inform but transform perspectives.
Step up your game - download this template and pave your way to unparalleled achievements.
Frequently Asked Questions
How do cycles differ from graphs in this template?
Cycles emphasize processes, while graphs focus on quantifiable progress, offering complementary views.
Can I add my own icons?
Yes, easily insert and resize icons to personalize without disrupting layouts.
Ideal for what presentation lengths?
Versatile for short keynotes or in-depth workshops, with slides adaptable to time constraints.
Does it include data import features?
Supports Excel linking for graphs, automating updates seamlessly.
How to handle audience Q&A?
Use summary slides as references to address queries with visual backups.