Table Descriptions PowerPoint Template: Craft Compelling Data Narratives


Type: PowerPoint Diagrams template
Category: Tables, Illustrations
Sources Available: .pptx
Product ID: PD00183
Template incl.: 13 editable slides
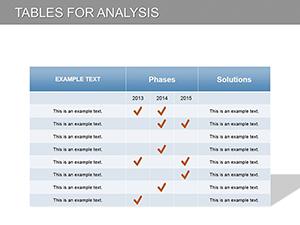
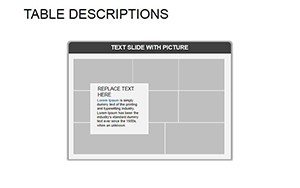
Ever stared at a blank PowerPoint slide, wondering how to turn raw data into a story that captivates rather than confuses? Enter the Table Descriptions PowerPoint Template - a 13-slide essential for professionals who need to present staff profiles, project metrics, or questionnaire results with elegance and ease. Tailored for business leaders, HR specialists, and analysts, this template transforms mundane tables into visual symphonies, ensuring your audience grasps insights at a glance.
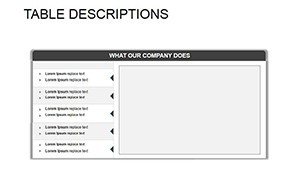
In today's data-saturated boardrooms, where decisions hinge on quick comprehension, effective table design isn't optional - it's your edge. This template leverages PowerPoint's robust formatting tools to create structured, scannable layouts that highlight key descriptors without overwhelming the viewer. Whether outlining team roles in a company overview or detailing survey responses in a market report, these slides make complex information approachable, fostering trust and driving action.
Why commit to this? Beyond its 13 fully editable slides, it embodies efficiency: Pre-built styles for headers, rows, and footers mean you spend less time formatting and more on analysis. Compatible with PowerPoint 2016 and newer (including Microsoft 365), it supports theme integration for brand-aligned decks. And for those hybrid meetings, embed hyperlinks in cells for drill-down details, turning static tables into interactive hubs.
Envision a HR pitch for a new hire initiative. Slide 1's overview table summarizes department headcounts with color-coded status bars - green for fully staffed, amber for gaps - prompting immediate discussion. Move to Slide 4's skill matrix, where conditional formatting (via simple fill rules) auto-highlights top performers, making talent gaps pop without manual tweaks.
Unlocking the Power of Structured Tables
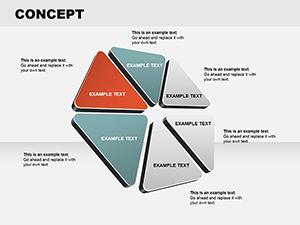
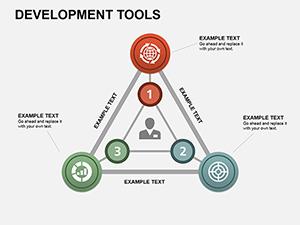
This template's core strength? Its versatility in describing entities - be it people, processes, or products. Each slide variant caters to specific needs: simple two-column comparisons, multi-row inventories, or nested hierarchies for organizational charts. Features include merged cells for spanning headers, banded rows for readability, and sortable icons that hint at data depth.
- Dynamic Formatting Tools: Built-in themes with alternating row colors and border options; adjust via the design tab for instant polish.
- Data Integration: Paste from Excel seamlessly - linked tables update live if sourced properly, keeping your deck evergreen.
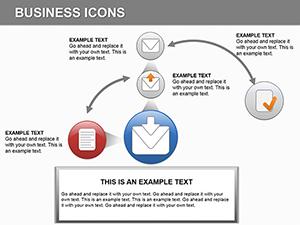
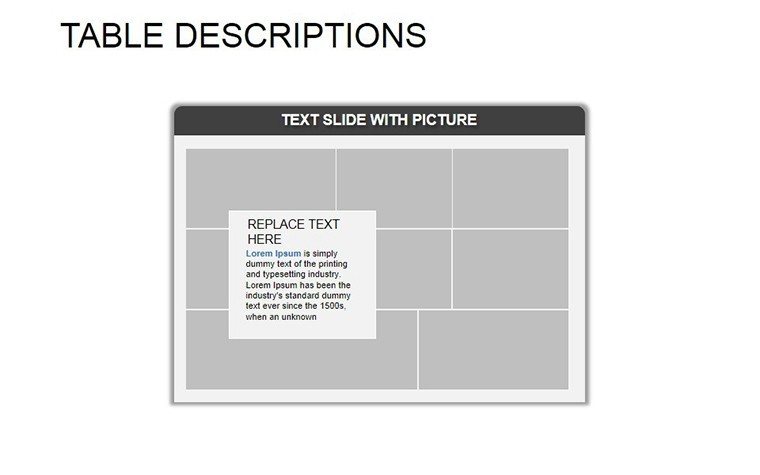
- Visual Enhancers: Integrated icons (from PowerPoint's library) next to cells for quick categorization, like user silhouettes for staff entries.
- Mobile-Optimized Views: Scaled layouts ensure clarity on shared screens or projected displays.
Real impact shines in practice. A mid-sized consulting firm, DataBridge Partners, adopted this for client staffing reports. By using Slide 7's timeline-integrated table to track project allocations, they reduced revision cycles by 40%, as stakeholders could self-serve insights. The secret? Descriptive headers that framed data contextually, turning numbers into narratives.
Detailed Slide Exploration: Tailored for Every Scenario
Let's unpack the 13 slides, each a building block for your story:
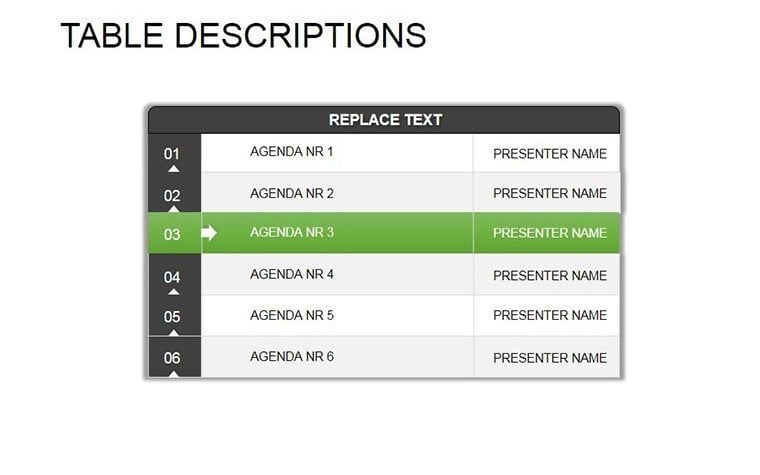
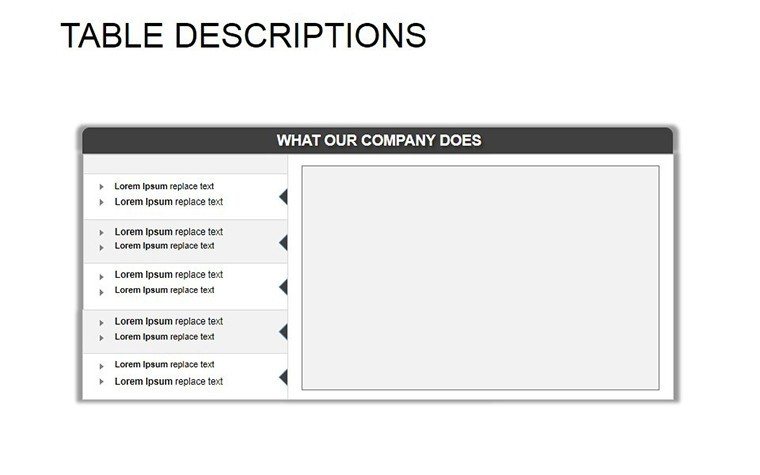
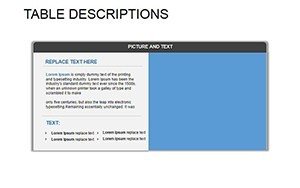
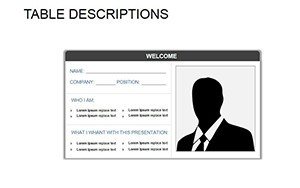
- Slide 1: Basic Profile Table – Single-page staff summary with photo placeholders, roles, and bios. Ideal for intros; add hyperlinks to LinkedIn.
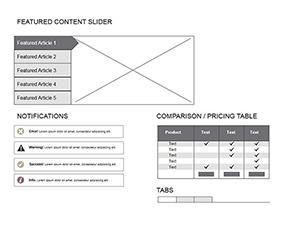
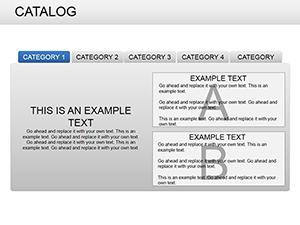
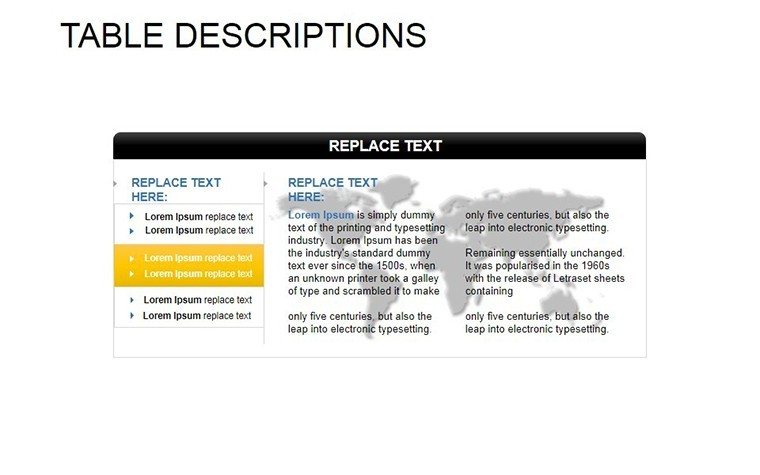
- Slide 2: Comparative Descriptions – Side-by-side columns for before/after metrics, perfect for performance reviews.
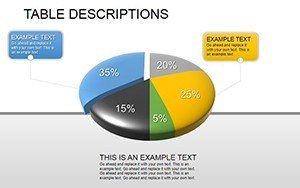
- Slide 3: Questionnaire Breakdown – Row-per-question format with pie-chart embeds for response distributions.
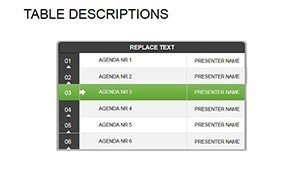
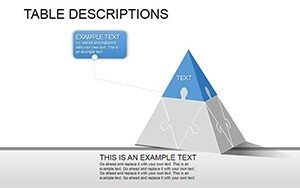
- Slide 4: Hierarchical Org Table – Nested rows showing reporting lines; collapse/expand for depth control.
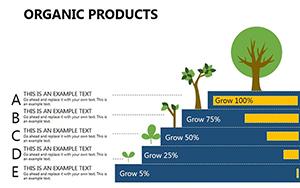
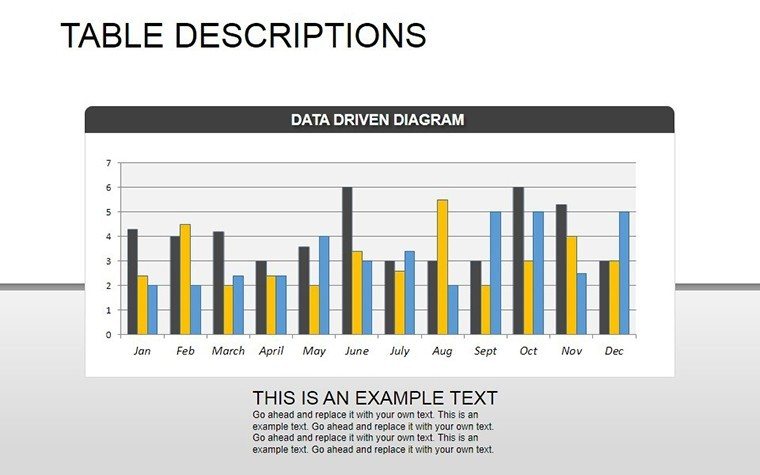
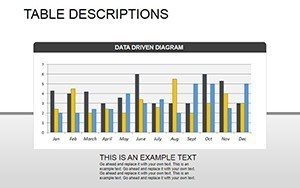
- Slide 5: Metrics Dashboard – KPI-focused with sparklines in cells for trend spotting.
- Slide 6: Inventory List – Numbered rows for asset tracking, with checkbox columns for status.
- Slide 7: Timeline Descriptions – Gantt-style table merging dates and descriptors for project timelines.
- Slide 8: Budget Allocation – Percentage-based rows with progress bars for financial overviews.
- Slide 9: Feedback Summary – Aggregated ratings table with average calculations via formulas.
- Slide 10: Vendor Comparison – Multi-criteria grid scoring suppliers on key factors.
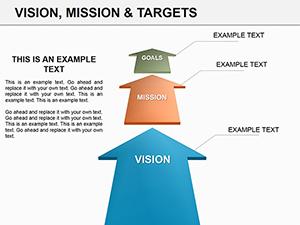
- Slide 11: Goal Tracking – Milestone tables with achievement icons.
- Slide 12: Risk Assessment – Probability-impact matrix in tabular form.
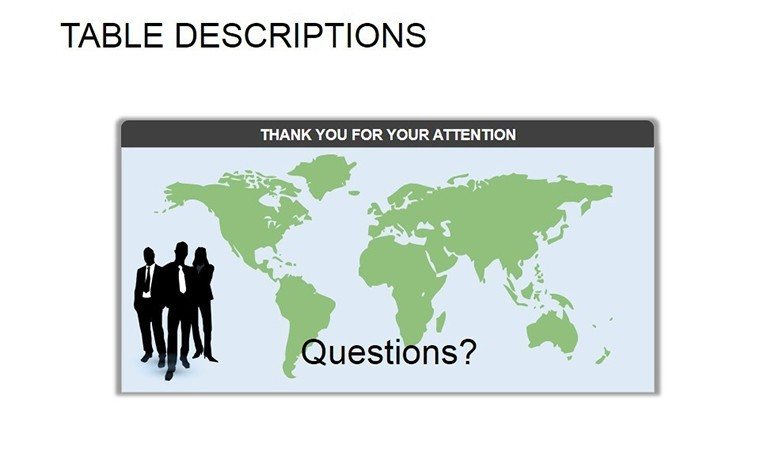
- Slide 13: Summary Wrap-Up – Consolidated key takeaways table, priming for Q&A.
Workflow-wise, start by populating a master Excel sheet, then copy-paste special to preserve formulas. For flair, apply subtle animations - fade in rows sequentially to build revelation. In team settings, use PowerPoint's co-authoring for simultaneous edits, ensuring alignment before showtime.
Use Cases That Drive Results
From corporate onboarding decks to investor updates, this template adapts fluidly. In education, professors use it for grading rubrics, making feedback transparent. Sales teams craft territory descriptions, mapping reps to regions with quota trackers. Even in non-profits, volunteer rosters gain structure, boosting coordination.
Consider a tech startup's growth story: Using Slide 10's comparison table, they juxtaposed competitor features against their own, securing seed funding by quantifying differentiation. It's these targeted applications that amplify value, proving tables aren't just tools - they're communicators.
Expert Tips to Elevate Your Tables
- Limit columns to 5-7 for scannability; use abbreviations with legends.
- Incorporate accessibility: Alt text for tables and high-contrast colors.
- Test on varied devices - zoom levels can warp perceptions.
As data volumes swell, the need for intuitive presentation grows. This Table Descriptions PowerPoint Template doesn't just organize info; it illuminates paths forward. Analysts and presenters, reclaim your slide time and amplify your message.
Download today and table up your success - with exclusive savings via 00LAYOUTS, your next report is primed for praise. Transform data into dialogue; get started now.
Frequently Asked Questions
Can I link tables to live Excel data?
Yes, use PowerPoint's linked object feature for automatic updates when the source changes.
Are the slides resizable for widescreen formats?
Absolutely - master slides support 16:9 and 4:3 ratios; adjust via slide setup.
How customizable are the icons and colors?
Fully - swap from PowerPoint's icon library or upload customs, with theme colors for consistency.
Does it work with Google Slides?
Export as .pptx and import; most features translate, though animations may need retouching.
What's included for staff photo integration?
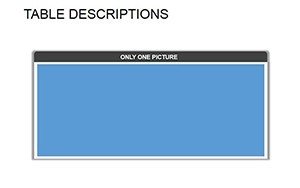
Circular crop placeholders ready for drag-and-drop; auto-aligns to rows.
Can I add formulas for calculations?
Yes, insert via table tools - sums, averages, and more for dynamic summaries.