14 Finance Icons Diagrams - Editable PPTX


Type: PowerPoint Diagrams template
Category: Analysis
Sources Available: .pptx
Product ID: PD00133
Template incl.: 14 editable slides
14 Diagrams, 1 Format: What You Get
14 editable slides arrive in one .pptx file.
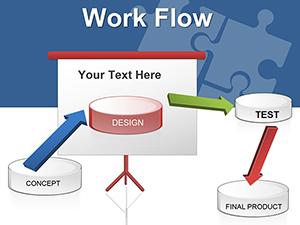
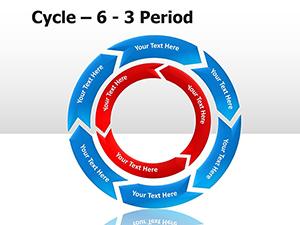
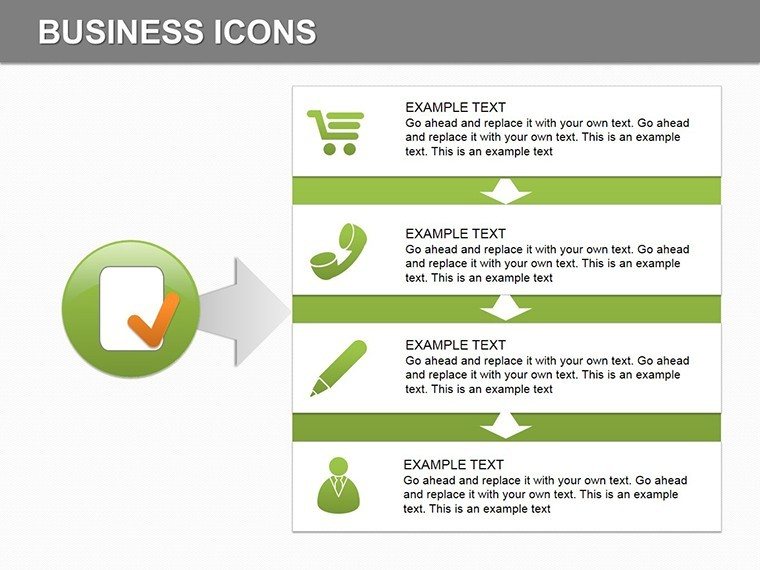
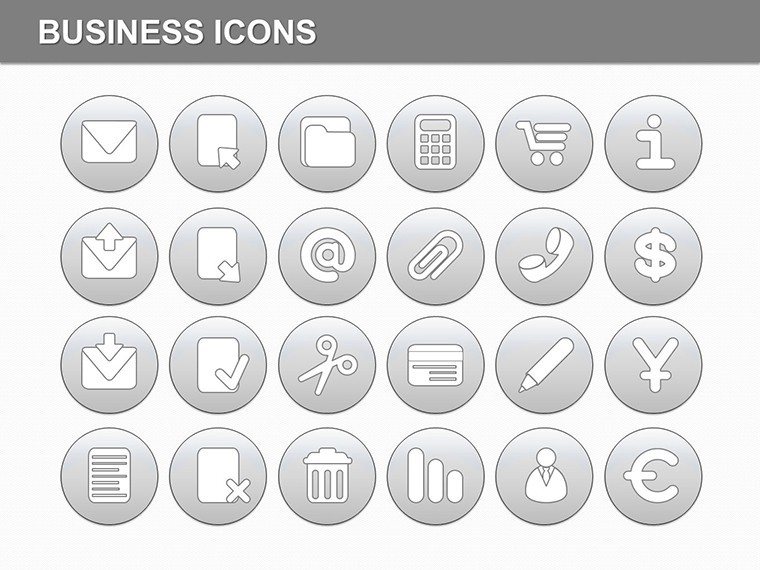
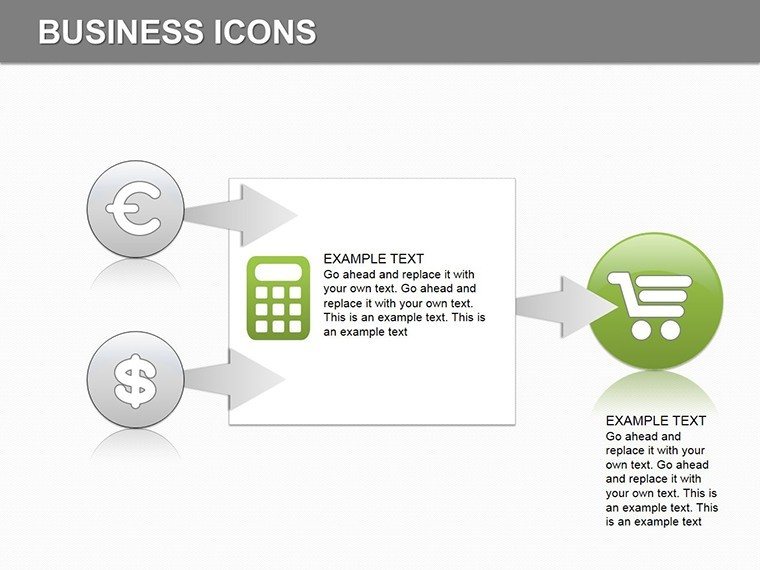
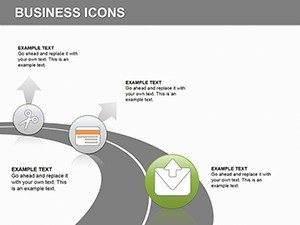
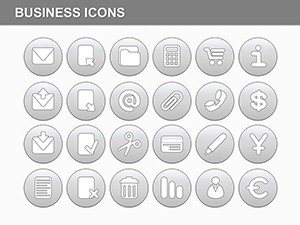
Finance icons combine with layout composition to support information spacing and flow direction across analysis presentations.
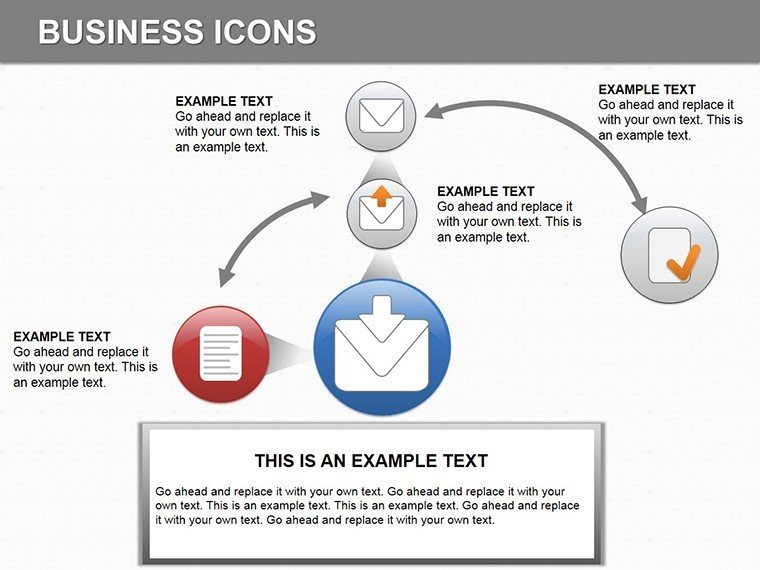
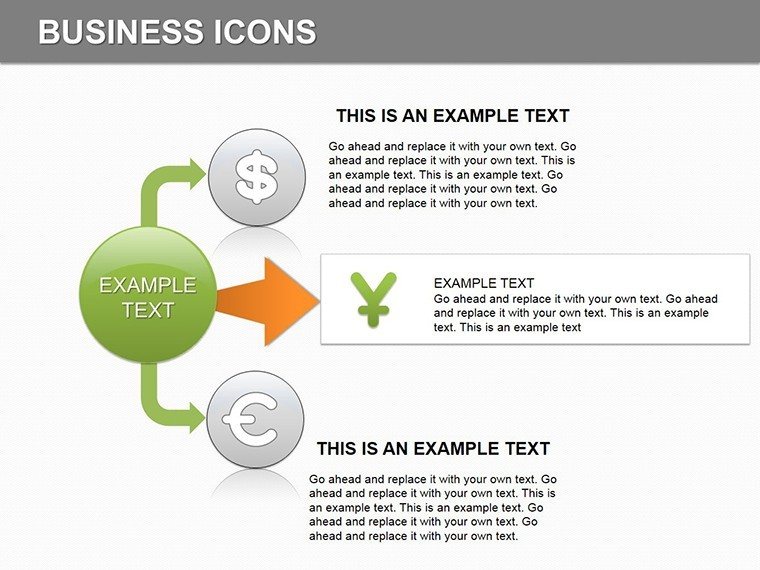
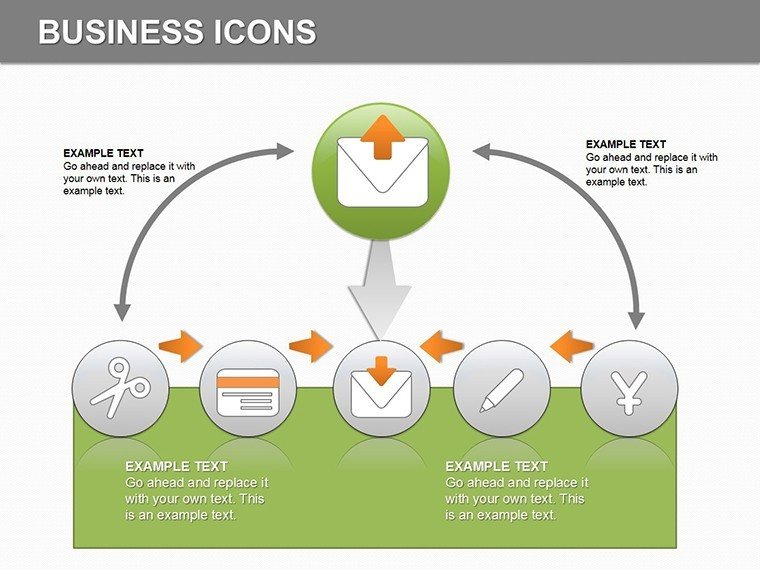
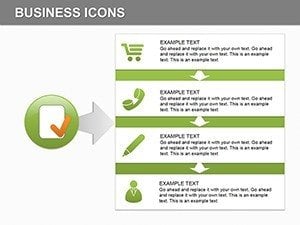
Compared to general workflow-focused sets, this pack employs finance-specific icons that highlight metrics through color contrast and zone segmentation for investor decks.
Editing Capabilities at a Glance
| Feature | Details |
|---|---|
| Slides included | 14 finance icon diagrams |
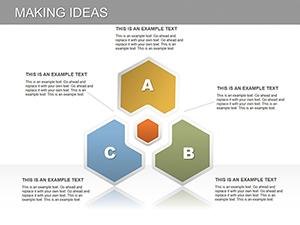
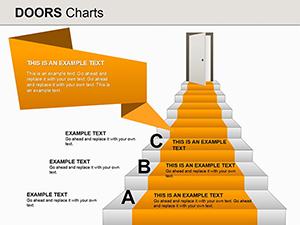
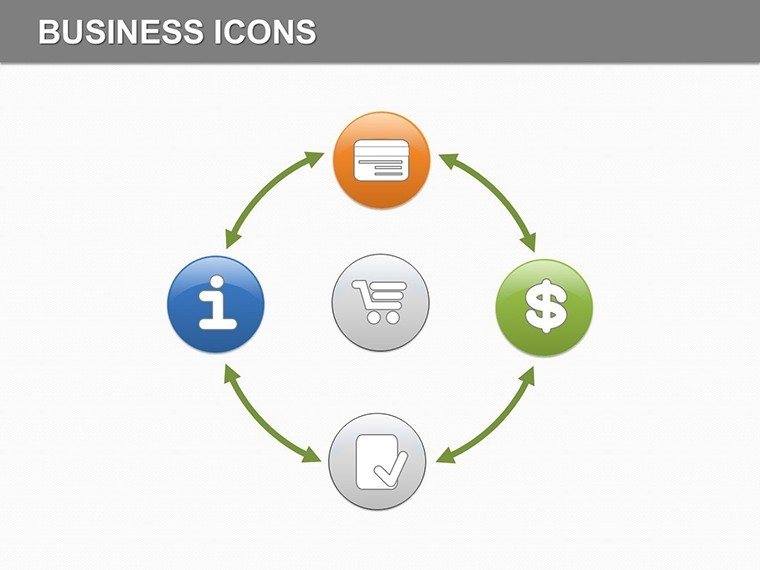
| Diagram categories | icon-based financial visuals with independent layers |
| Editable elements | shapes resize and recolor independently, icon layers replaceable |
| Text placeholders | labels update without unlocking grouped elements |
| Color theme adjustments | compatible with PowerPoint slide master palette |
| PowerPoint compatibility | 2016, 2019, 365 versions |
Typical Use Cases by Role
Financial analysts rely on these in investor presentations.
Financial Analyst in Banking
One analyst cut deck preparation from 3 hours to 45 minutes by swapping color schemes across the slides.
Consultant in Finance Firm
Consultants reused the same file across three client reports by adjusting icon layers.
Download the finance icons diagrams now
How to Make It Yours in Under 20 Minutes
Moderate editing difficulty.
1. Open the .pptx file in PowerPoint (1 minute)
2. Replace placeholder text with your content (3 minutes)
3. Adjust brand colors via the slide master (2 minutes)
4. Edit diagram labels and connectors (4 minutes)
5. Export as PPTX or PDF (1 minute)
Building From Scratch vs. Starting Here
Manual replication of 14 finance icon diagrams requires 4 hours and moderate skill.
Starting here avoids errors in information spacing during projection.
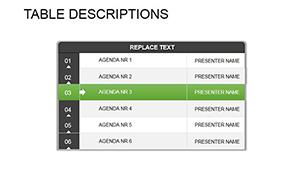
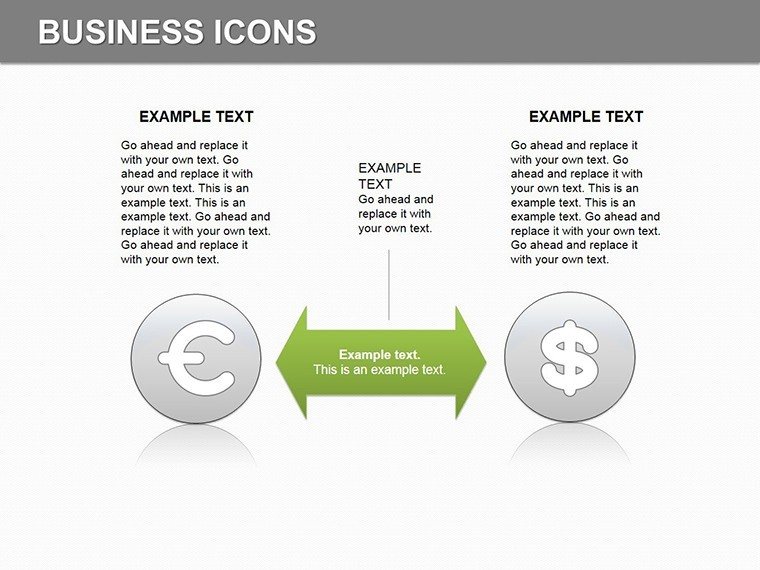
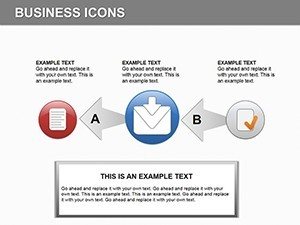
Many presentations place labels inside shapes. That approach works on a laptop screen but becomes harder to read on a projection screen. This layout places labels outside the shapes connected by thin lines - maintaining readability during live meetings without adding editing complexity.
Get the editable PPTX today
Which PowerPoint versions support these diagrams?
The diagrams open correctly in PowerPoint 2016, 2019, and Microsoft 365 on Windows and Mac. Open the file and inspect the slide master for any version notes. Earlier versions may require minor shape adjustments. Test thoroughly before a board briefing.
How do I change the color scheme?
Go to View then Slide Master. Select the theme colors and update to match your brand palette. Changes apply automatically to all editable shapes and icons. Save the file to lock the new scheme for future use.
What does the license allow?
The license covers internal company presentations and paid client work. Resale or sublicensing of the file is prohibited. Client proposals may include the diagrams as long as the template is not redistributed. Contact support for any specific usage questions.
Is there a free version and how does it differ?
The page does not list a free version. The paid purchase delivers the full 14 editable slides. No limitations on diagram types or layouts apply after payment. Download immediately to access everything.
What file formats are provided?
Only .pptx is supplied and opens directly in PowerPoint. Export to PDF for distribution or JPG for images remains possible. Full editability stays intact in compatible software. No additional formats appear on the page.