Timeline PowerPoint Template - 11 Fully Editable Slides | Instant Download | ImagineLayout


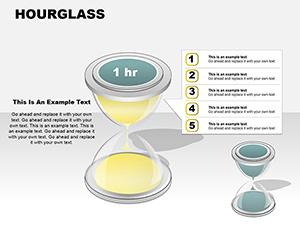
Build professional chronological presentations with this tube timeline PowerPoint template featuring 11 editable slides, 3D-like tube structures, color-coded gradients, and table integrations. Perfect for project roadmaps, sales forecasts, and event timelines. Instant .pptx download for PowerPoint 2010+.
What's Included
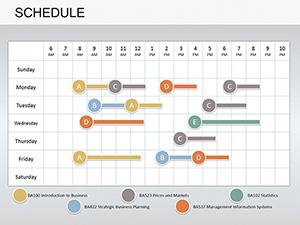
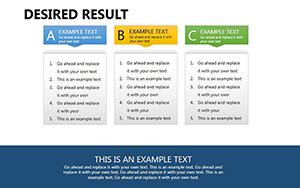
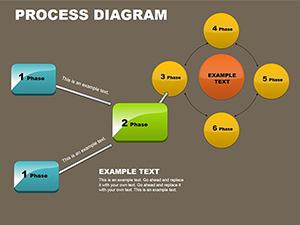
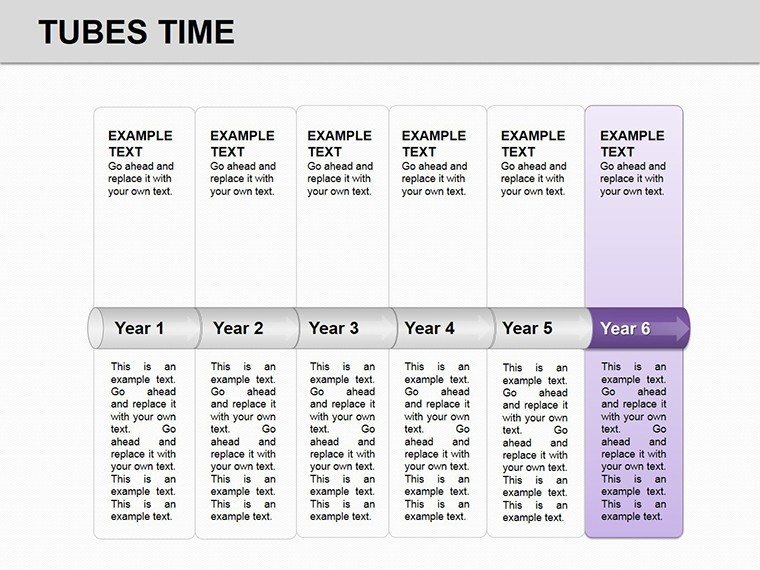
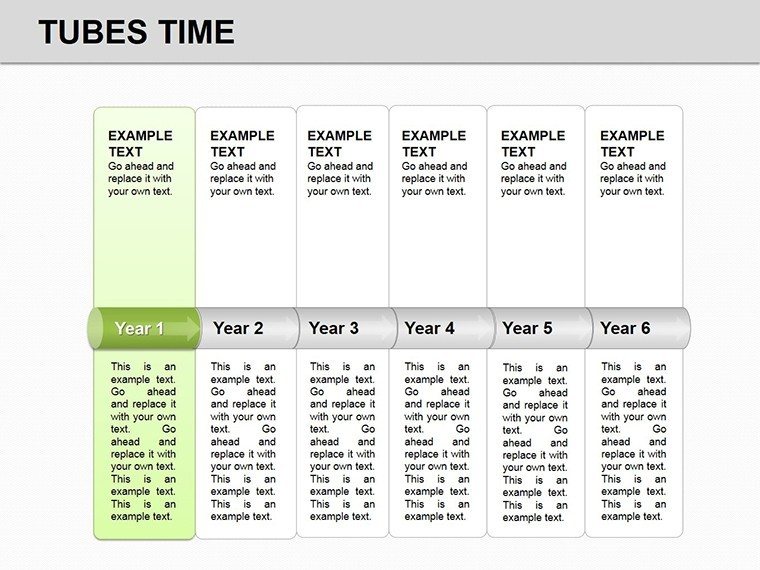
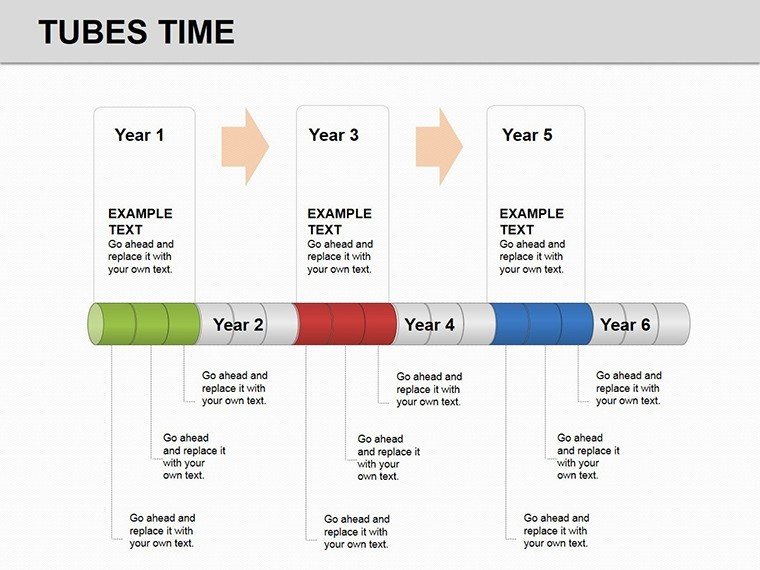
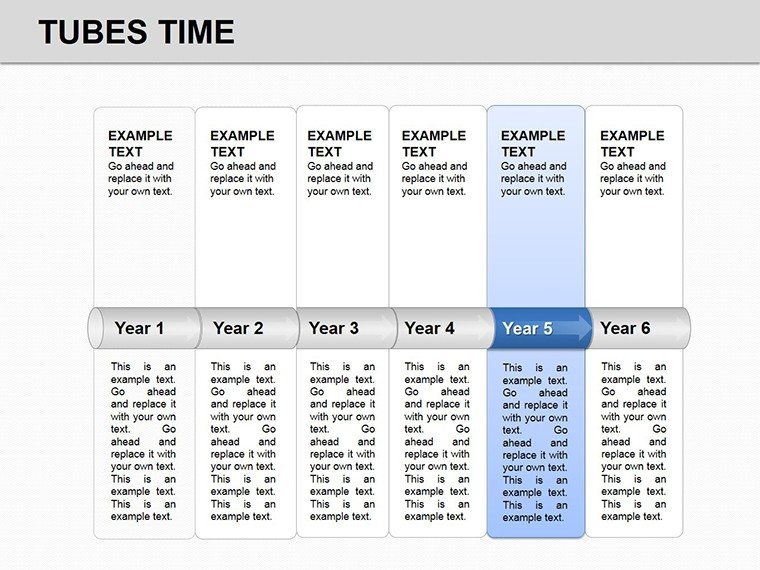
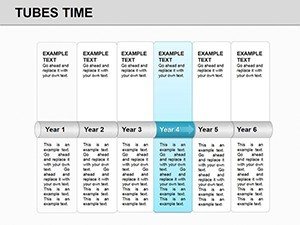
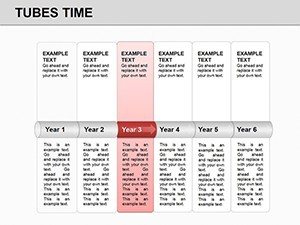
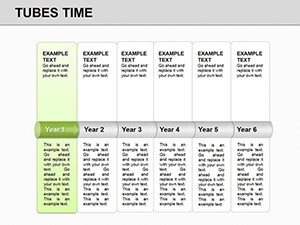
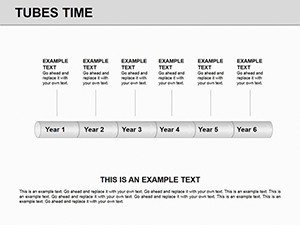
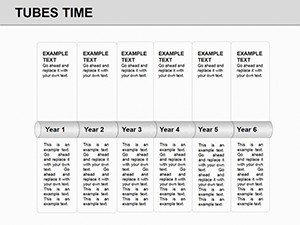
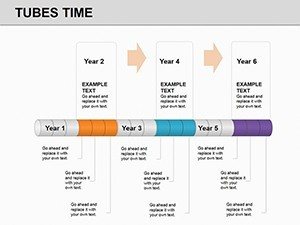
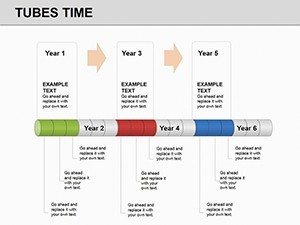
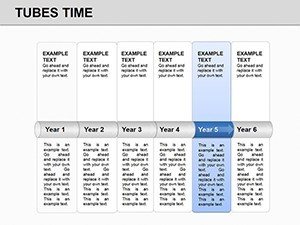
This PowerPoint diagram template delivers exactly 11 editable slides built around tube-like structures that represent time flows. Horizontal layouts map sequential events across years or quarters while vertical layouts organize hierarchical milestones. Modular tube segments let you divide, recolor, and resize individual periods with native PowerPoint tools. Several slides include integrated data tables for direct year-over-year or phase comparisons. Future projection slides use dashed tube extensions to illustrate forecasts. All graphics are high-quality vectors that scale without pixelation. The .pptx file opens directly in PowerPoint 2010 and newer. Product ID PD00148 and current price is $20.00. This set gives you complete chronological visualization resources in one download.
Key Features
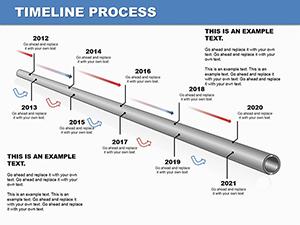
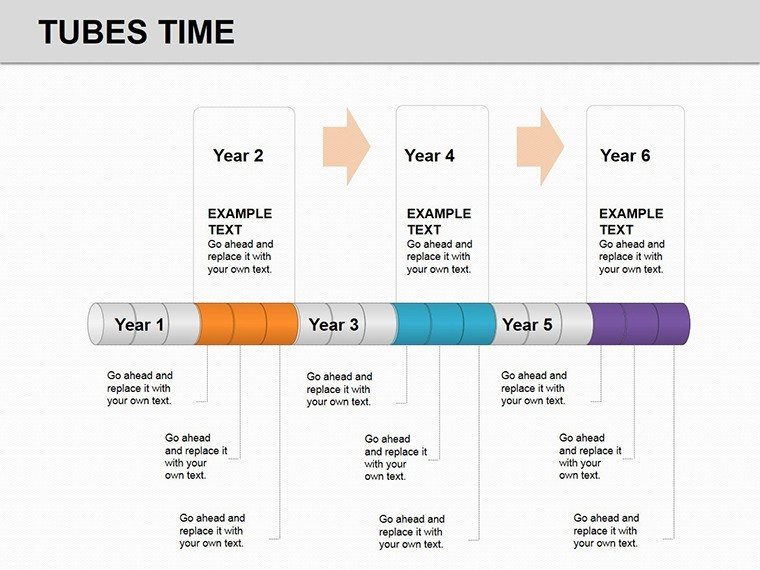
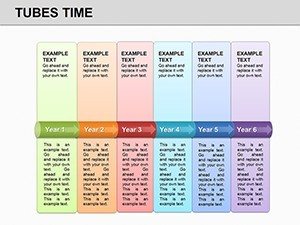
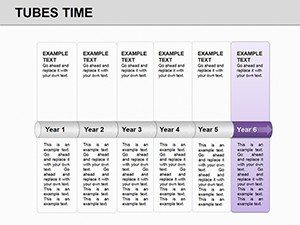
The 3D-like tube designs create visual depth that standard flat timelines lack, making complex time data easier to follow in boardrooms or virtual calls. Color-coded segments with built-in gradients differentiate phases instantly. Modular elements support animation builds for progressive reveals of each period. Table integration slides combine timelines with metrics without switching views. Vector quality ensures crisp printing or screen sharing at any zoom. The design choices prioritize clarity for audiences viewing on laptops or projectors.
| Feature | Benefit |
|---|---|
| 11 Editable Slides | Full range of timeline layouts |
| Tube Structures | 3D-like time flow metaphor |
| Color-Coded Gradients | Phase distinction |
| Table Integrations | Data comparison |
| Modular Segments | Divide by periods |
| Future Dashed Lines | Forecast visualization |
| PPTX Format | PowerPoint 2010+ |
Professional Use Cases
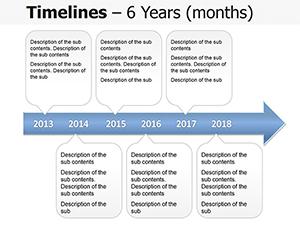
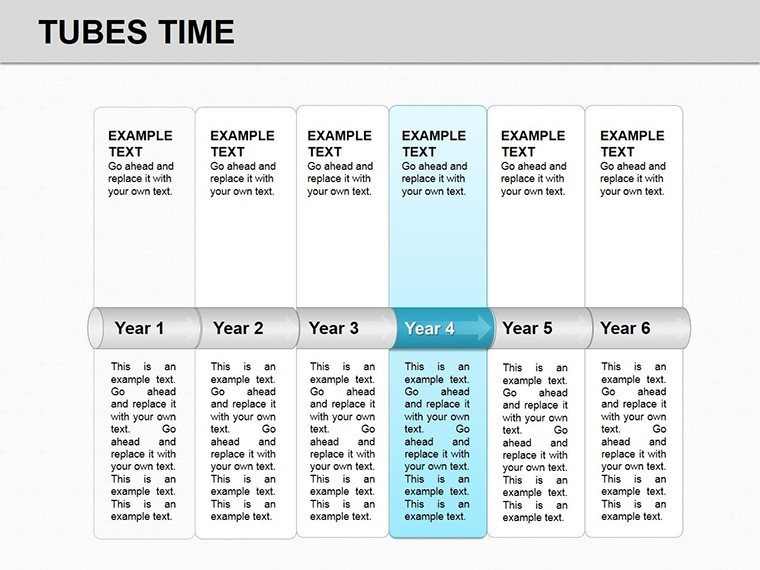
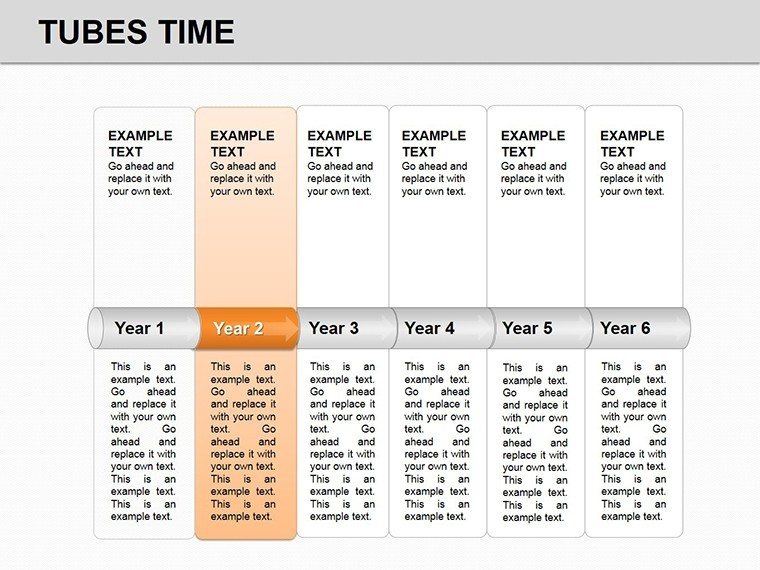
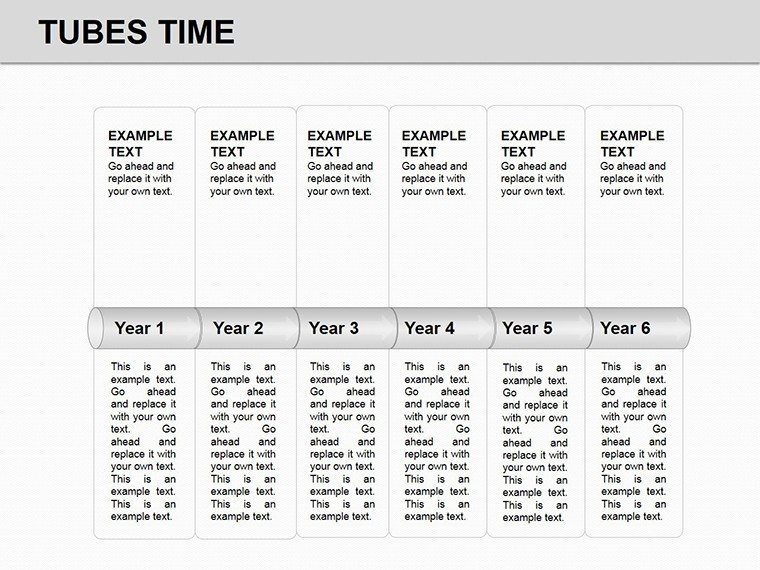
A project manager at a construction firm used slide 4's vertical tube layout to present a 24-month infrastructure rollout to executives, color-coding delay risks in red segments and using table integration to show budget alignment, securing immediate stakeholder approval and on-time funding release. A marketing analyst at a consumer goods company customized the horizontal tubes on slide 7 to map a six-quarter product launch campaign, adding icons to milestone segments, resulting in clearer cross-team alignment and 15% faster execution than previous text-heavy decks. An educator teaching modern history divided tube segments by decade on slide 2 to illustrate key geopolitical shifts, allowing students to follow cause-and-effect relationships visually during lectures.
How to Customize
Download the .pptx file and open in PowerPoint 2010 or newer. Select any tube segment, go to Shape Format to change fill color or gradient for your brand palette. Edit attached text placeholders with your dates and events using standard typing. To add a new period, duplicate an existing segment, resize, and align with the alignment tools. For table slides, replace sample data directly in cells. Apply built-in animations via the Animations tab to reveal tubes sequentially. Save and embed in your main deck or export as PDF for handouts. The entire customization process for all 11 slides typically takes under 45 minutes once your data is ready.
Why Choose This Template
Creating professional tube timelines from scratch requires hours of shape drawing, alignment, and gradient application that often results in inconsistent spacing. This template provides pre-designed modular tubes with proven visual hierarchy, saving design time while delivering cohesive 3D depth across all slides. The tube metaphor helps audiences intuitively grasp progression better than generic lines, and the included table integrations eliminate the need to build separate charts. Specific layout choices like gradient phases were made to maximize readability on both light and dark backgrounds. A logistics director compared using this versus building manually and reported cutting preparation time from 4 hours to 40 minutes with superior visual impact in the final board presentation.
Ready to map your next timeline with tube clarity?
Frequently Asked Questions
How do I edit the tube segments in this timeline PowerPoint template?
The tube structures are native PowerPoint shapes that you select individually to adjust length, color, or position. Click a segment, use the Shape Fill menu to apply your brand colors or gradients, and update the connected text boxes with specific milestones or dates. Duplicate segments to extend timelines and use the Align tools to maintain consistent spacing. This modular approach keeps all 11 slides visually consistent while allowing full personalization in minutes per slide. The design supports adding icons via Insert > Pictures without breaking the layout.
Which PowerPoint versions does this template support?
The .pptx file works perfectly in Microsoft PowerPoint 2010 and all newer desktop and online versions. Vector tubes and gradients render correctly without compatibility issues. Animations built into the segments function in standard and widescreen modes. You can open, edit, and present on Windows or Mac without additional plugins. For best results use version 2016 or later to access advanced gradient options, but 2010 users still achieve full functionality with the modular tube elements and table integrations.
Can I use this timeline template for commercial client projects?
Yes, purchase grants standard commercial use rights for client presentations, internal reports, and published materials. The 11 slides with tube designs can be adapted for paid consulting work or external reports. No attribution is required. You retain full ownership of customized versions. The template cannot be resold as-is or included in other template packs. This licensing supports business analysts, consultants, and agencies presenting project roadmaps to paying customers.
How does this differ from other timeline templates on the site?
This one uniquely uses 3D-like tube structures as a time-flow metaphor, unlike flat arrow or line versions in related products such as Project Timeline Planning or Schedule diagrams. The modular segments with gradients and table integrations are specific to these 11 slides, providing depth not found in standard 2D timelines. Future dashed extensions for forecasts add planning capability absent in many adjacent templates. The focus on chronological tube visualization differentiates it for users needing engaging, memorable time representations.
What is the download process and file format?
After purchase you receive an instant .pptx download link valid for 24 hours. The file is 100% self-contained with no external links or fonts required. Unzip if needed and open directly. The 11 slides load ready for editing without missing elements. Backups are available via account login. This immediate access lets you start customizing tube timelines for your next meeting within minutes of buying.