Dynamic Objectives Tree PowerPoint Diagrams: Elevate Your Presentations


Type: PowerPoint Diagrams template
Category: Organizational, Tree
Sources Available: .pptx
Product ID: PD00113
Template incl.: 38 editable slides
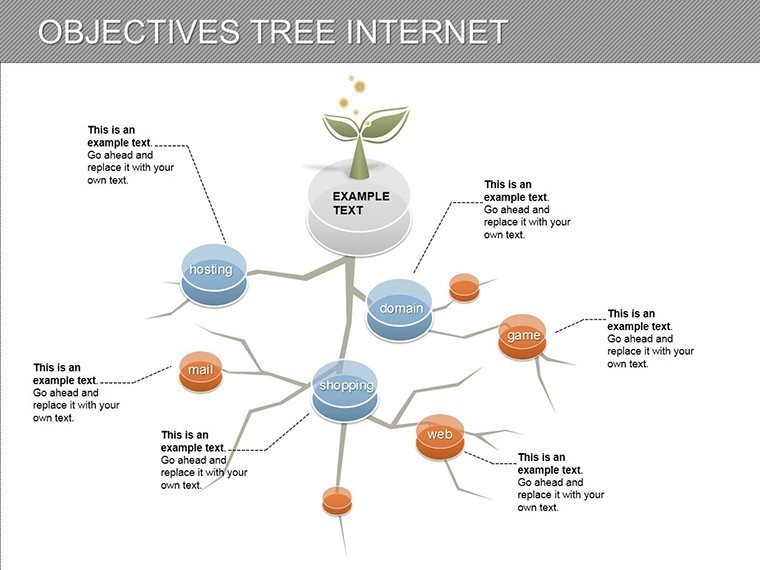
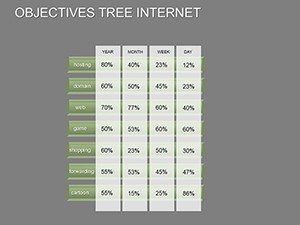
In today's fast-paced digital world, conveying complex ideas like organizational goals and internet connectivity requires visuals that are both clear and compelling. Our Objectives Tree Internet PowerPoint Diagrams template is designed precisely for that purpose. With 38 fully editable slides, this versatile tool empowers professionals across various fields to transform abstract concepts into structured, engaging narratives. Whether you're a business leader outlining strategic objectives, an educator breaking down hierarchical information, or a project manager mapping out processes, this template provides the foundation for presentations that resonate.
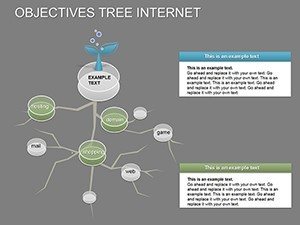
Imagine effortlessly illustrating how internet ecosystems interconnect with business goals - using tree diagrams that branch out to show dependencies, hierarchies, and flows. This isn't just about aesthetics; it's about enhancing understanding and driving action. Built with compatibility for PowerPoint, these diagrams ensure seamless integration into your workflow, saving you hours of design time while delivering polished results. From startups visualizing growth paths to corporations detailing network strategies, the applications are endless. Dive in and discover how this template can turn your next pitch into a memorable experience.
Key Features of Our Objectives Tree Diagrams
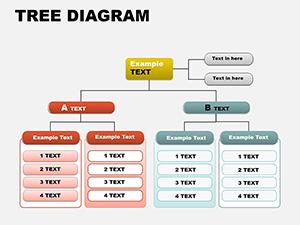
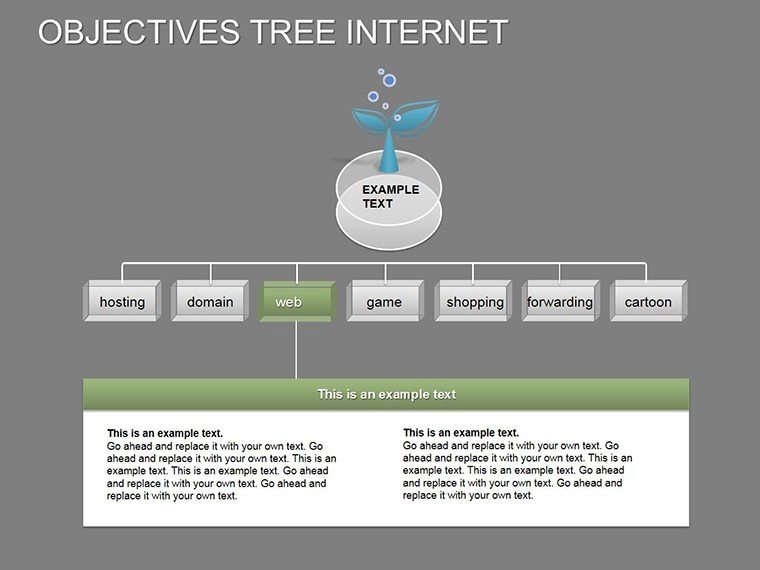
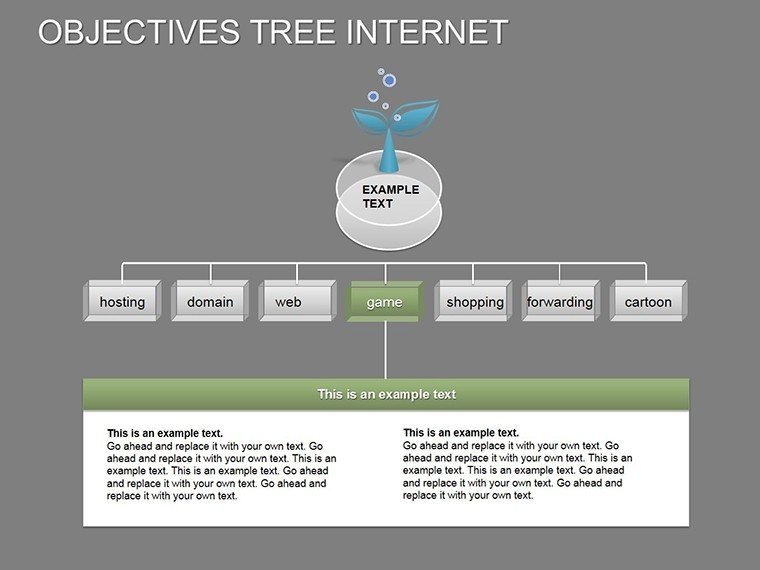
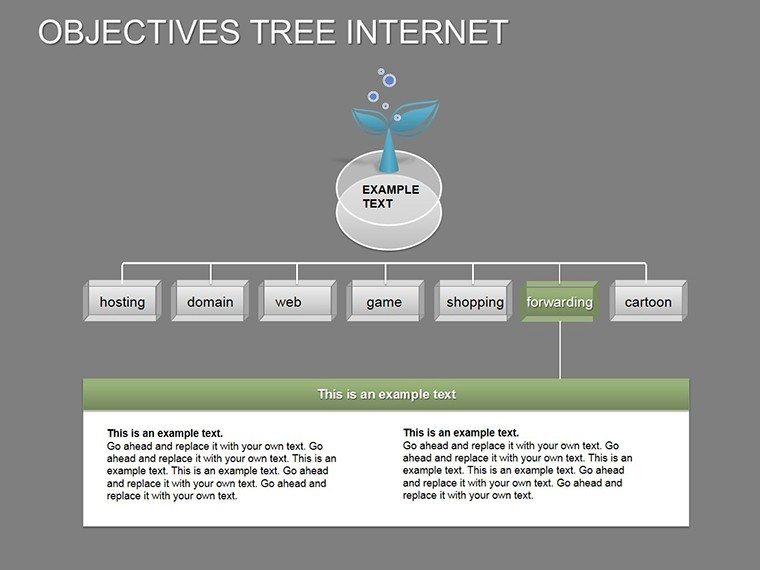
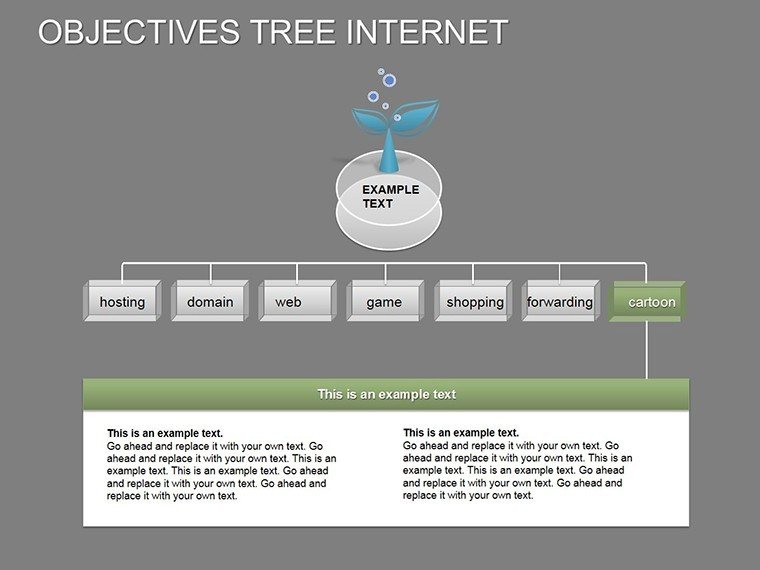
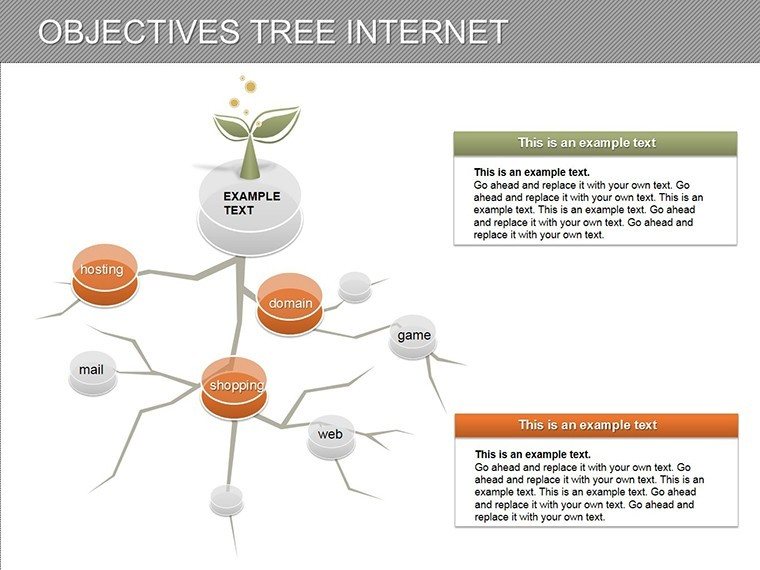
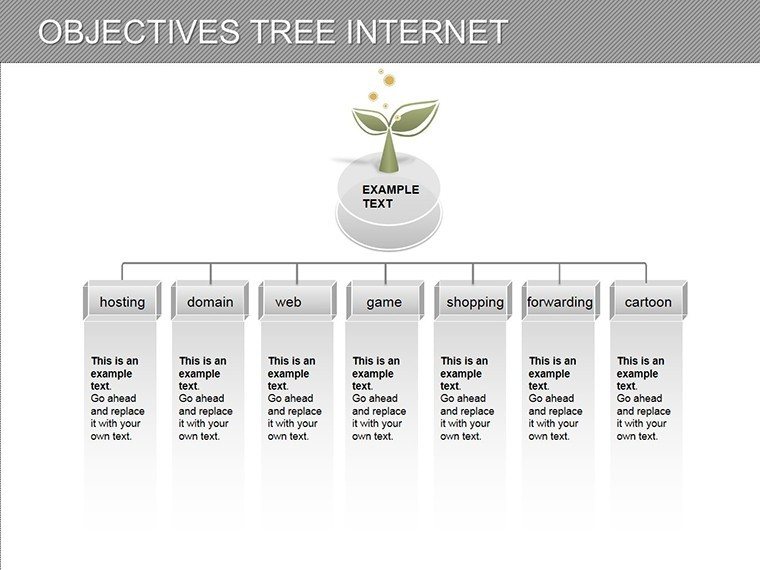
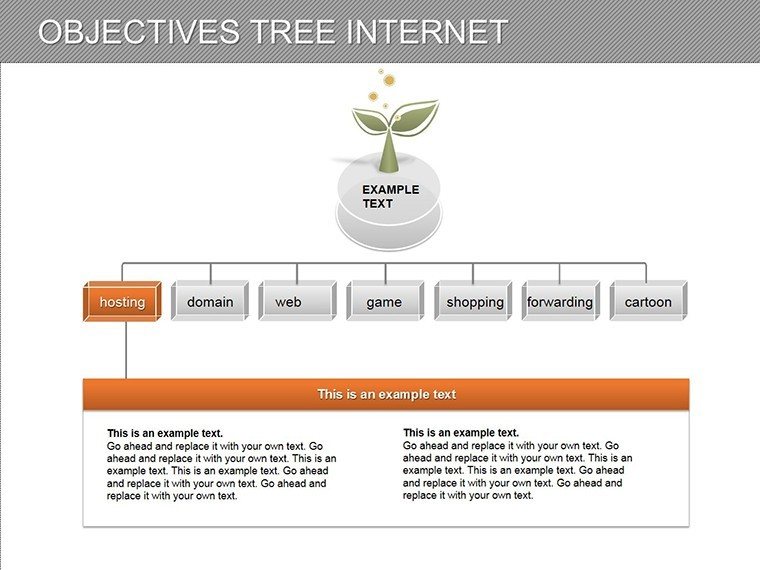
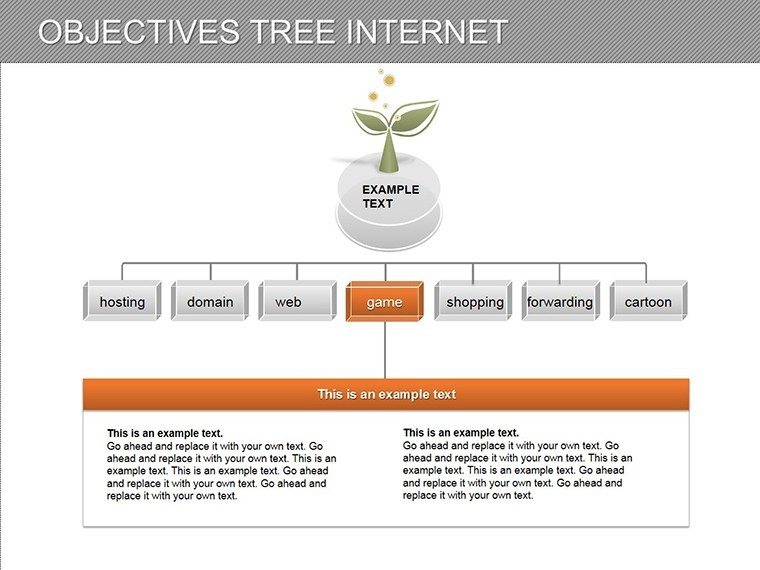
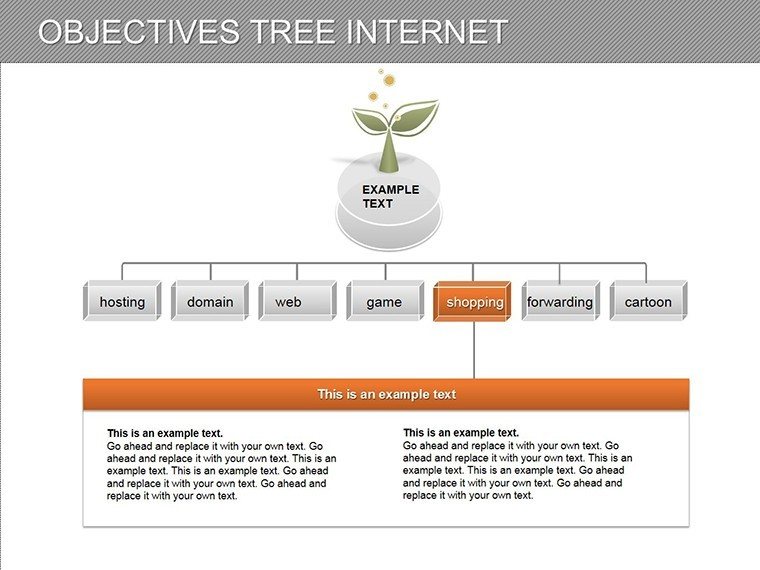
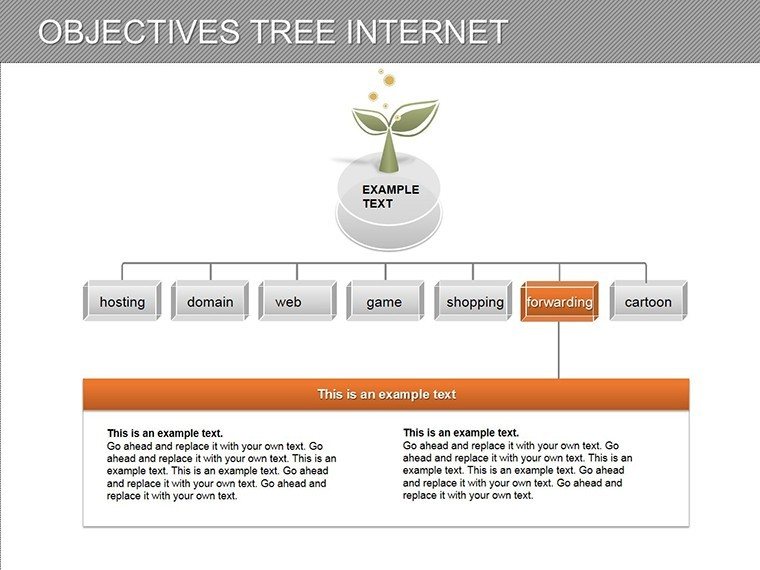
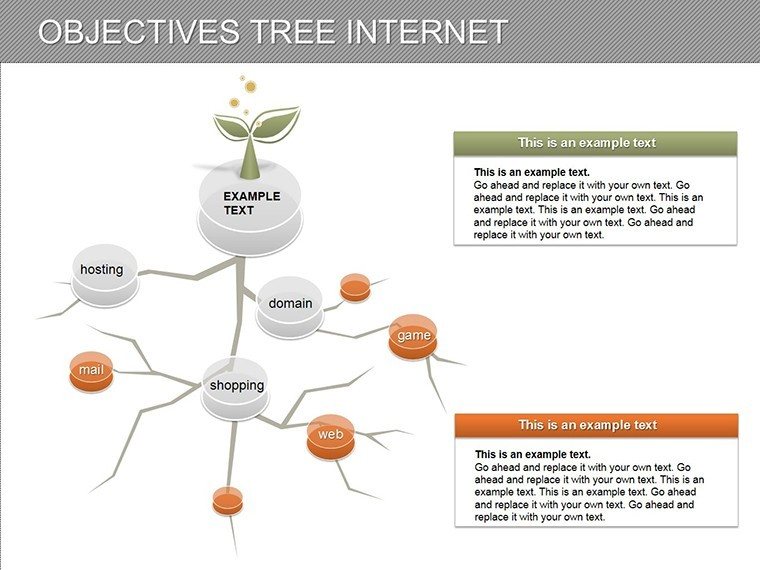
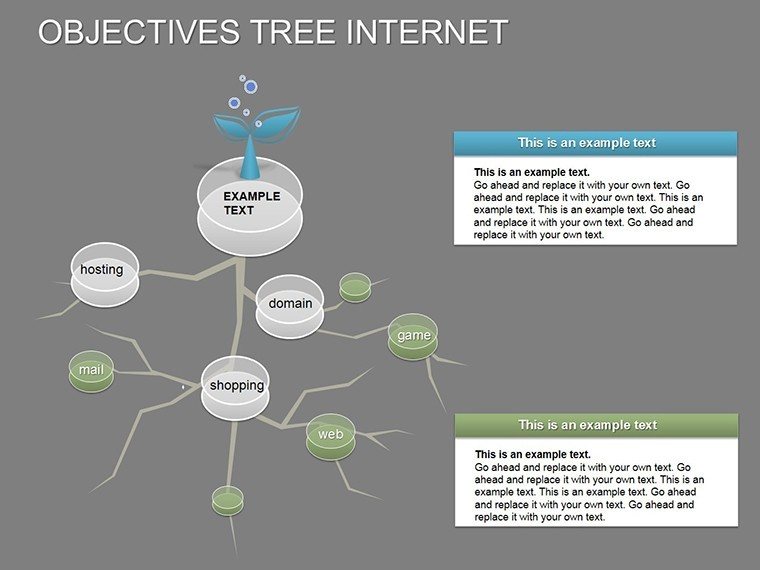
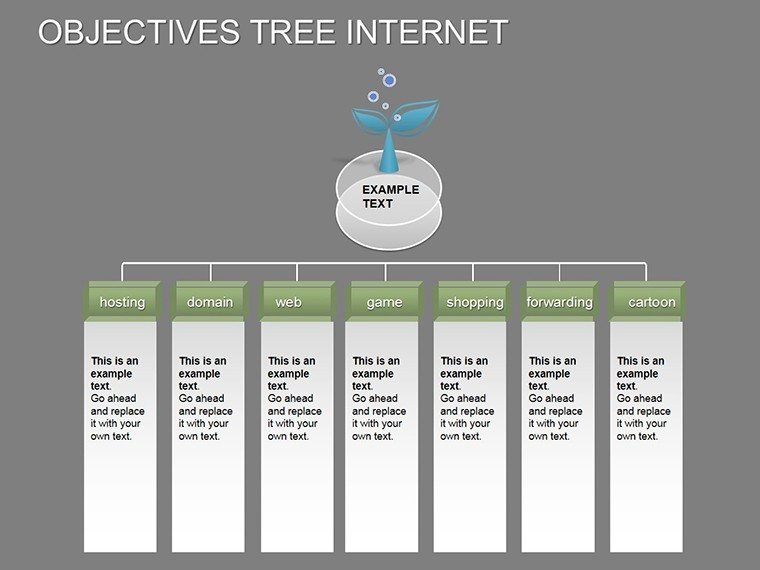
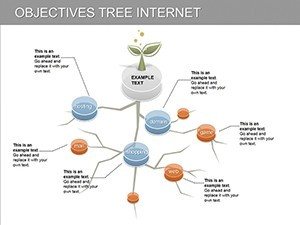
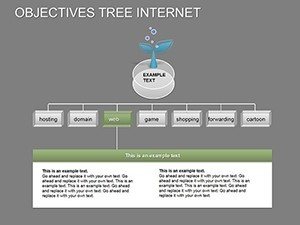
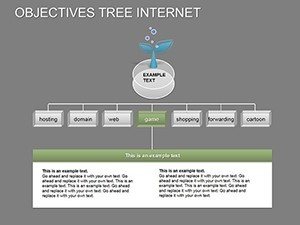
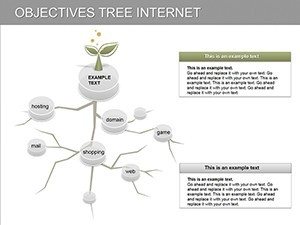
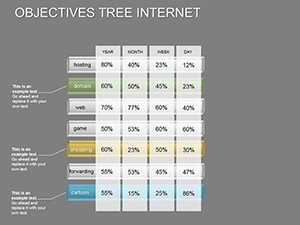
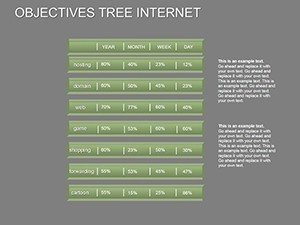
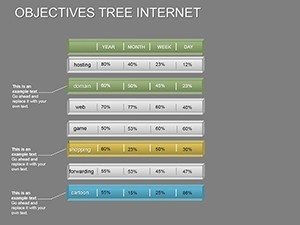
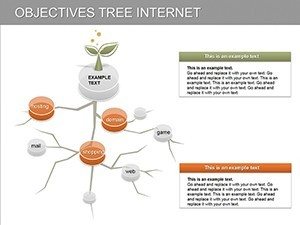
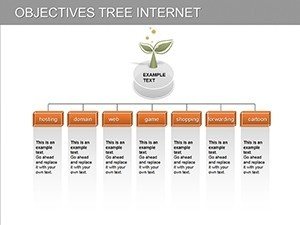
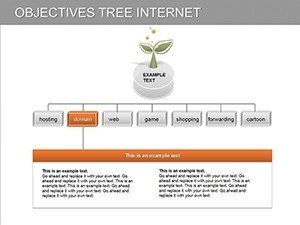
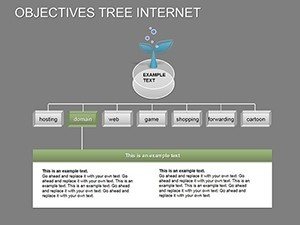
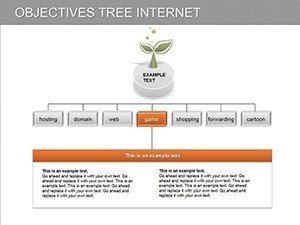
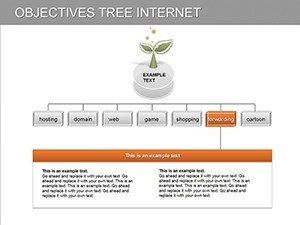
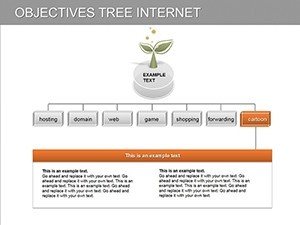
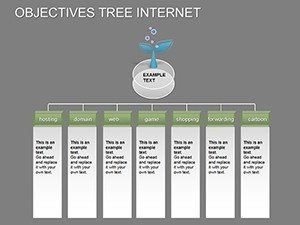
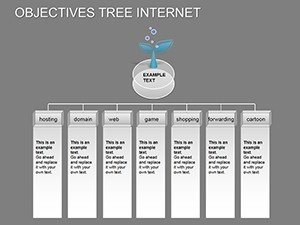
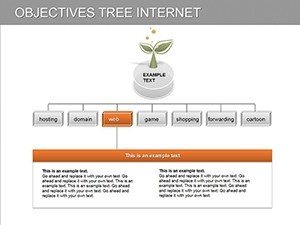
What makes this template stand out is its blend of functionality and flexibility. Each of the 38 slides is crafted with professional-grade design elements, ensuring your content looks credible and sophisticated. The core feature is the objectives tree structure, which allows you to depict multi-level goals with branching elements that represent sub-objectives, risks, or opportunities. Internet-themed icons and connectivity maps add a modern twist, perfect for tech-savvy presentations.
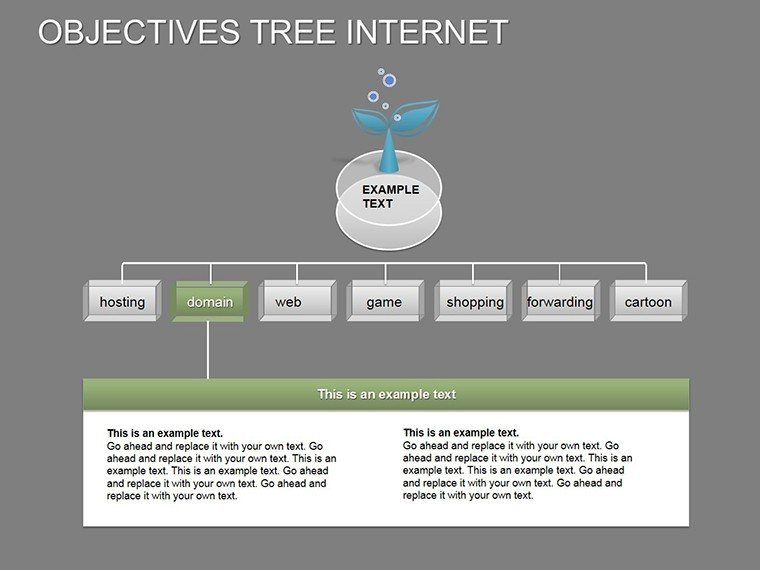
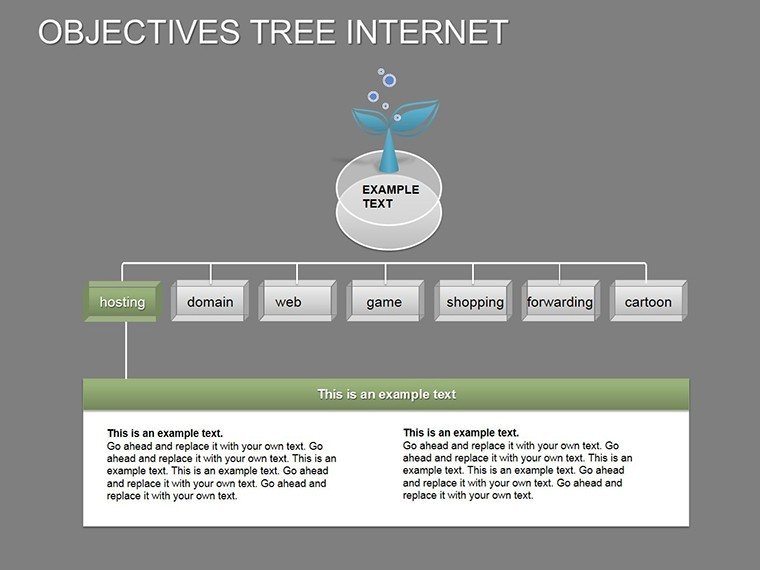
- Full Customization: Adjust colors, fonts, and layouts to match your brand identity. No design skills needed - simply drag and drop elements.
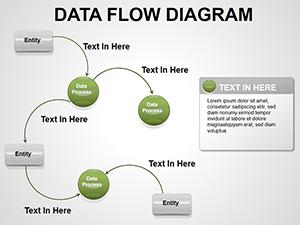
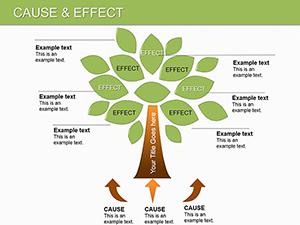
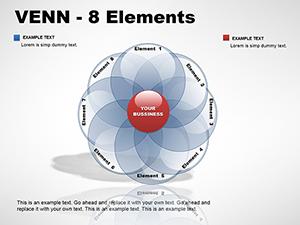
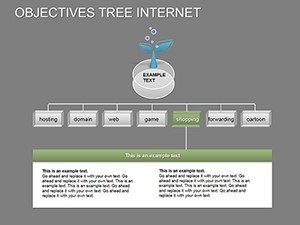
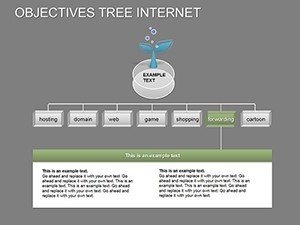
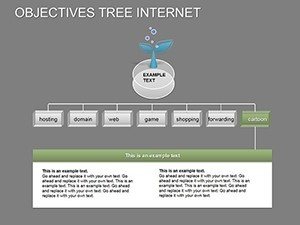
- Variety of Diagram Types: Includes hierarchical trees, flow charts, process maps, and infographics, all themed around objectives and internet integration.
- High-Resolution Graphics: Vector-based elements that scale perfectly without losing quality, ideal for large screens or printouts.
- Compatibility Assurance: Works flawlessly with Microsoft PowerPoint versions 2010 and later, including Office 365.
- Time-Saving Templates: Pre-built slides reduce creation time by up to 70%, allowing focus on content rather than design.
These features aren't generic; they're tailored to solve real pain points, like cluttered slides that confuse audiences. For instance, in a case study from a digital marketing firm (inspired by practices shared by experts at HubSpot), using similar tree diagrams helped clarify campaign objectives, resulting in a 25% increase in client approval rates.
Real-World Applications and Use Cases
This template shines in scenarios where structure meets creativity. Consider a tech startup pitching to investors: Use the objectives tree to map out product development goals, with branches showing internet integration points like API connections and user data flows. Educators can employ it to teach network topologies, breaking down complex internet architectures into digestible hierarchies.
- Business Strategy Sessions: Outline company objectives with trees that branch into actionable steps, incorporating internet metrics like web traffic goals.
- Educational Lectures: Visualize knowledge trees for subjects like computer science, where internet diagrams illustrate data transmission paths.
- Project Management: Create Gantt-like trees for timelines, highlighting dependencies in internet-based projects such as cloud migrations.
- Marketing Pitches: Demonstrate campaign structures, with roots in core objectives and branches extending to digital channels.
In a practical example, a non-profit organization adapted these diagrams to present their digital outreach strategy. By customizing the trees to show goal hierarchies - from broad awareness campaigns to specific online engagement metrics - they secured additional funding. This demonstrates the template's value in bridging ideas with impact, drawing from design principles advocated by visualization experts like Edward Tufte, who emphasize clarity in data representation.
Detailed Slide Breakdown
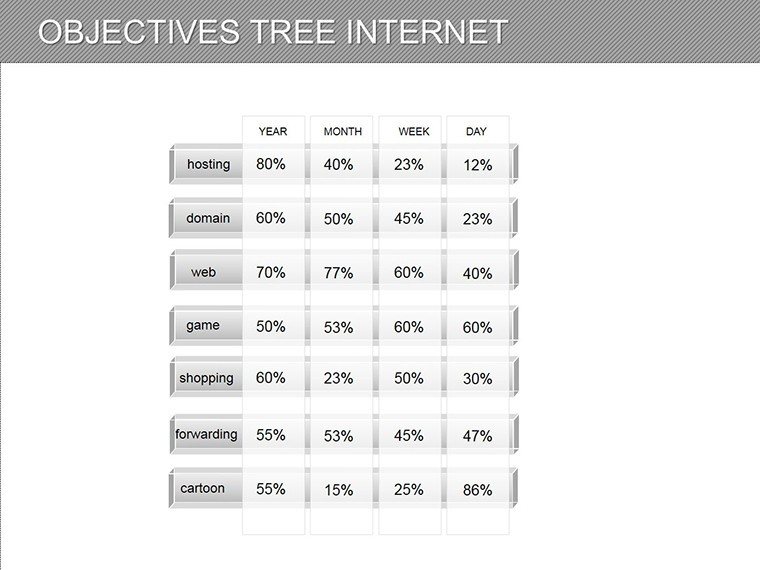
Let's explore some key slides to give you a sense of the depth:
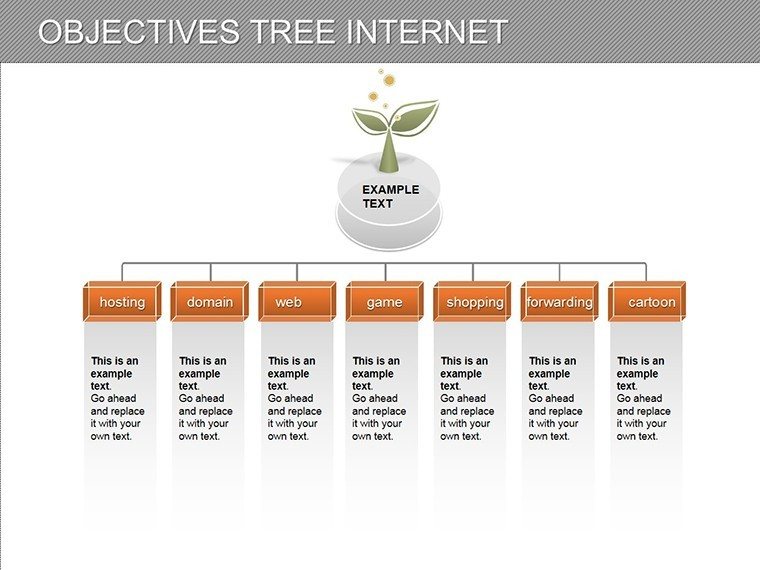
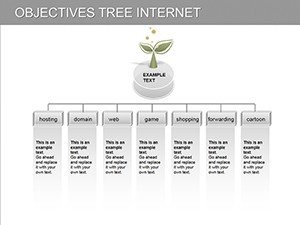
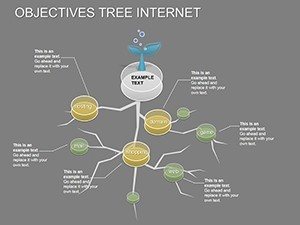
- Slide 1-5: Basic Tree Structures: Start with simple objective trees, expandable for up to 5 levels, perfect for introductory overviews.
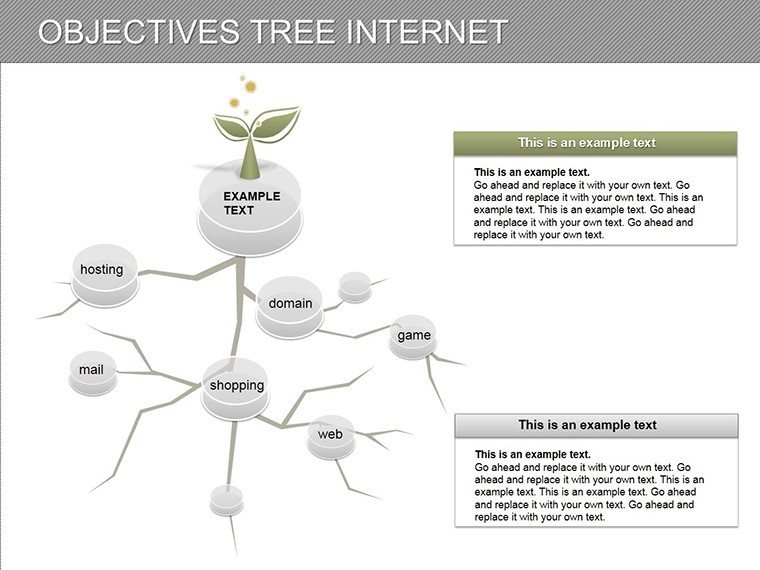
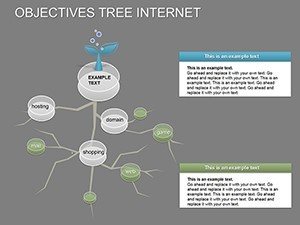
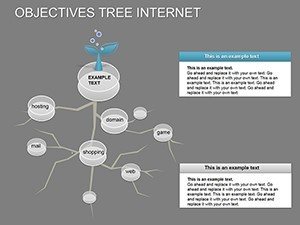
- Slide 6-15: Internet Connectivity Maps: Integrate nodes representing servers, users, and data flows, with editable labels for custom scenarios.
- Slide 16-25: Flow Charts and Processes: Sequential diagrams that link objectives to outcomes, ideal for workflow presentations.
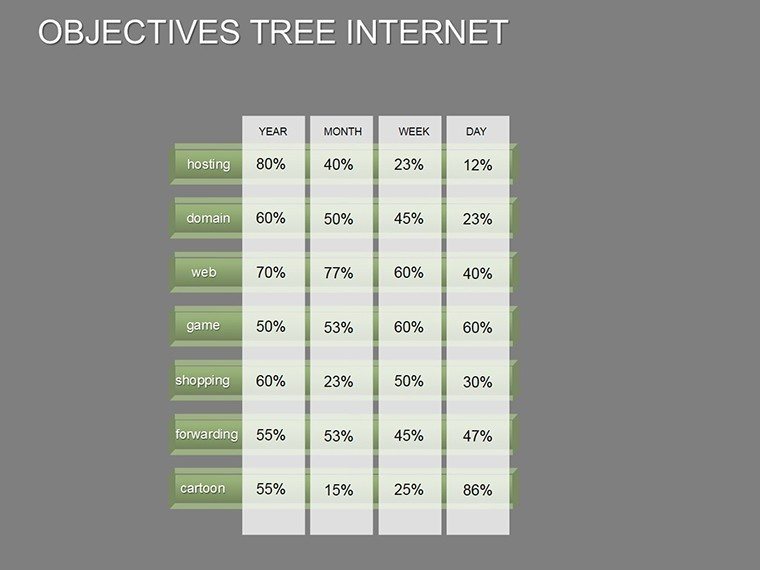
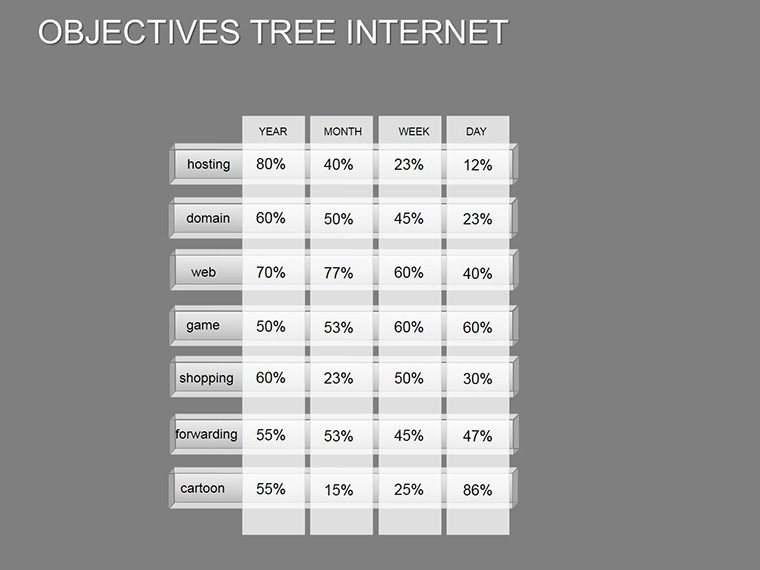
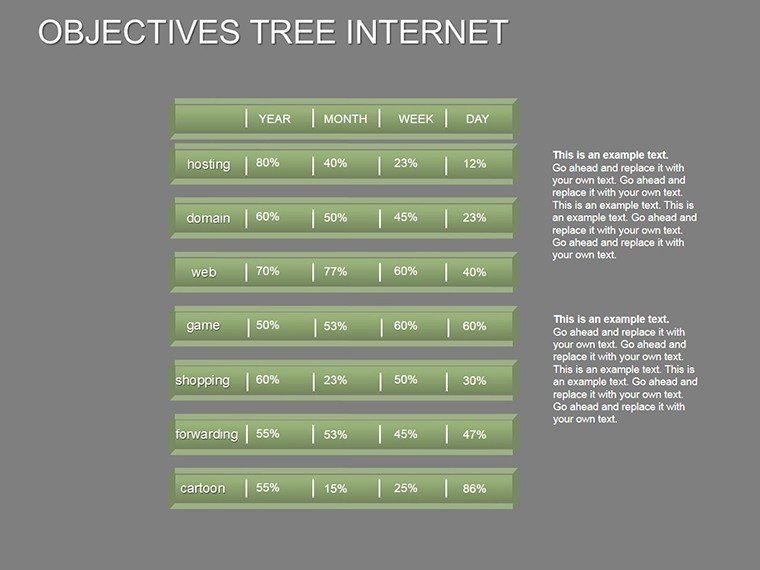
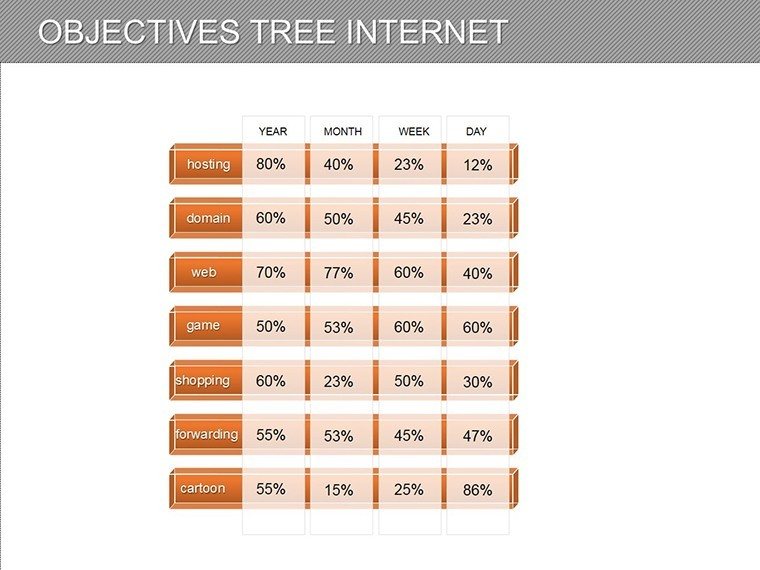
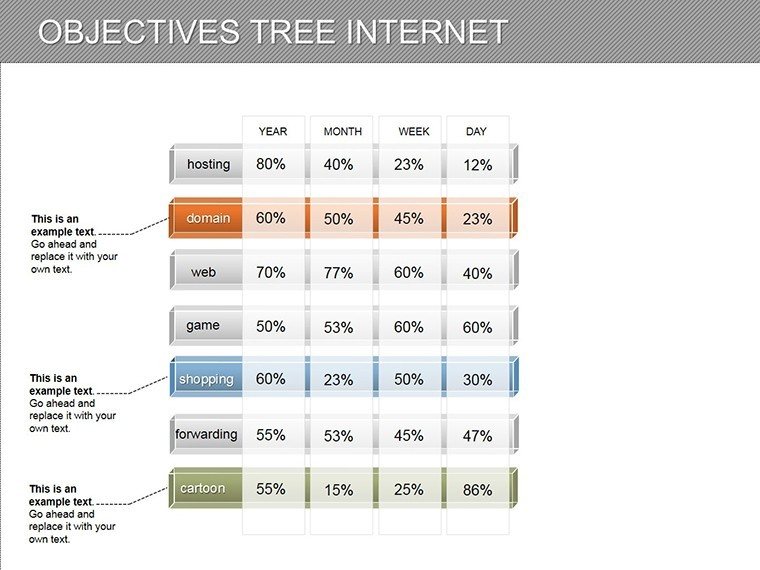
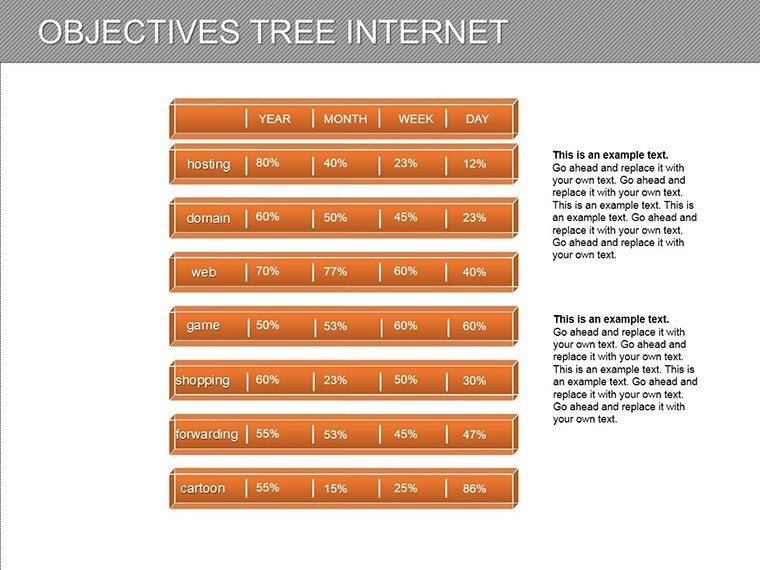
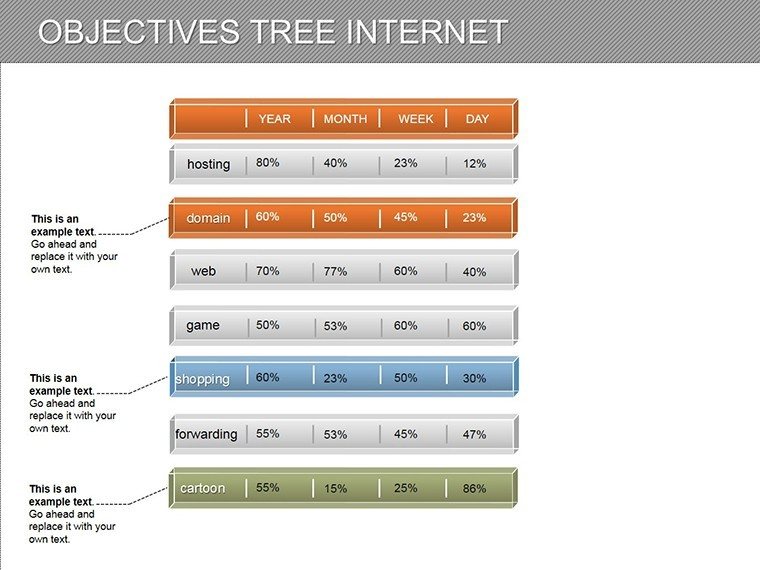
- Slide 26-38: Advanced Infographics: Combine trees with charts, icons, and text boxes for comprehensive data stories.
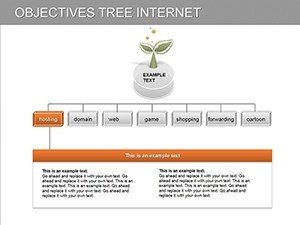
Each slide includes placeholders for text, ensuring easy insertion of your content. Tips for use: Always align colors with your brand palette for consistency, and use animations sparingly to highlight branch expansions, enhancing audience engagement without overwhelming.
Benefits for Your Professional Workflow
Beyond the slides, this template integrates seamlessly into your daily tools. Compatible with PowerPoint's collaboration features, it allows team edits in real-time, fostering better idea sharing. For those in strategic roles, it aligns with frameworks like OKR (Objectives and Key Results), where trees visually represent alignments - much like how Google uses similar visuals internally, as noted in business literature.
The trustworthiness comes from its editable nature; no locked elements mean full control, reducing frustration from rigid templates. Users report saving significant time, with one project manager noting it cut prep time in half for quarterly reviews. Whether you're preparing for a board meeting or an online webinar, these diagrams ensure your message lands with precision.
Expert Design Tips for Maximum Impact
To elevate your presentations, follow these professional tips:
- Balance text and visuals: Aim for no more than 5 lines per branch to maintain readability.
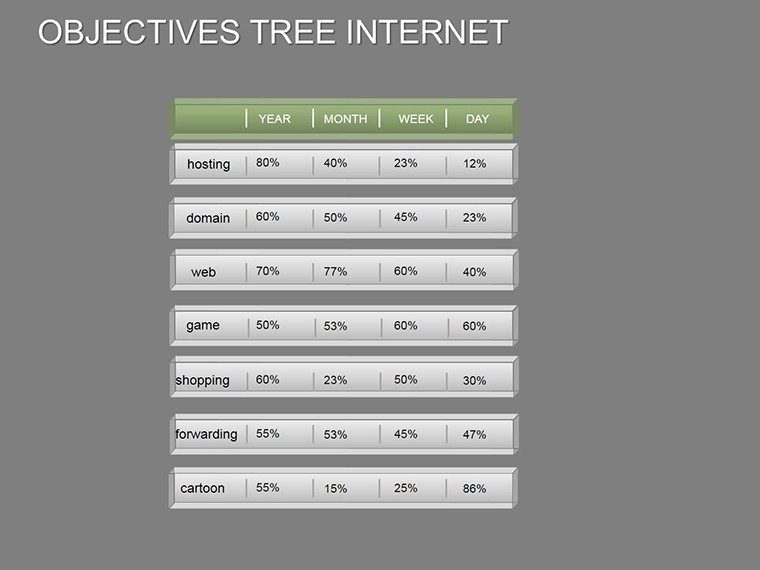
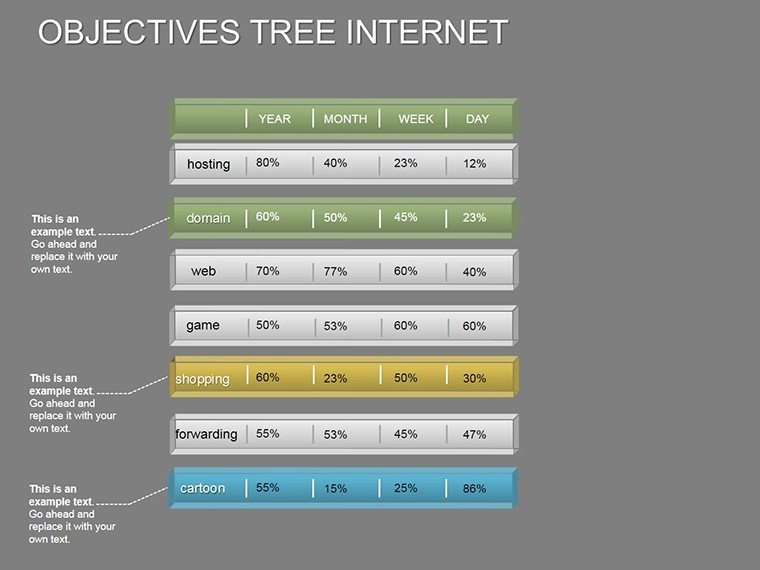
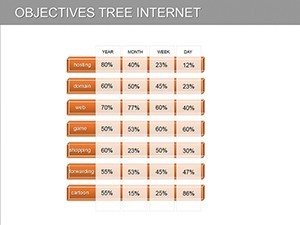
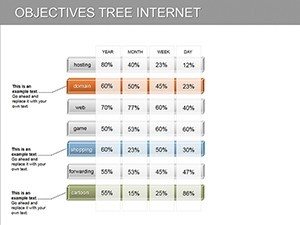
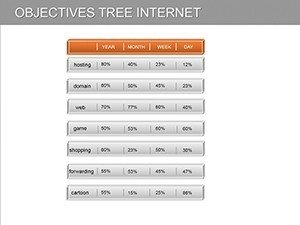
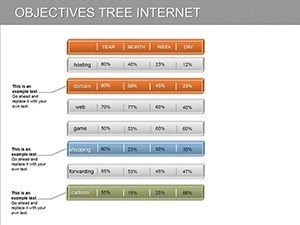
- Incorporate data: Use integrated charts within trees to back objectives with metrics, like internet uptime stats.
- Test for accessibility: Ensure color contrasts meet WCAG standards for inclusive presentations.
- Iterate based on feedback: Start with a draft tree, then refine branches during reviews.
Drawing from authoritative sources like the Harvard Business Review's articles on visual communication, these practices can boost retention rates by 65%. Apply them to make your objectives tree not just a diagram, but a storytelling powerhouse.
Why Choose This Template Today?
In a sea of basic PowerPoint options, our Objectives Tree Internet Diagrams offer specialized depth for modern needs. With 38 slides at your disposal, you're equipped to handle diverse topics from internet security hierarchies to goal-setting workshops. Don't settle for mediocre visuals - customize this template now and watch your presentations transform from informative to inspiring.
Frequently Asked Questions
How customizable are these diagrams? Fully editable - change shapes, colors, and text to fit your needs.
Is this compatible with Google Slides? Yes, import the PPTX file easily, though some advanced features may vary.
Can I use this for non-business purposes? Absolutely, it's versatile for education, personal projects, and more.
What if I need more slides? Duplicate and modify existing ones for endless expansion.
Are there animation options included? Basic animations are pre-set, but you can add custom ones in PowerPoint.