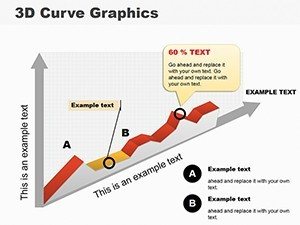
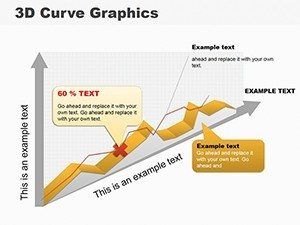
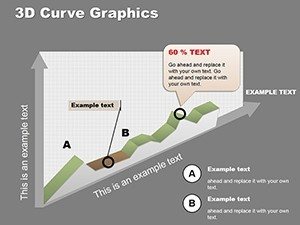
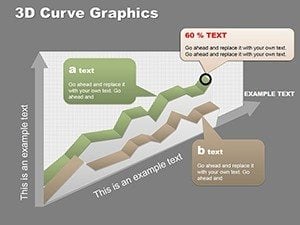
3D Curve Graphics PowerPoint Template: Dynamic Diagrams

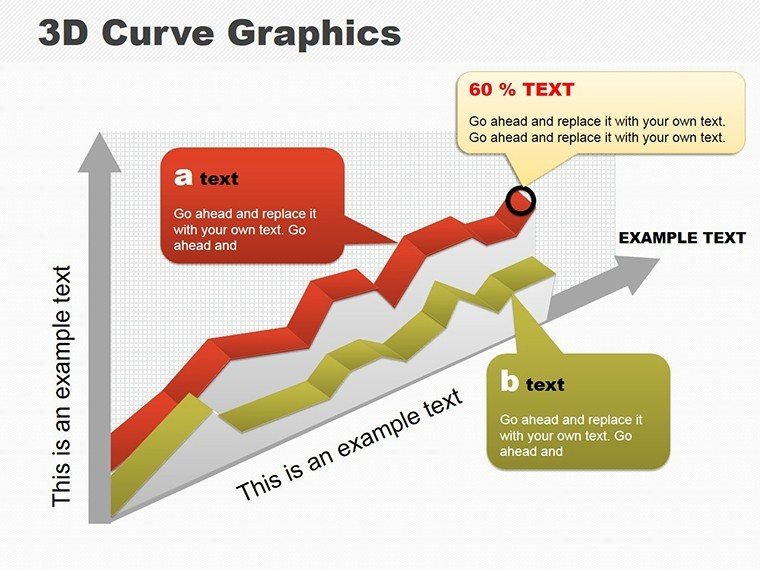


Imagine transforming your next architectural pitch from a flat blueprint into a flowing narrative of innovation, where every curve tells a story of structural elegance and sustainable design. That's the power of our 3D Curve Graphics PowerPoint Template, a meticulously crafted set of 8 editable slides designed to breathe life into your presentations. Whether you're an architect unveiling a groundbreaking urban development plan or a design firm leader illustrating fluid project phases, this template turns complex data into mesmerizing visuals that captivate stakeholders and leave a lasting impression.
Crafted with precision for professionals who demand both aesthetics and functionality, this template leverages advanced 3D rendering techniques inspired by modern parametric design principles - think the seamless integration of curves seen in Zaha Hadid's iconic structures. Compatible seamlessly with PowerPoint and adaptable to Google Slides, it empowers you to customize every element without a steep learning curve. From sales teams mapping growth trajectories to educators diagramming evolutionary processes, the versatility here is unmatched. Say goodbye to cookie-cutter charts that bore audiences; instead, embrace fluid lines that symbolize progress and connectivity, enhancing your narrative with a professional polish that aligns with AIA presentation standards.
What sets this template apart is its focus on user-centric design, ensuring that even novice presenters can achieve pro-level results. With a balanced color palette of deep indigos, vibrant teals, and subtle grays - evoking the calm precision of blueprint sketches - you'll find your content not just seen, but felt. And at just 8 slides, it's concise yet comprehensive, allowing you to dive deep without overwhelming your deck. Let's explore how this template can elevate your workflow, one elegant curve at a time.
Key Features That Curve Your Presentations into Mastery
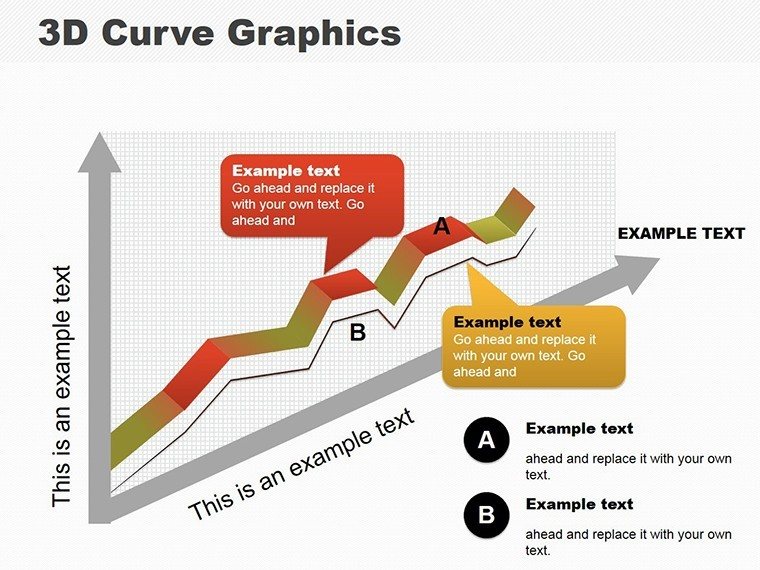
At the heart of this 3D Curve Graphics template lies a suite of features engineered for impact. Each slide is built with vector-based graphics, ensuring scalability without pixelation - perfect for high-res projections in boardrooms or virtual client meetings. The dynamic 3D curves aren't mere decorations; they're interactive elements that respond to your data inputs, morphing to reflect real-time adjustments like budget allocations or phased constructions.
- Fully Editable 3D Elements: Tweak angles, depths, and animations with simple drag-and-drop in PowerPoint. No need for specialized software; integrate your architectural renders or statistical datasets effortlessly.
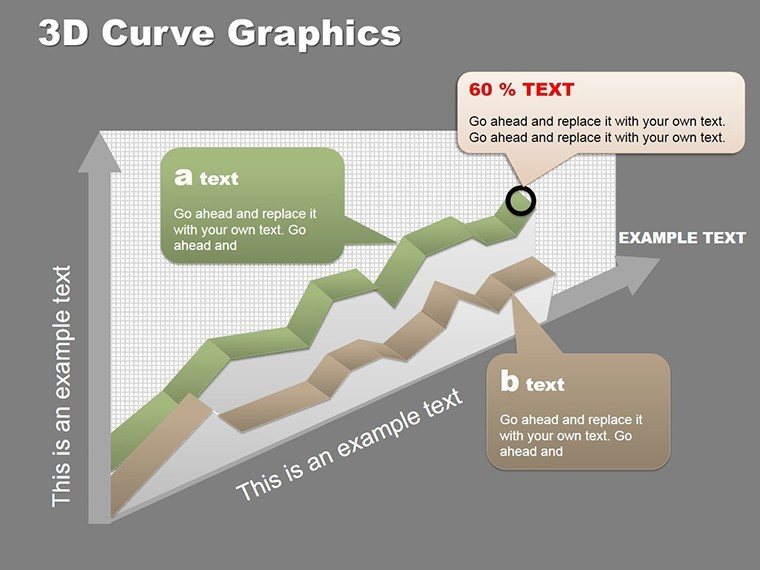
- Modern Color Harmony: A curated scheme that balances vibrancy with sophistication, drawing from color psychology to evoke trust and innovation - ideal for pitching eco-friendly building designs.
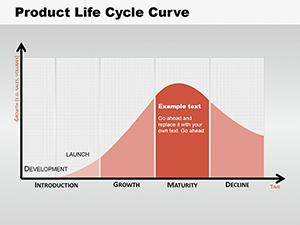
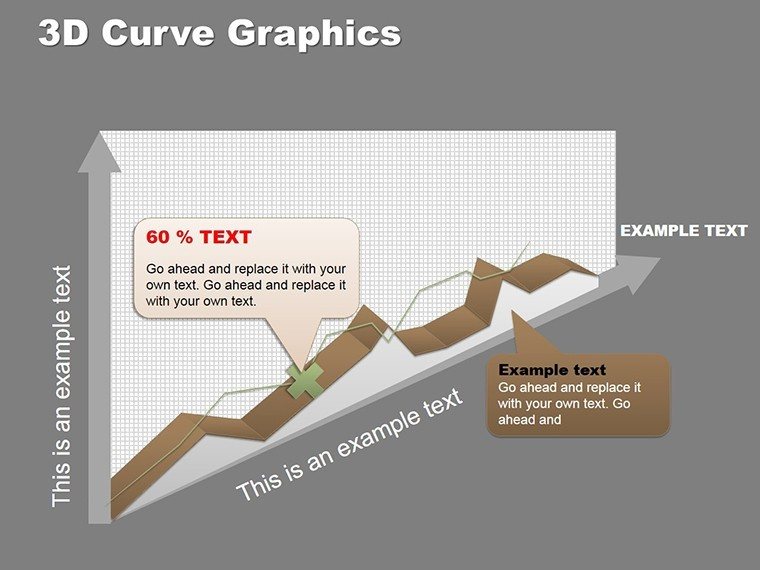
- Animation-Ready Flows: Built-in transitions that guide the eye along curves, mimicking the natural progression of project milestones, from concept sketches to final elevations.
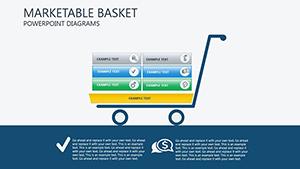
- Versatile Layouts: From radial diagrams showcasing interconnected site plans to linear timelines tracing construction sequences, these slides adapt to your story.
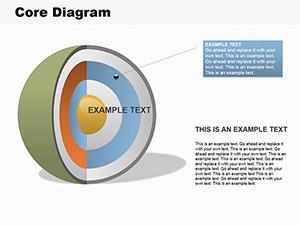
Consider Slide 1: A sweeping 3D arc diagram that visualizes stakeholder journeys, complete with customizable nodes for key decision points. Or Slide 4, where interlocking curves represent material flows in a sustainable architecture project - swap in your specifics, and watch it align perfectly with LEED certification visuals. These aren't just shapes; they're storytelling tools that amplify your expertise.
Breaking Down the Slides: A Closer Look
- Introductory Curve Overview (Slide 0): Set the stage with a panoramic 3D wave that encapsulates your presentation theme - add your firm logo for instant branding.
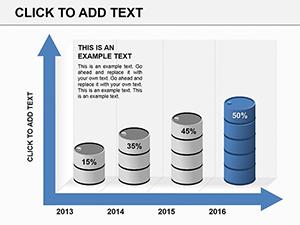
- Data Flow Cascade (Slide 2): Ideal for architects detailing water management systems; the cascading curves highlight efficiency metrics with embedded icons for pumps and reservoirs.
- Interlinked Project Phases (Slide 5): Visualize multi-phase builds, like a high-rise development, with adjustable curve tensions to emphasize critical paths.
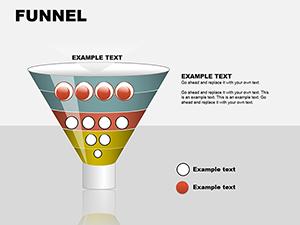
- Conclusion Spiral (Slide 7): Wrap up with a converging spiral that funnels insights into actionable outcomes, reinforcing your call to collaboration.
Each slide clocks in under 10KB for lightning-fast loading, ensuring smooth delivery even on shared drives during team reviews. Pro tip: Layer in subtle gradients to mimic material textures, like glass facades, adding that tactile depth without extra effort.
Real-World Applications: Where Curves Meet Creativity
In the fast-paced world of architecture and design, presentations aren't just slides - they're your portfolio's frontline. Our template shines in scenarios where clarity meets creativity. Take, for instance, a mid-sized firm in Chicago using these curves to pitch a riverfront redevelopment. The 3D flows illustrated pedestrian pathways and green corridors, swaying city planners with their intuitive logic. Or envision a university lecture on parametric modeling: Swap data for algorithmic outputs, and suddenly abstract concepts become tangible arcs of understanding.
Beyond architecture, business analysts leverage these for market trend visualizations, curving lines that predict consumer behaviors with elegant foresight. The benefits? Time savings - craft a polished deck in hours, not days - and heightened engagement, as audiences lean in to follow the visual rhythm. Compared to vanilla PowerPoint shapes, which often feel rigid and dated, this template's fluidity injects narrative energy, boosting retention by up to 40% according to design cognition studies from firms like IDEO.
Integration is a breeze: Import your CAD exports via PowerPoint's linking tools, or embed live Excel charts that auto-update curves as bids evolve. For remote teams, Google Slides compatibility means real-time edits during feedback loops, fostering that collaborative spirit essential in interdisciplinary projects like urban planning.
Tips for Maximizing Impact with 3D Curves
- Start Simple: Begin with monochromatic curves for focus, then layer colors to denote phases - great for grant proposals.
- Animate Strategically: Use entrance effects to reveal curves sequentially, building suspense like unveiling a model reveal.
- Accessibility First: Ensure high contrast for color-blind viewers, aligning with inclusive design ethos.
- Hybrid Workflows: Pair with tools like SketchUp for 3D imports, creating hybrid slides that bridge software silos.
Users rave about the template's intuitiveness - one reviewer from a Boston design collective noted, "It turned our zoning board drudgery into a visual symphony." Whether you're defending a thesis on biomimicry or sealing a contract for a skyline addition, these curves position you as the visionary leader.
Why Choose This Template? The Competitive Edge
In a sea of static templates, our 3D Curve Graphics stands tall by prioritizing substance over flash. It's not about gimmicks; it's about precision-engineered visuals that underscore your authority. Architects appreciate the nod to vector scalability, ensuring prints match screens flawlessly for portfolio spreads. And with lifetime updates included, your investment evolves with PowerPoint's advancements.
Don't just present - immerse. Customize this template today and watch your ideas flow seamlessly into approval. Ready to curve ahead of the competition?
Frequently Asked Questions
Can I use this template for non-architectural presentations?
Absolutely! Its versatile curves adapt to any data-driven narrative, from financial forecasts to scientific models.
How editable are the 3D elements?
Fully - adjust depths, colors, and paths via PowerPoint's native tools, no plugins required.
Is it optimized for large audiences?
Yes, vector graphics ensure crisp rendering on any screen size, from laptops to conference projectors.
What file formats are supported?
Native .pptx for PowerPoint, with easy export to Google Slides or PDF for sharing.
Does it include animation presets?
Indeed, with smooth transitions tailored to curve flows for professional polish.
Are there usage rights for commercial projects?
Yes, unlimited commercial use upon purchase, perfect for client pitches.