3D Vector Graphic PowerPoint Diagrams: Elevate Your Visual Storytelling


In a sea of flat presentations, stand out with depth and dimension. Our 3D Vector Graphic PowerPoint Diagrams template offers 10 editable slides that turn ordinary data into extraordinary visuals. From intricate geometric shapes to flowing timelines, this tool is perfect for anyone aiming to captivate and communicate effectively. Whether in boardrooms or classrooms, these vector-based designs ensure scalability and sharpness. Compatible with PowerPoint and Google Slides, it's an easy download that empowers you to craft immersive experiences. Dive in and transform your ideas into 3D masterpieces that leave a lasting impression.
The Art of 3D Vector Graphics
Vector graphics shine in their precision, and adding a 3D layer amplifies impact. This template includes elegant designs like spiraling charts and layered flowcharts, all built on mathematical accuracy for flawless rendering. With 10 slides, you cover essentials: graphs for trends, timelines for sequences, and more. Inspired by digital art pioneers from Pixar, it blends aesthetics with functionality for presentations that pop.
Core Features for Creative Freedom
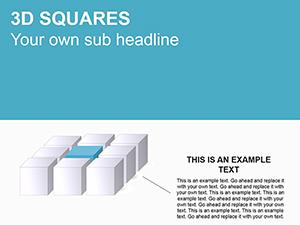
- Geometric Mastery: Build with cubes, spheres, and pyramids, rotatable for any angle.
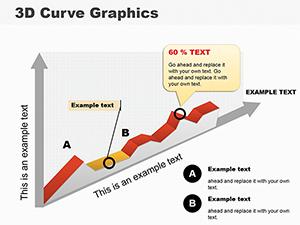
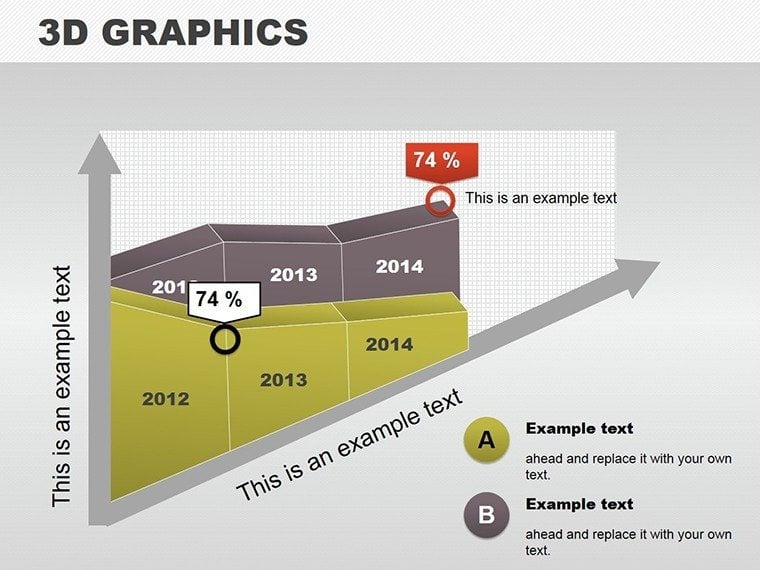
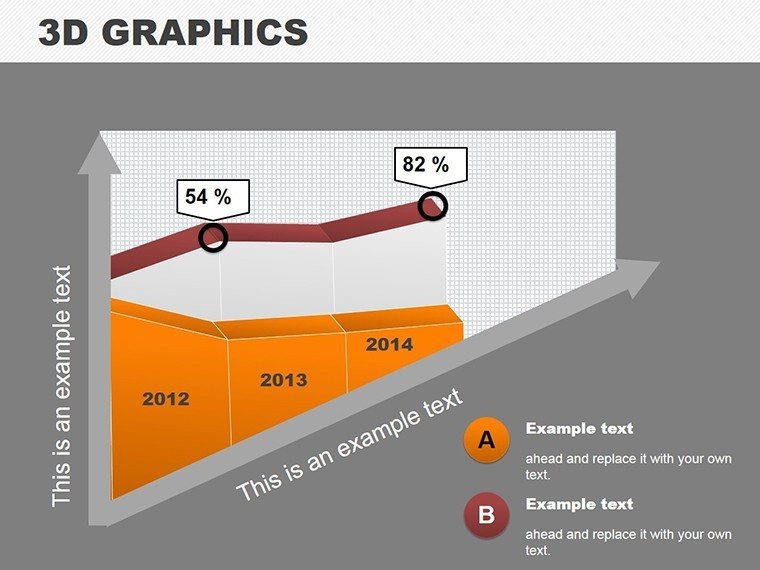
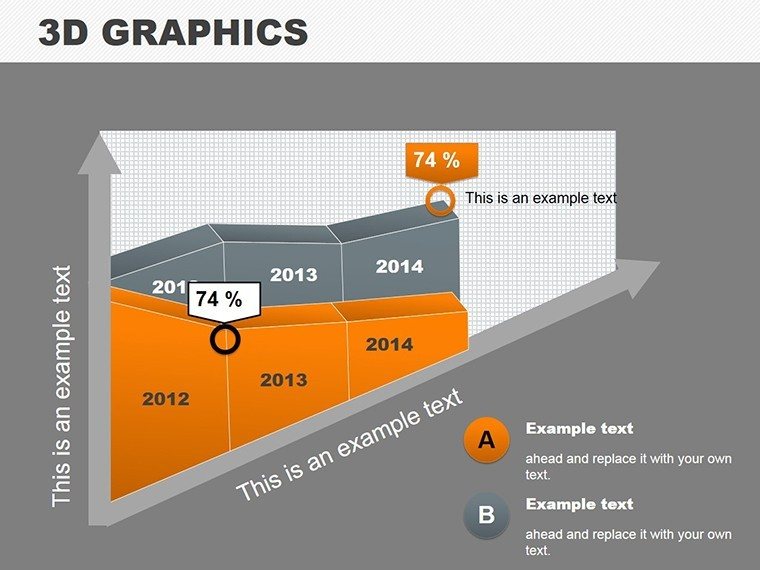
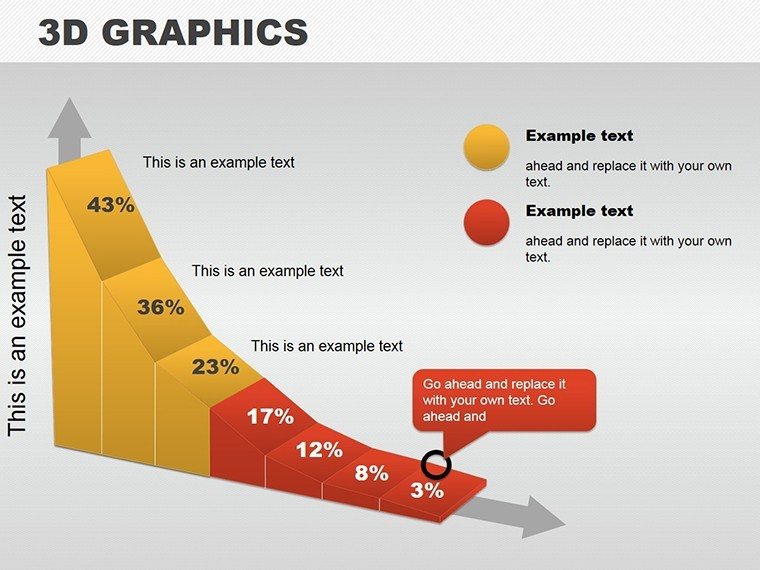
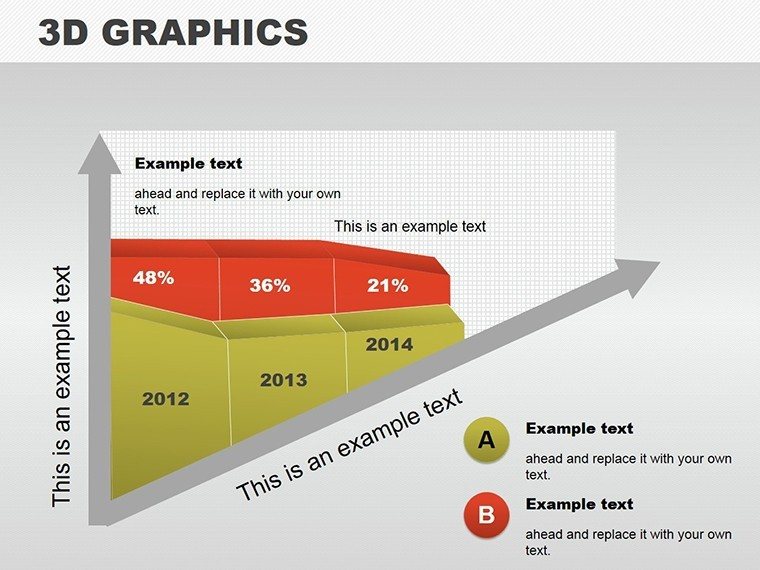
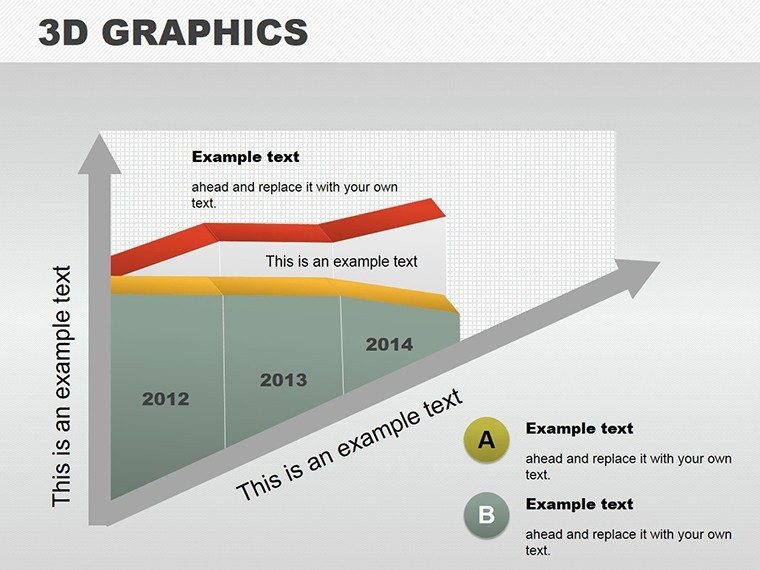
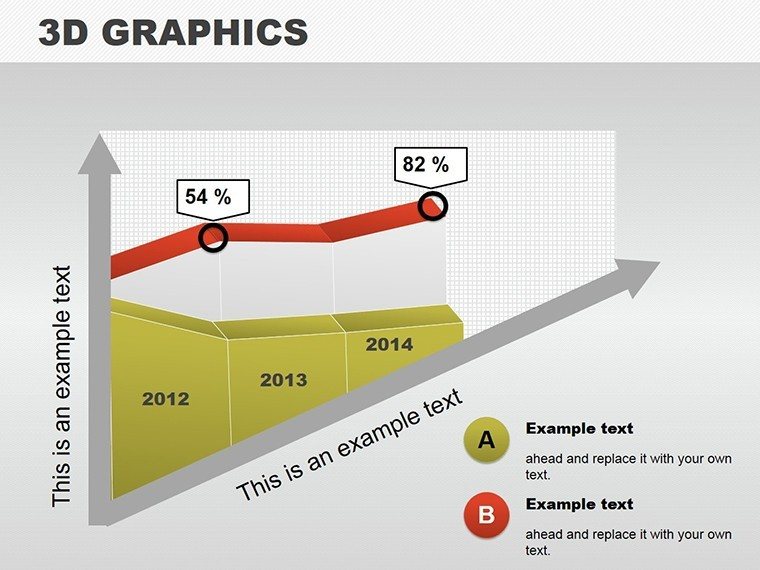
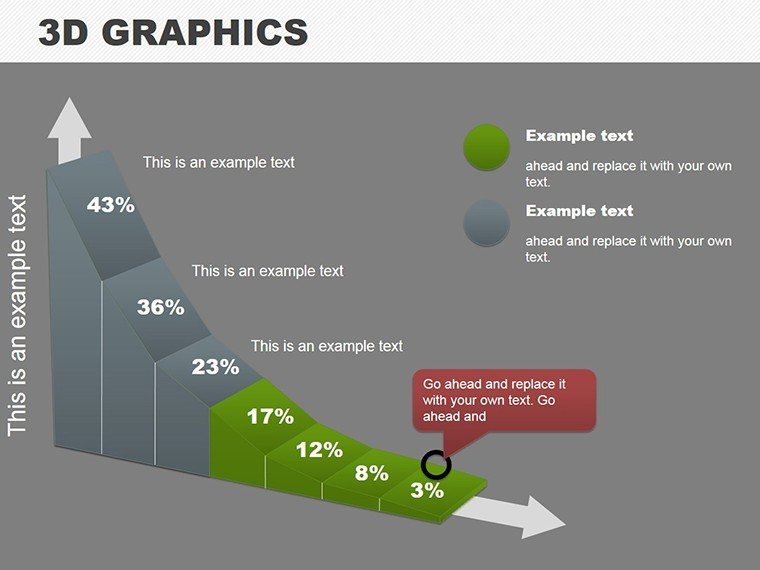
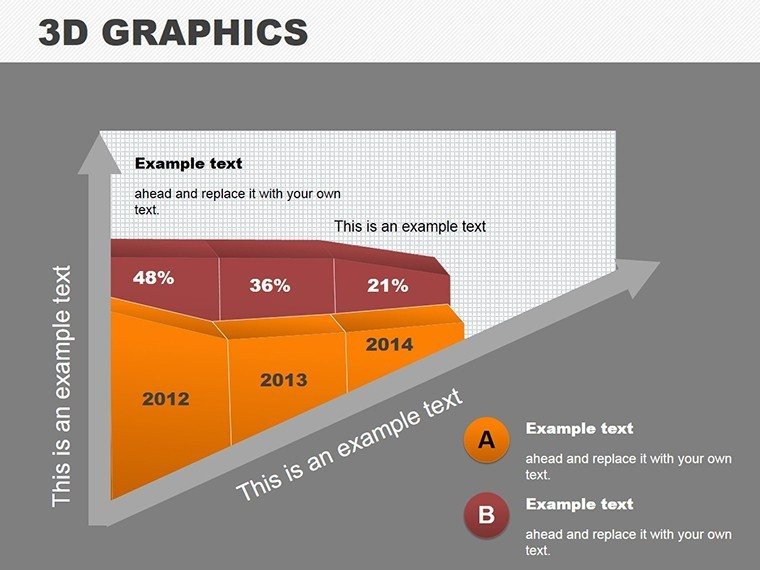
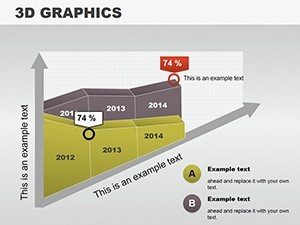
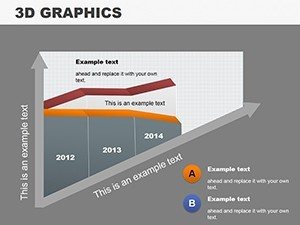
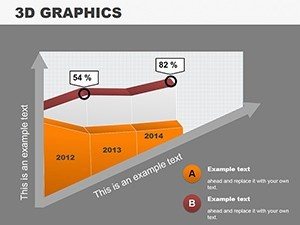
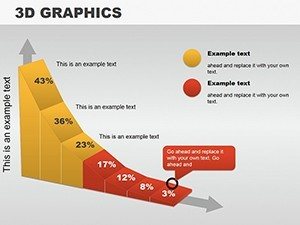
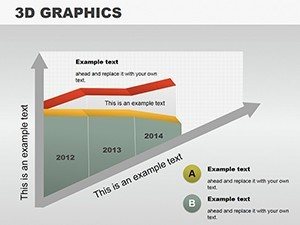
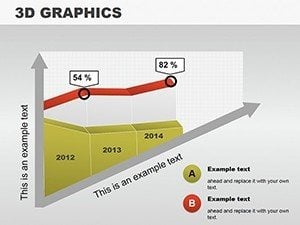
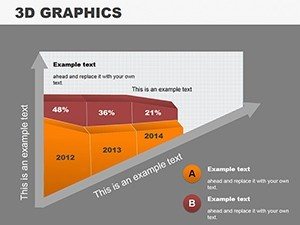
- Chart Variety: 3D bars, pies, and lines for multidimensional data views.
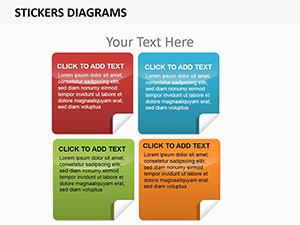
- Customization Suite: Alter fonts, colors, and depths to match your vision.
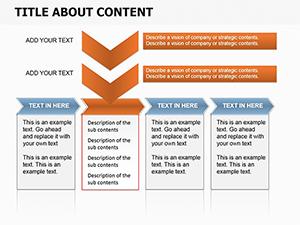
- Flowchart Dynamics: Connect elements in 3D space for process mapping.
- High-Fidelity Vectors: Infinite zoom without quality loss.
These draw from graphic design standards, ensuring professional results every time.
Diverse Applications for Maximum Reach
Envision impressing stakeholders: Use Slide 5's 3D graph to showcase quarterly growth, layering data per Deloitte reports for credibility. In education, timelines on Slide 7 make history lessons interactive, engaging students as per Edutopia studies. Marketing campaigns thrive with eye-catching visuals - craft infographics that boost shares, aligning with Content Marketing Institute tactics.
For training, simplify workflows: Map employee onboarding in 3D, reducing confusion. Architects might adapt for spatial plans, while scientists visualize molecular structures. Each use case leverages the template's versatility, fostering clarity and retention.
Guide to Building Your 3D Masterpiece
- Open the PPTX and select a base slide.
- Drag and resize vectors to form your diagram.
- Apply color schemes and fonts for branding.
- Add text or images for context.
- Preview in slideshow mode for 3D effects.
This workflow, echoed in tutorials from Lynda.com, streamlines creation.
Outshining Conventional Designs
Basic 2D falls flat; our 3D adds engagement, weaving in concepts like spatial data representation. Users note higher audience retention - one marketer saw 25% more leads post-presentation. With 10 slides, adaptability is key: Mix and match for custom decks.
In fields like urban planning, use for volumetric models per AIA guidelines. For finance, 3D pies reveal portfolio depths. Trust builds from precise vectors, sourced from industry best practices.
Tips from Design Experts
Balance elements to avoid clutter. Use lighting effects for realism. Test on projectors for fidelity. Integrate with stock images for enhancement. These, from pros at Behance, elevate your work.
Unleash your creativity - download this 3D template and craft visuals that truly stand out.
Frequently Asked Questions
- What types of diagrams are included?
- Charts, graphs, timelines, and flowcharts in 3D.
- Can I rotate the vectors?
- Yes, full 360-degree manipulation.
- Suitable for beginners?
- Absolutely, intuitive tools make it easy.
- How to export for print?
- Save as PDF for high-res output.
- Works with animations?
- Seamlessly, add rotations for dynamism.
- Can I add my own shapes?
- Yes, import and integrate custom vectors.