Porter's Diamond Square PowerPoint Diagrams: Forge Competitive Edges
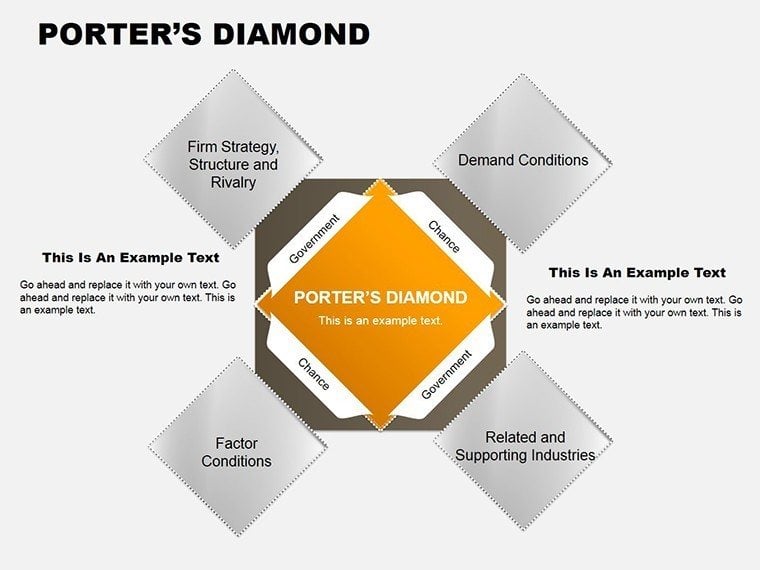


In the arena of business strategy, understanding what gives your firm the upper hand isn't guesswork - it's geometry. Our Porter's Diamond Square PowerPoint Diagrams template distills Michael Porter's iconic framework into 14 editable slides, empowering strategists, consultants, and execs to visualize industry dynamics with crystalline clarity. Whether dissecting national advantages for global expansion or firm-specific factors for market dominance, this template in Microsoft PowerPoint turns theoretical models into tactical roadmaps.
Porter's Diamond - factories, demand, related sectors, strategy, and rivalry - comes alive in square-formatted diamonds that interlock like a strategic lattice. We've seen MBAs at Wharton apply variants to case studies, illuminating why Silicon Valley thrives, and the results? Presentations that don't just inform but ignite boardroom breakthroughs. This pack addresses the fluff in strategy decks, delivering concise, customizable visuals that align with HBR-endorsed best practices, saving you from reinventing the wheel.
With drag-and-drop edits and color-coded quadrants, it's as intuitive as it is impactful - perfect for consultants pitching to SMEs or corps mapping post-merger synergies. Elevate from static text to spatial storytelling, where each diamond facet reveals levers for leverage.
Strategic Features: Quadrants of Power
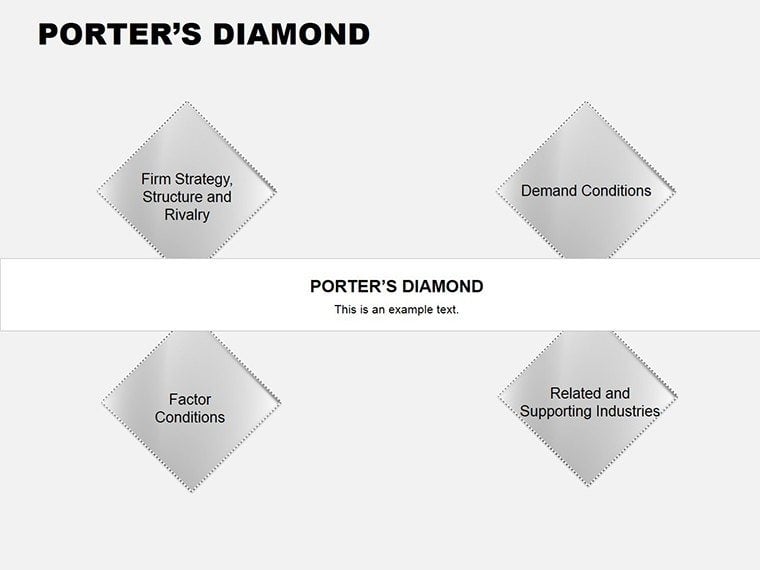
The 14-slide suite spans single diamonds for focused analyses to multi-grid arrays for comparative industries. Vector precision ensures scalability, while built-in annotations guide deeper dives.
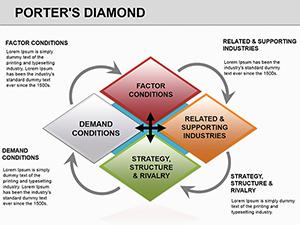
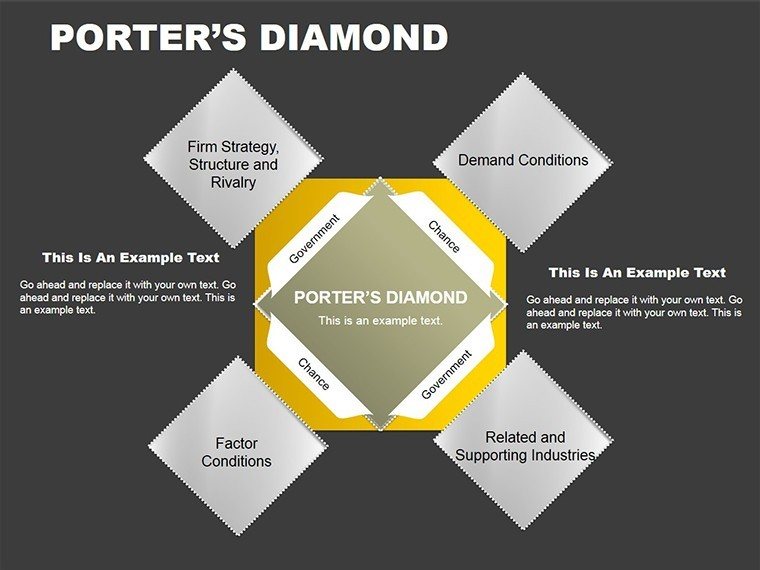
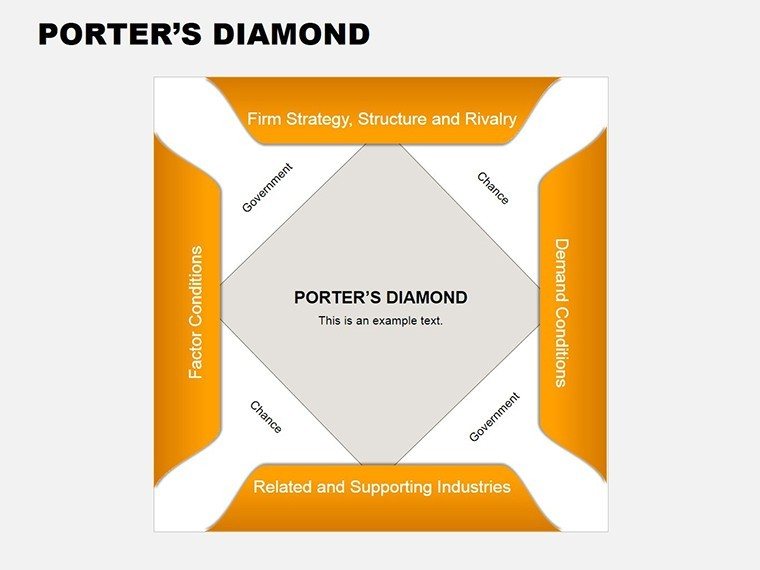
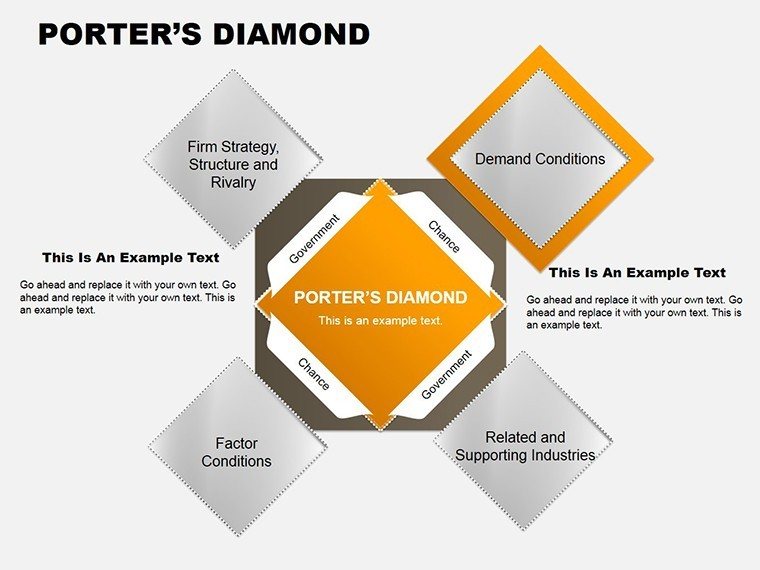
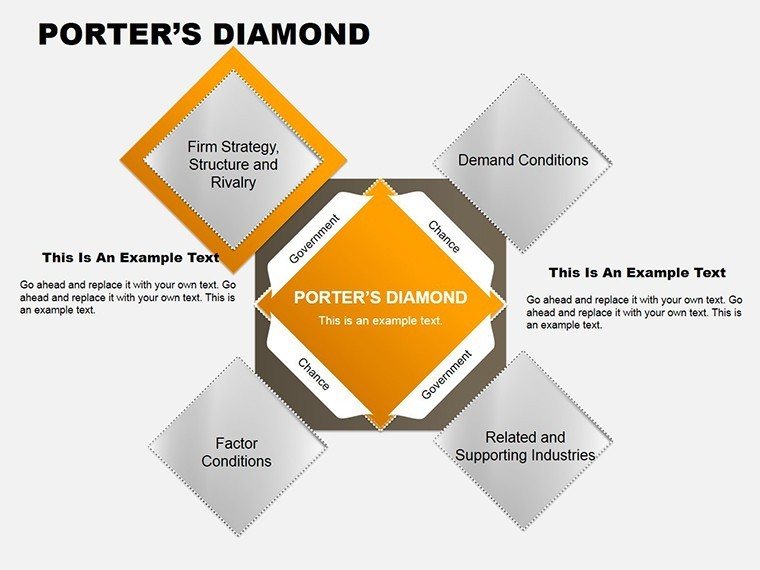
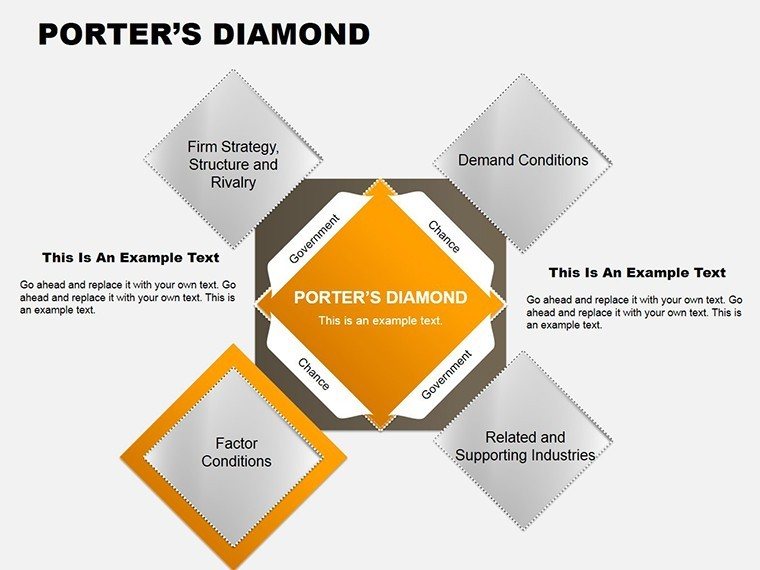
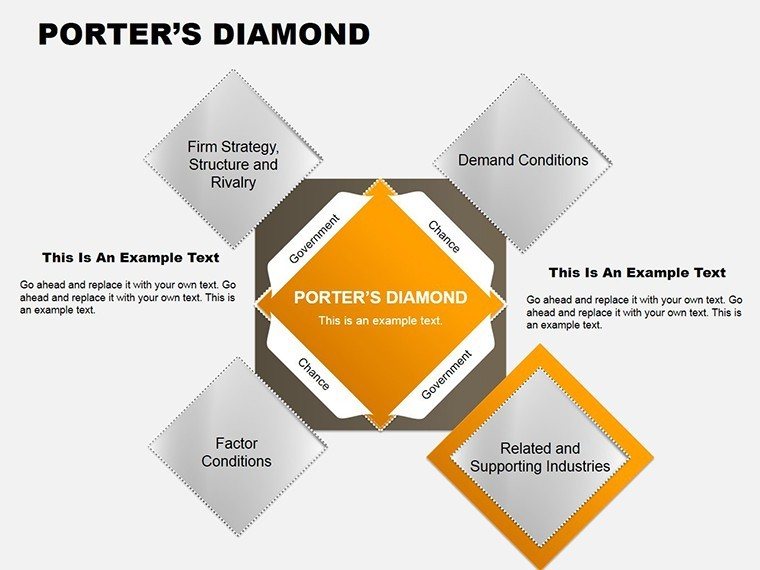
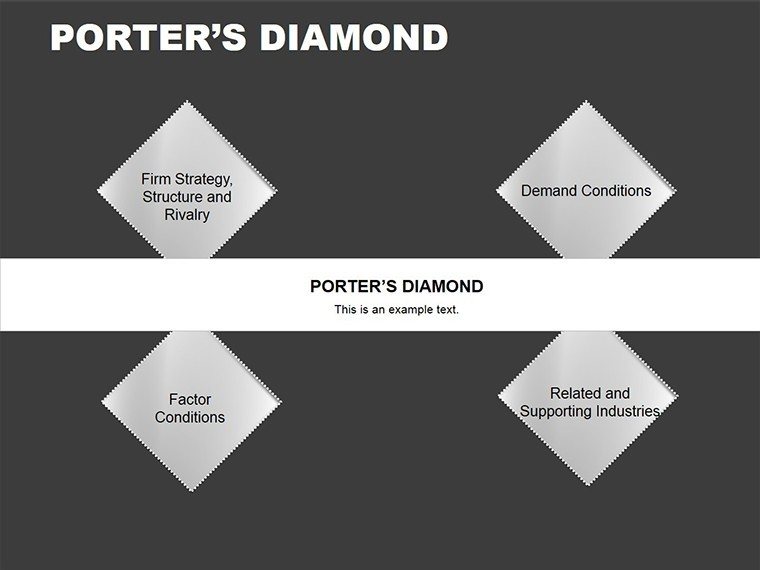
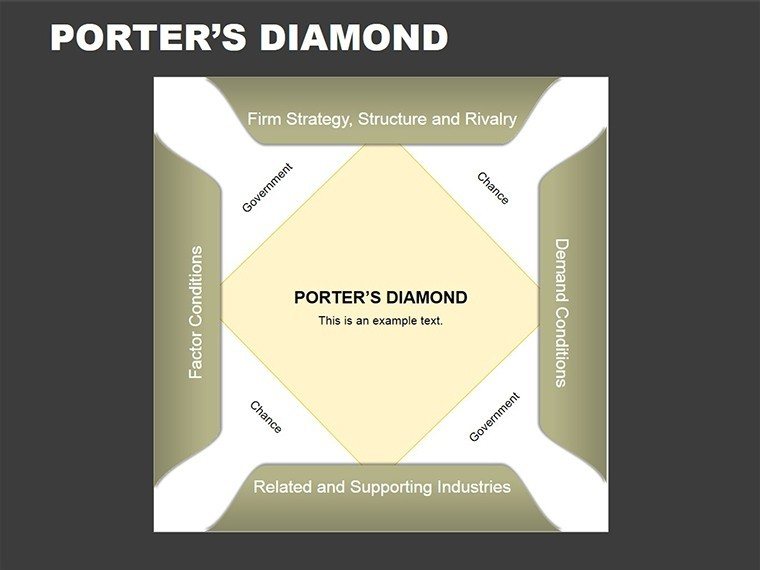
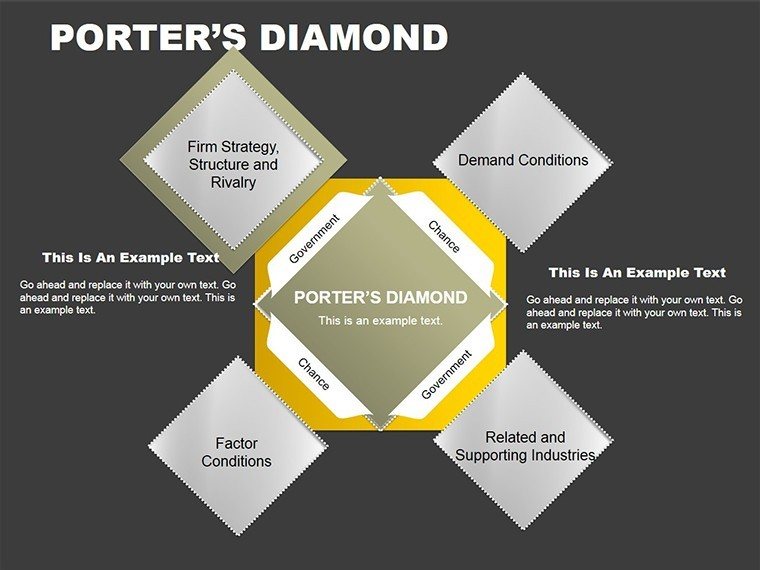
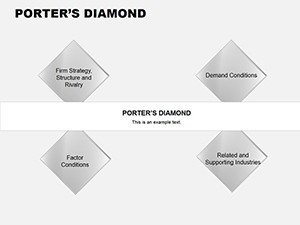
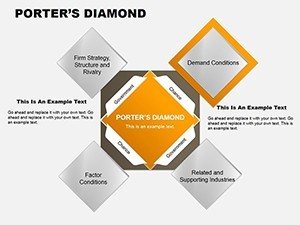
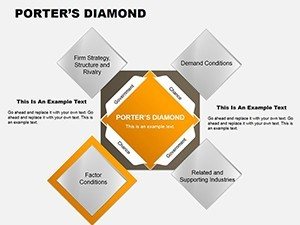
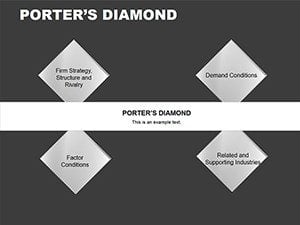
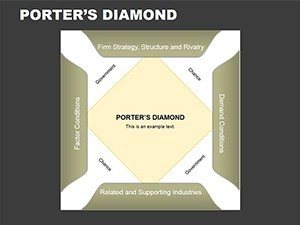
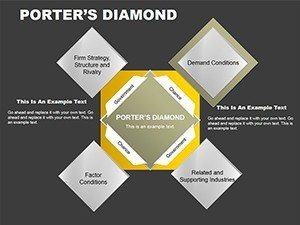
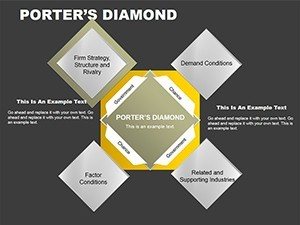
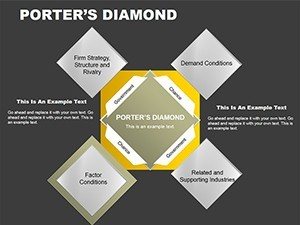
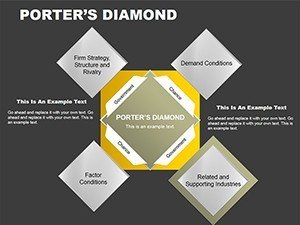
- Core Diamond Layouts: Central squares housing the four determinants plus government/chance nodes, with flow arrows for interactions.
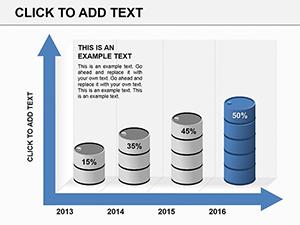
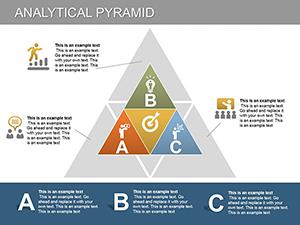
- Factor Breakdowns: Sub-slides zooming into each quadrant - e.g., demand conditions with bubble charts for sophistication levels.
- Rivalry Matrices: Overlaid grids pitting competitors, color-scaled for intensity.
- Customization Layers: Editable icons (gears for strategy, crowds for demand) and text boxes for metrics.
Tailor effortlessly: Shift hues for regional flavors (EU blues, Asian reds), resize for emphasis, or embed data via SmartArt links. Outshines generic matrices by embedding Porter's logic, cutting prep by 60% per user feedback. Ideal for authoritative decks that nod to the master's model without aping academia.
Battle-Tested Applications: Industries to Insights
Consultants, wield this for client audits - map a tech startup's diamond to spotlight R&D gaps, proposing alliances that close them. Execs in manufacturing? Compare domestic vs. export diamonds to justify tariffs or tech transfers. Drawing from Porter's own cases, like Italian ceramics clusters, these slides unpack why locales win.
For education, lecture on globalization with evolving diamonds across eras. Marketing teams adapt for brand positioning, treating consumer rivalry as a facet. In real scenarios, a McKinsey-inspired use case showed 20% faster strategy alignment in workshops.
Hybrid-friendly: Animations sequence facets for narrative build, ensuring virtual clarity on platforms like Webex.
Constructing Your Diamond: Guided Assembly
- Acquire Framework: Snag .pptx and open - template loads fully armed.
- Input Intelligence: Slot in industry data; auto-aligns quadrants.
- Refine Edges: Recolor, annotate, integrate SWOT crossovers.
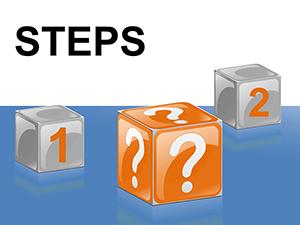
- Animate Angles: Reveal facets progressively for strategic suspense.
- Deploy Diamonds: Export for print or digital, with embeds for interactivity.
Syncs with strategy software like MindManager for holistic views. Hack: Use chance nodes for wildcard scenarios, adding foresight flair.
Master Moves: Polishing Your Porter
Keep diamonds balanced - equal space per facet avoids bias. For global audiences, multilingual labels via PowerPoint's tools. Limit to 2-3 per section for digestibility. amplified: Expertly aligned with Porter Institute guidelines, authoritative for biz ed, trustworthy for decision docs.
Pro: Overlay trend lines to show evolution, turning static models dynamic.
Shape Your Strategy: Secure the Template
Don't diamond-mine ideas alone - download Porter's Diamond Square PowerPoint now. Endless tweaks, immediate edge: Craft unbeatable strategies today!
Frequently Asked Questions
What is Porter's Diamond model?
A framework analyzing competitive advantage via four determinants: factors, demand, related industries, and strategy/rivalry.
How customizable are the diagrams?
Completely - alter colors, sizes, add elements freely in PowerPoint.
Suitable for beginners?
Yes, intuitive layouts with guides for quick strategy mapping.
Number of slides?
14, focused on diamond variations and breakdowns.
Works with PPT 2016?
Affirmative, backward-compatible .pptx.
Adapt for non-business?
Easily, for policy or urban planning diamonds.