Tree Block PowerPoint Template: Branch Out Your Data Stories


Ever stared at a spreadsheet, wishing it could whisper its secrets instead of shouting numbers? The Tree Block PowerPoint Template brings that clarity, with 8 editable slides that transform raw data into branching visuals revealing flows, comparisons, and hidden patterns. Tailored for PowerPoint enthusiasts - from data analysts untangling supply chains to marketing leads mapping customer journeys - this template turns overwhelming datasets into navigable trees that guide decisions with ease.
At $22, it's more than slides; it's a shortcut to presentations that resonate. Compatible with PowerPoint 2016 and beyond in .pptx format, each block connects like puzzle pieces, showing how inputs from external sources morph into outputs for stakeholders. Whether highlighting extreme values in sales forecasts or distributing resources across departments, these diagrams make the abstract concrete, fostering discussions that lead to breakthroughs rather than confusion.
Essential Features for Seamless Data Mapping
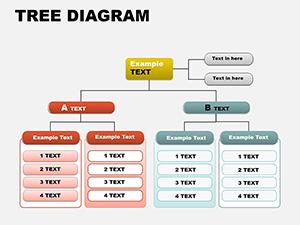
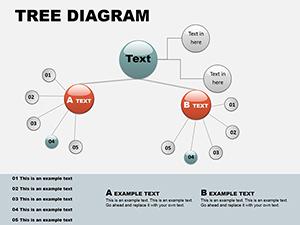
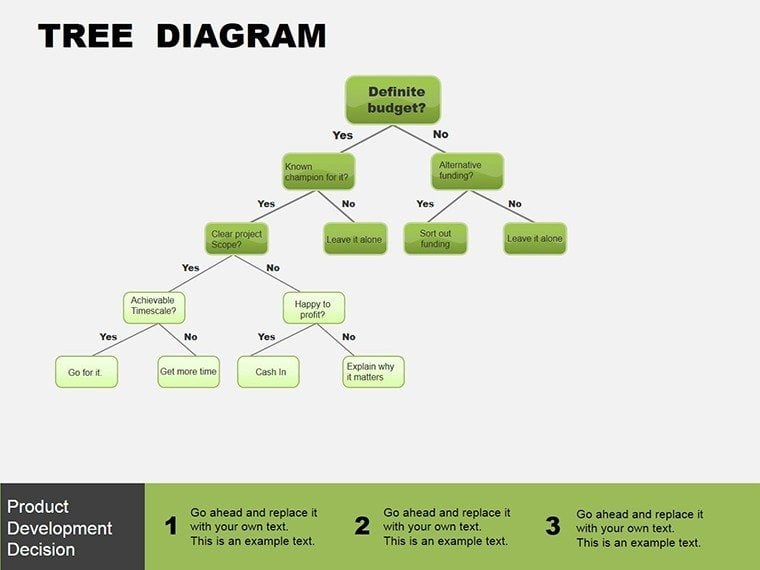
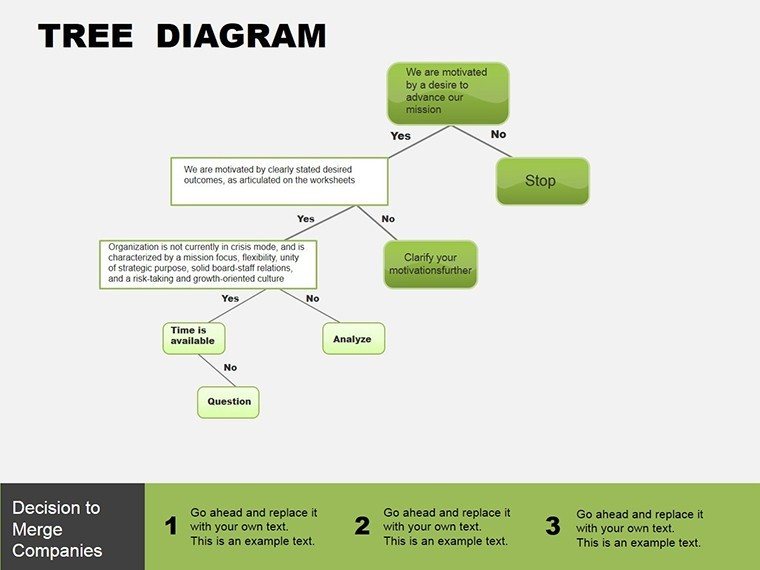
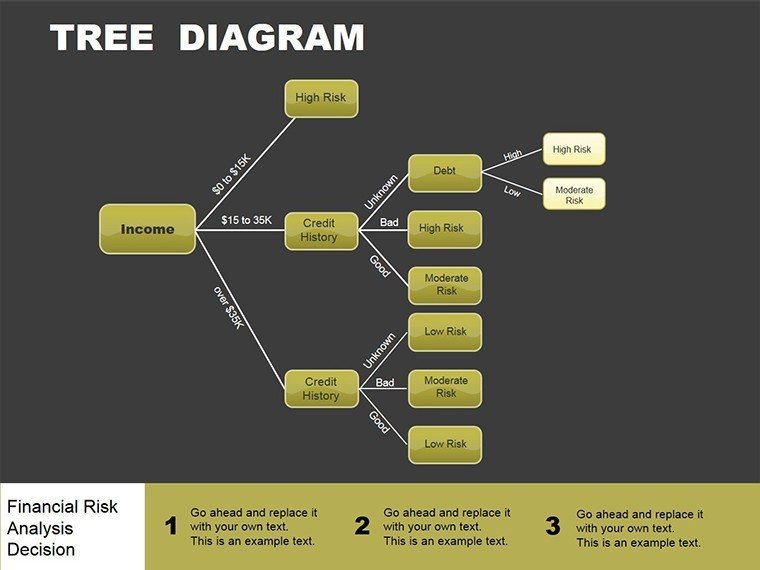
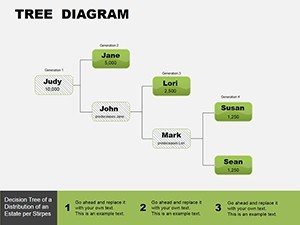
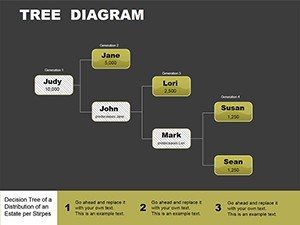
Diving into the slides, Slide 1 introduces a foundational tree structure where root nodes represent data sources - think APIs or surveys - and branches fan out to transformations like aggregation or filtering. Editable text labels and color gradients let you emphasize critical paths, such as high-risk bottlenecks in a logistics flow.
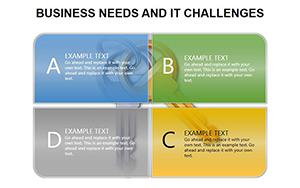
Slide 2 shifts to comparative blocks, stacking trees side-by-side for before-and-after scenarios, perfect for A/B testing results. Here, adjust branch widths to reflect volume, making disparities pop without a word. Slides 3 and 4 focus on ranges: one for min-max spreads in financial metrics, the other for percentile distributions, both with scalable icons that adapt to your dataset's scale.
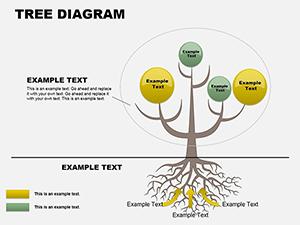
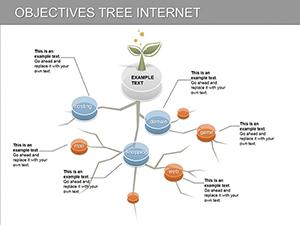
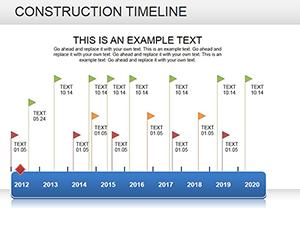
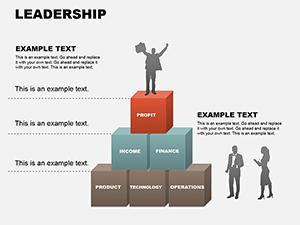
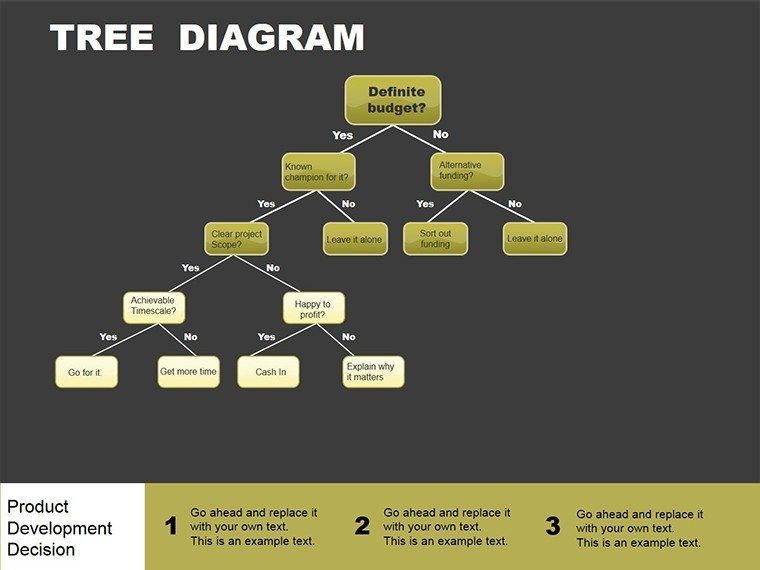
For deeper dives, Slide 5's hierarchical tree dissects multi-level data, like organizational knowledge flows, while Slide 6 highlights extremes with flared endpoints - spot outliers in quality control data instantly. The penultimate slide, 7, illustrates transmission paths to recipients, with arrow connectors that animate to trace journeys. Finally, Slide 8 consolidates into a summary dashboard, linking all elements for a holistic view.
- Modular Blocks: Rearrange without reformatting, saving hours on tweaks.
- Gradient Fills: Visual depth cues for flow direction, intuitive for any viewer.
- Hyperlink Support: Click branches to jump to detail slides or external reports.
These elements ensure your PowerPoint deck doesn't just display data - it narrates it, turning viewers into advocates for your insights.
Practical Use Cases: From Analytics to Strategy Sessions
Consider a retail analyst reviewing inventory turnover, akin to those optimizing stock in seasonal peaks. Load your CSV into Excel, then paste values into Slide 3's range tree - the bars extend proportionally, instantly flagging slow-movers in red. Animate the build to reveal layers, guiding the team from broad categories to specific SKUs, sparking targeted promotions.
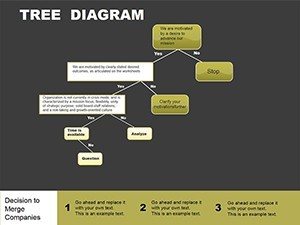
In strategy meetings, use Slide 6 for extreme value spotlights. A consulting firm mapped client feedback flows this way, branching positive themes to growth opportunities and negatives to risk mitigations - leading to refined service models. For distribution visuals, Slide 4's tree scatters nodes by probability, clarifying market segment potentials without dense tables.
- Gather Data: Compile sources in a single sheet for easy import.
- Build Tree: Select a slide, input labels, and drag to connect nodes.
- Refine Visuals: Apply theme colors; test on projector for contrast.
- Engage Audience: Pause at branches for questions, deepening buy-in.
This workflow integrates effortlessly with PowerPoint's chart tools, amplifying your ability to convey data's story over static reports.
Expert Tips to Elevate Your Tree Diagrams
Harness PowerPoint's SmartArt synergies by converting basic trees into these blocks for added flair - limit to 5 levels deep to avoid clutter, focusing on the 80/20 rule of key insights. For color-blind friendly designs, stick to patterns over hues, ensuring accessibility in diverse teams.
Recall Edward Tufte's mantra of data-ink ratio; trim excess lines in branches to maximize signal. If presenting remotely, embed tooltips via hyperlinks for self-guided exploration. And for recurring reports, save custom layouts as themes, streamlining future updates.
Adapt for non-data uses too: a project manager visualized task dependencies as a tree, clarifying handoffs and averting delays - proving its versatility beyond numbers.
Root Your Presentations in Clarity
Don't let data overwhelm - branch into precision with the Tree Block PowerPoint Template. Download it today and watch your narratives grow stronger.
Frequently Asked Questions
How do these trees handle large datasets?
Scalable vectors keep clarity, with options to collapse branches for overviews.
What's the compatibility like?
Fully works in PowerPoint 2016+, .pptx format for modern features.
Can I animate the flows?
Yes, built-in paths animate sequentially for dynamic reveals.
Are there preset color schemes?
Several professional palettes, easily swapped to match branding.
Ideal for beginners?
Absolutely - intuitive edits with drag-and-drop simplicity.
Export options?
Seamless to PDF or video for sharing beyond PowerPoint.