Process Modeling Charts - Editable PPTX | ImagineLayout


Type: PowerPoint Charts template
Category: Timelines
Sources Available: .pptx
Product ID: PC00589
Template incl.: 22 editable slides
Package Contents
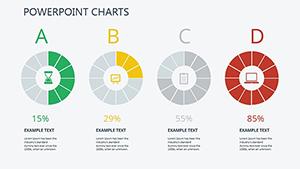
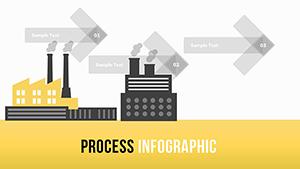
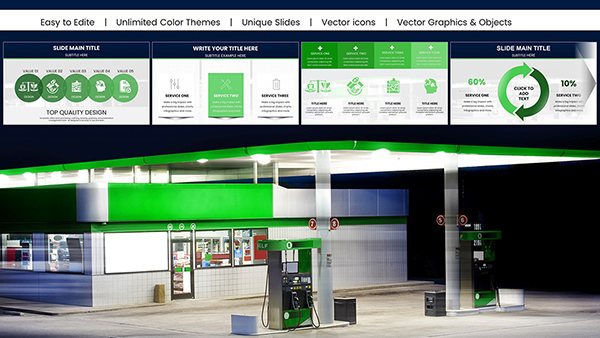
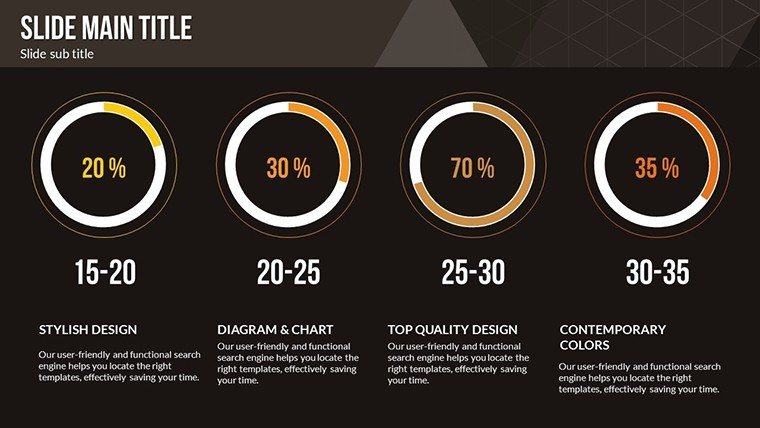
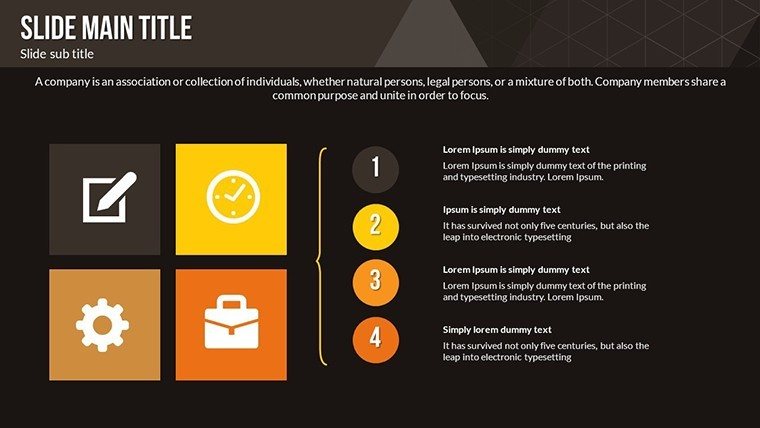
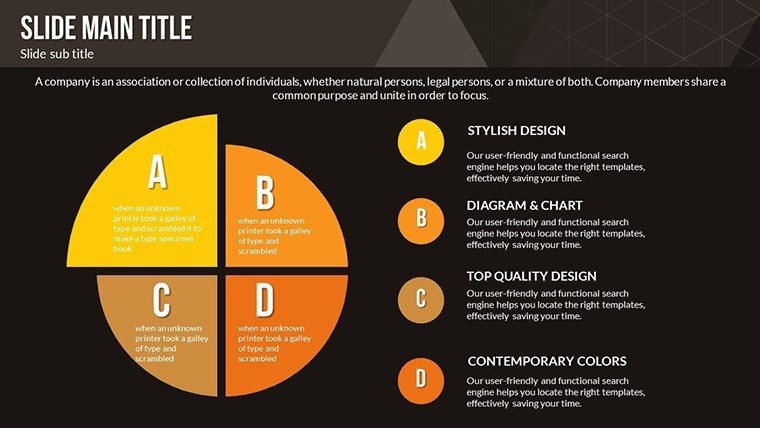
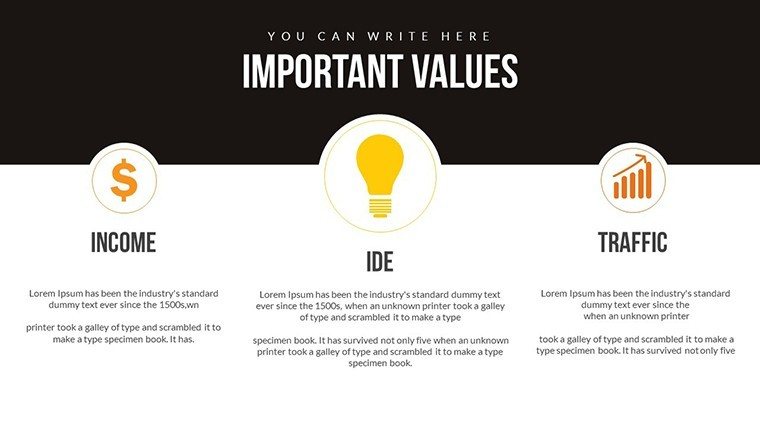
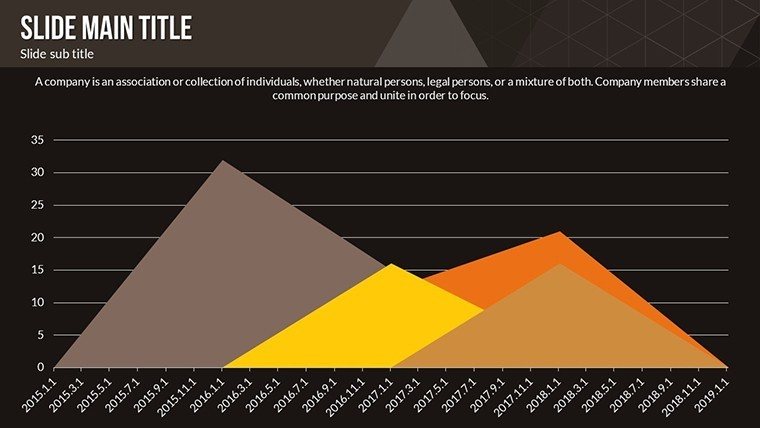
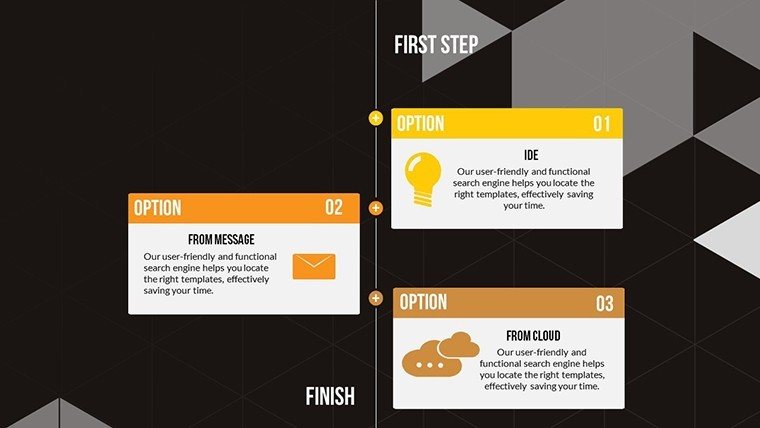
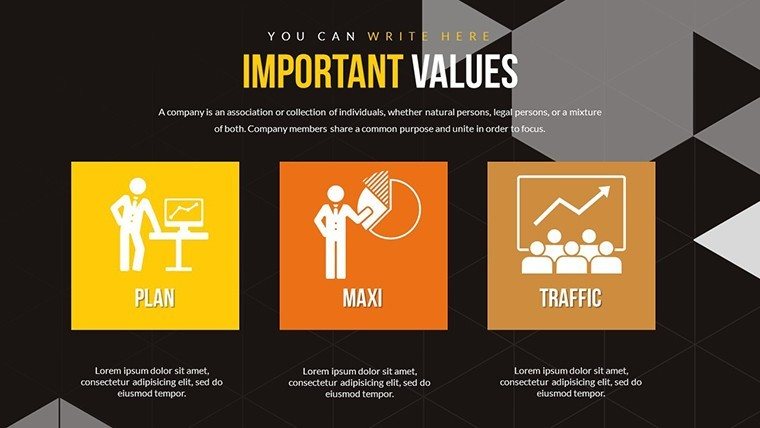
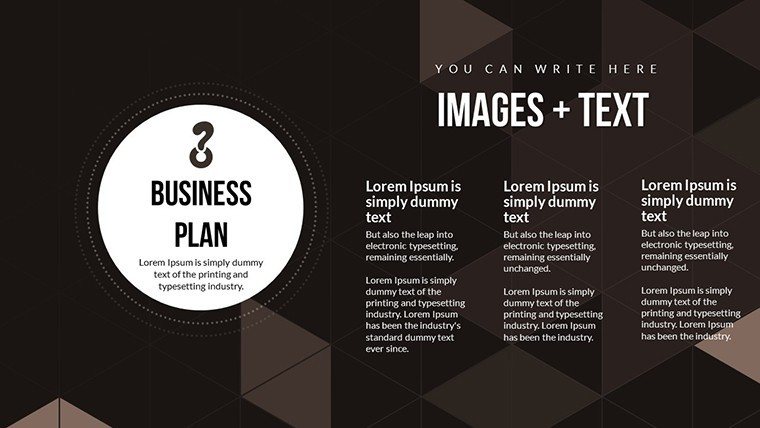
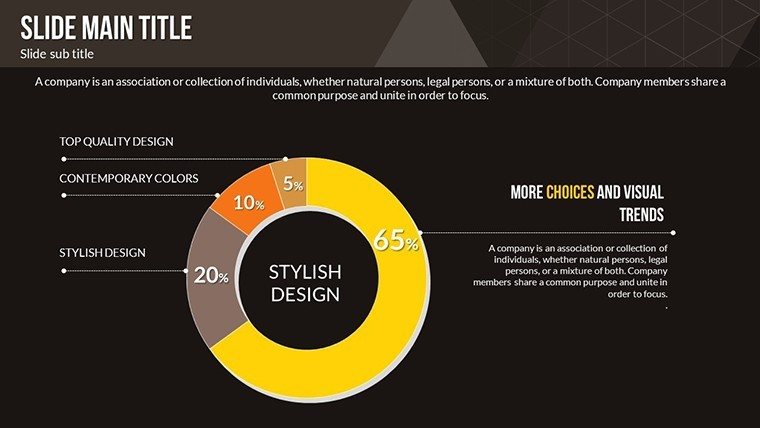
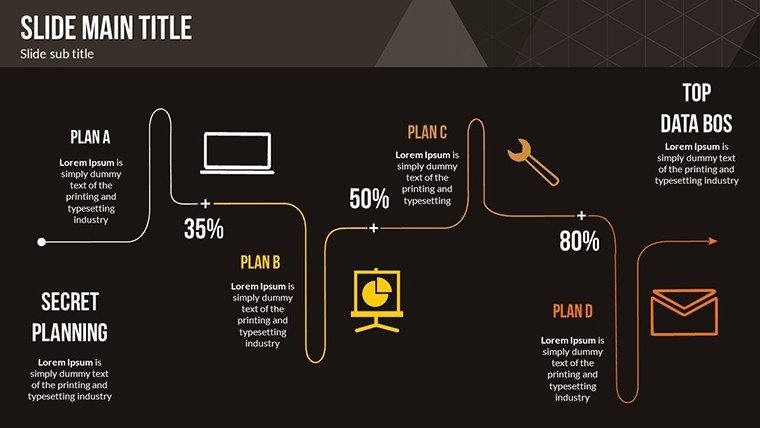
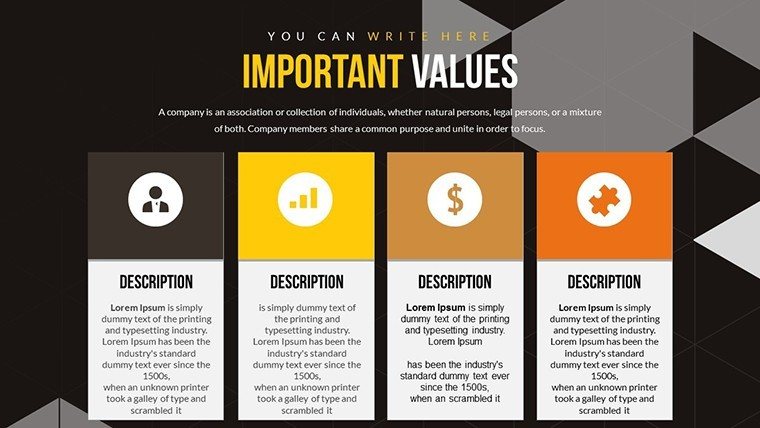
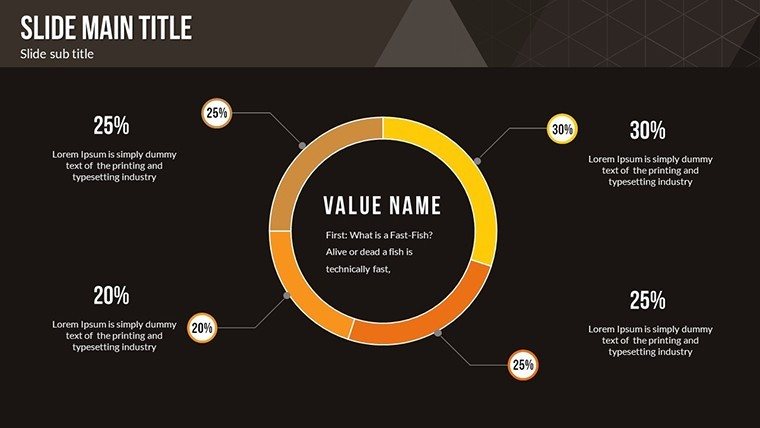
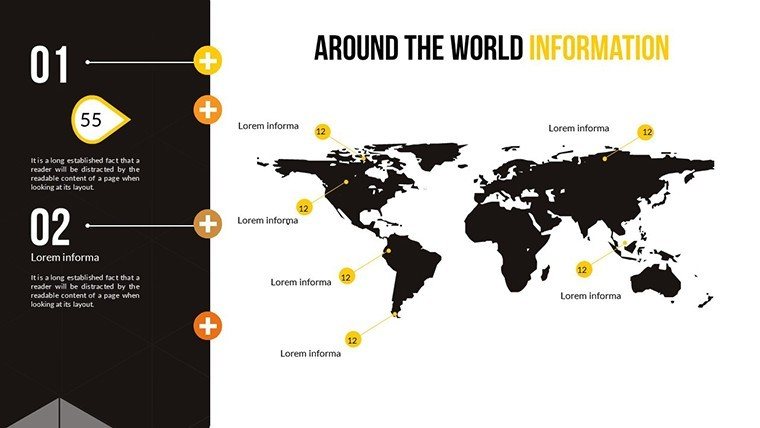
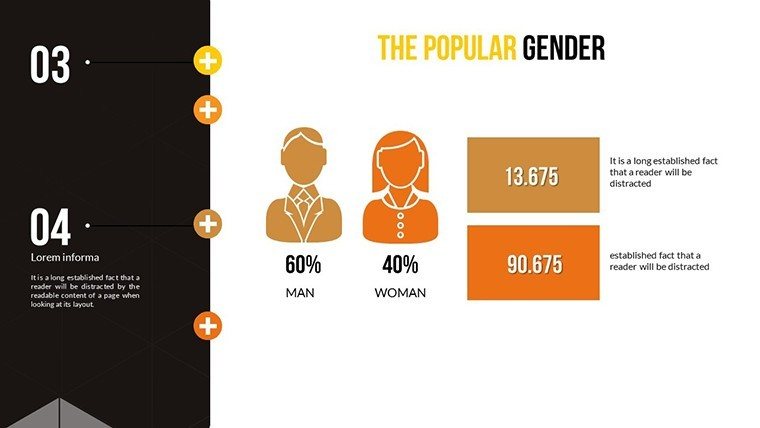
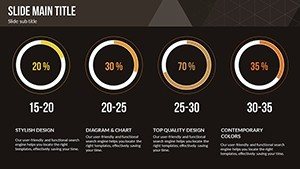
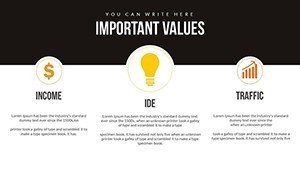
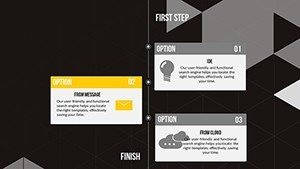
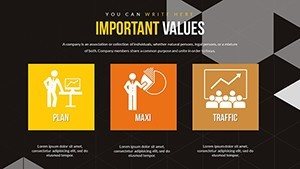
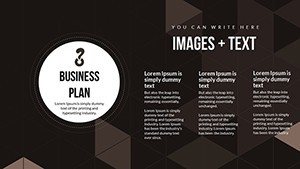
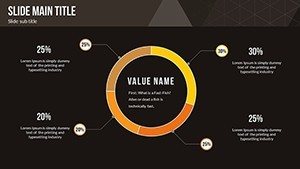
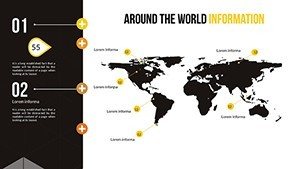
22 fully editable slides arrive in the PPTX file. Bar charts display performance metrics line charts track trends over time pie charts break down resource allocation flowchart slides map workflows timeline charts show Gantt schedules and dashboard summaries tie everything together.
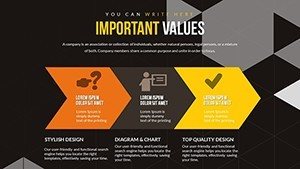
These elements work together for operational strategy communication. Layout composition uses zone segmentation and color contrast to clarify dependencies. Flow direction leads audiences through each step naturally.
Project managers reach for this set when stakeholder meetings require mapped workflows. It transforms abstract ideas into animated narratives better than static alternatives because built-in timeline animation highlights transitions.
Format and Compatibility Details
| Feature | Details |
|---|---|
| Slides / diagrams included | 22 charts including bar line pie flowchart timeline and Gantt types |
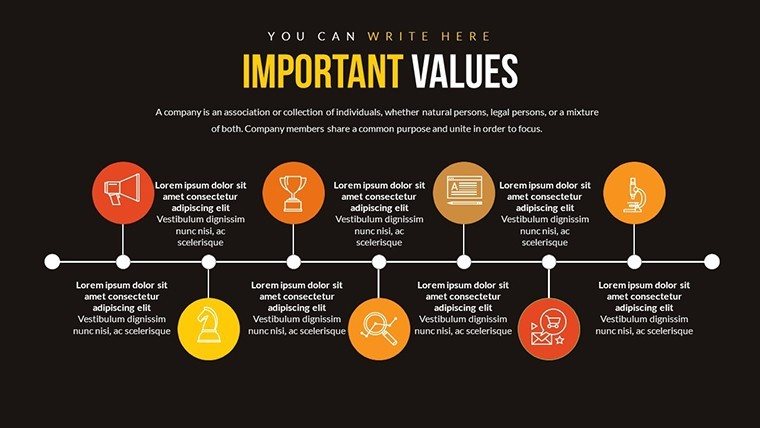
| Diagram categories | Process modeling with timeline focus in the timelines category |
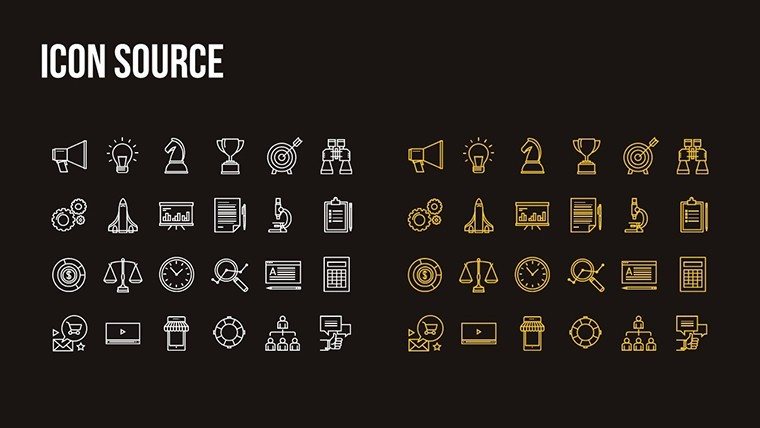
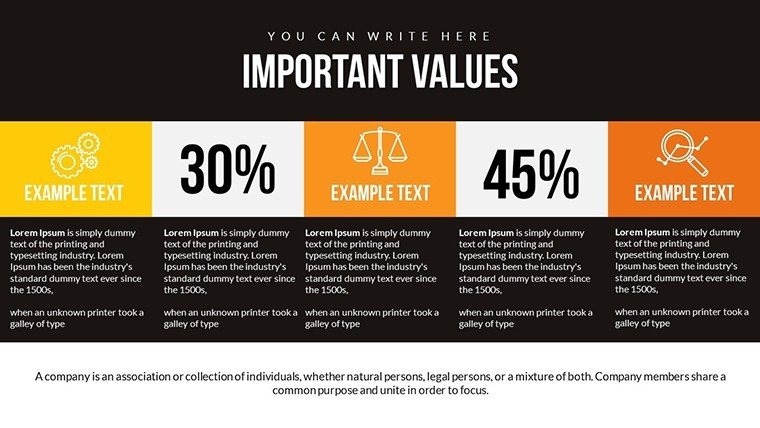
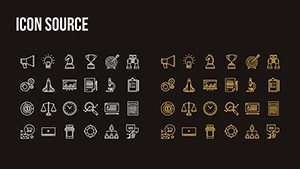
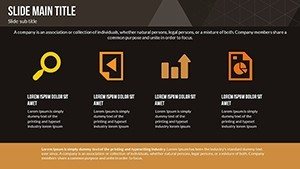
| Editable elements | Data inputs colors fonts sizes icon layers over 50 themed icons diagram connectors |
| Aspect ratio | 16:9 for standard presentation screens |
| PowerPoint compatibility versions | 2016 2019 365 plus Google Slides import |
| Animation support | Built-in sequential effects on timeline and flowchart elements |
Adapting the Template to Your Brand
Moderate skill level users complete adaptation in under 20 minutes.
1. Open the .pptx file in PowerPoint (1 minute)
2. Replace placeholder text with your process steps (3 minutes)
3. Apply brand colors through the slide master palette (2 minutes)
4. Adjust timeline milestones and flowchart connectors (4 minutes)
5. Trigger animations and export as PPTX or PDF (1 minute)
Three Situations Where This Pays Off
A project manager in operations outlines team responsibilities for supply chain efficiency. Gantt timeline animation sequences milestones. Preparation time reduces from three hours to 45 minutes with data swaps only.
Business analysts in consulting adapt the same flowchart file across five consecutive client workshops. Icon layers swap without layout disruption. The deck stays consistent for strategic planning.
Download now for your workflow presentation
Building From Scratch vs. Starting Here
Creating equivalent process diagrams manually takes over four hours and demands advanced design skills in flow direction. Mistakes in zone segmentation appear often during live sessions. The ready file eliminates that risk.
Gantt-like timelines use sequential animation to aid hierarchy perception. Icons over 50 replaceable types clarify dependencies. This layout keeps readability high on projection screens without extra steps. The single purchase covers all 22 slides and animation features.
Get the full set and present with confidence
Which PowerPoint versions are compatible with this template?
The PPTX file opens without issues in PowerPoint 2016 2019 and Microsoft 365 on both Windows and Mac. Google Slides imports the file with full animation support preserved. Subscribers receive immediate access to slide master editing. Test the import in your environment before any training session.
How do I change the color scheme?
Open the slide master view in PowerPoint. Update the theme colors palette to match your brand. All bar line pie and timeline elements inherit the changes automatically. The process applies across every slide in seconds and works the same in Google Slides.
What does the license permit?
The license allows internal use and delivery in paid client work. You may edit and present customized versions to external audiences. Original file resale or sublicensing is not permitted. Teams benefit from the full icon and animation editing freedom.
What file formats are included and which software opens them?
The download is a single PPTX file. PowerPoint 2016 or newer opens it natively while Google Slides provides seamless import. PDF export follows editing for distribution. No additional formats ship with the purchase.
Is animation support available and how do I apply it?
Built-in sequential animations ship on timeline and flowchart slides. Use the animations pane to adjust timing or add emphasis to milestones. Effects bring process steps to life in live meetings. Remove or modify any animation in seconds without affecting the layout.