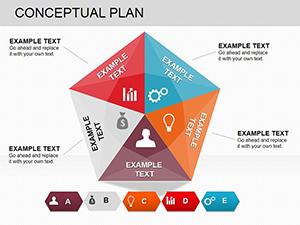
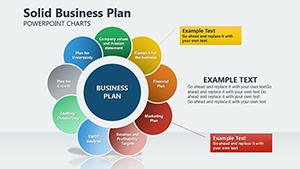
Goals and Opportunities PowerPoint Charts: Chart Your Path to Achievement


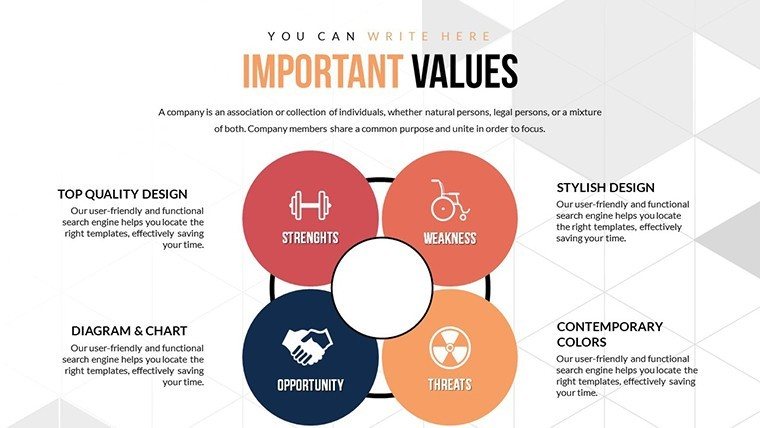


Envision a presentation where your goals align seamlessly with emerging opportunities, captivating stakeholders with clarity and insight. The Goals and Opportunities PowerPoint charts template delivers just that, offering 21 editable slides tailored for puzzle and analysis enthusiasts in business, consulting, and education. This isn't your average slide deck; it's a strategic ally that graphically depicts value dependencies, making complex data relationships crystal clear. Aimed at ambitious professionals like strategists and analysts, it features vibrant color options, animated effects, and vector elements to transform raw data into compelling stories. Tackle challenges such as identifying market gaps or aligning team objectives with these versatile charts, which facilitate effortless comparisons. In corporate planning, for example, visualize how short-term goals feed into long-term opportunities, drawing from real-world scenarios like SWOT analyses in Fortune 500 companies. Fully compatible with PowerPoint and beyond, this template ensures your visions are presented professionally, no matter the platform. Dive into a world where data puzzles solve themselves, empowering you to uncover hidden potentials and drive actionable outcomes.
Exploring Analytical Depth Through Puzzles
When puzzles represent your data, solutions emerge vividly. This template specializes in breaking down goals into analyzable components, using charts that highlight interconnections. For analysts, it's a boon for dissecting opportunity landscapes, perhaps in competitive intelligence reports where dependencies reveal strategic edges.
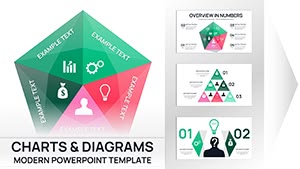
Standout Features for Strategic Mastery
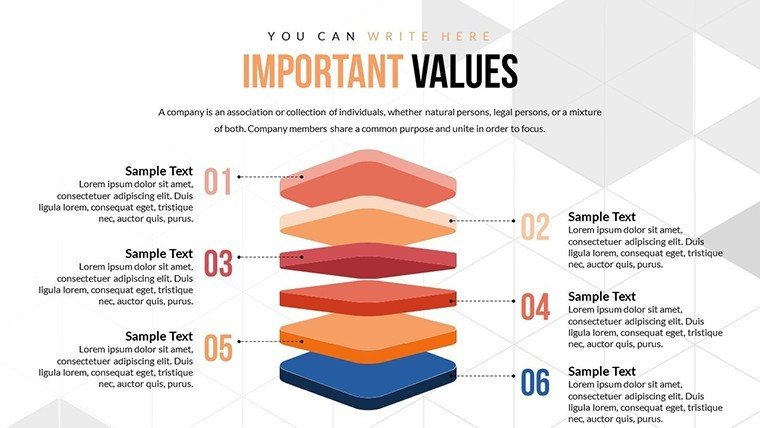
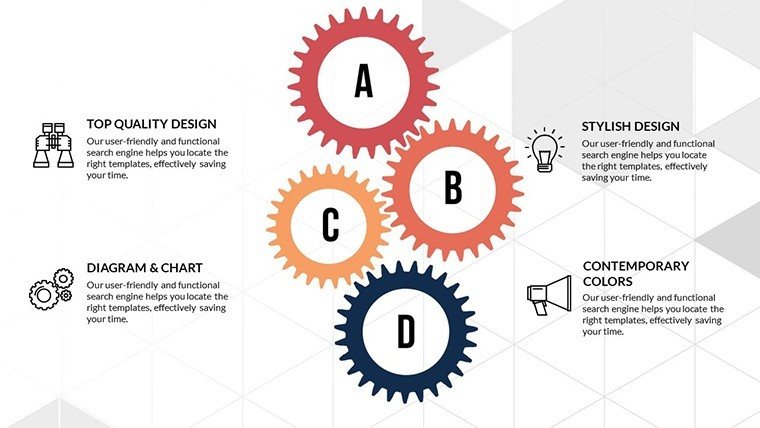
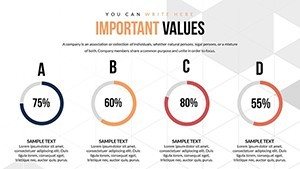
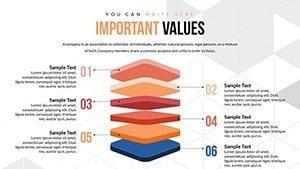
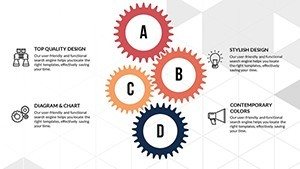
- Animated Puzzles: Dynamic reveals that piece together goals step by step, ideal for interactive sessions.
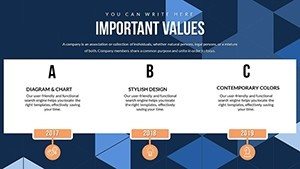
- Color Variations: Adapt palettes to evoke urgency or optimism, aligning with your narrative tone.
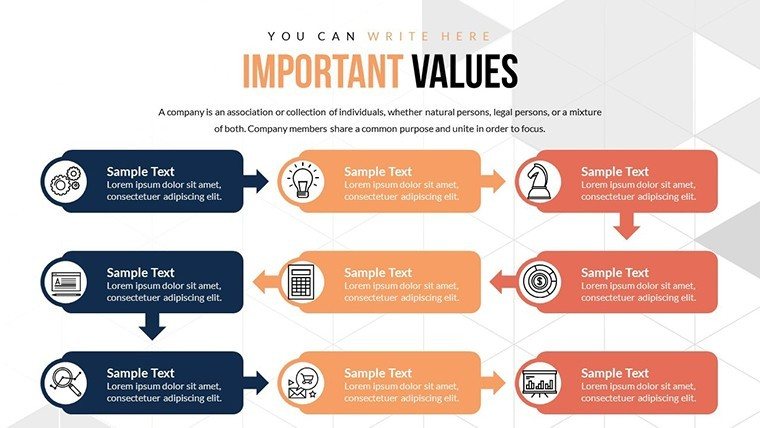
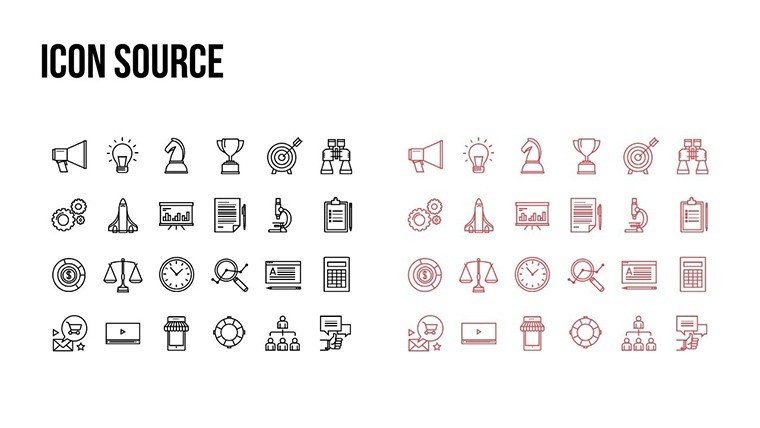
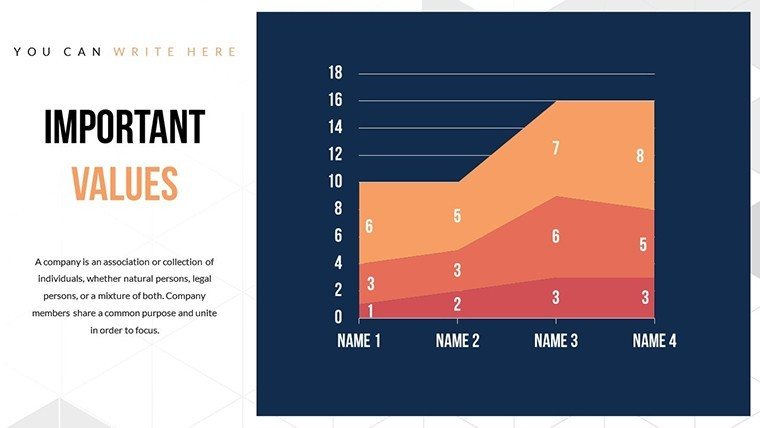
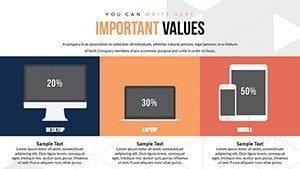
- Editable Text and Icons: Swap in specific metrics or symbols to personalize for your industry.
- High-Resolution Graphics: Ensure sharpness in virtual or in-person presentations.
- Multimedia Support: Incorporate clips of success stories to illustrate opportunity realization.
These elements surpass generic tools by focusing on puzzle-based analysis, streamlining complex evaluations.
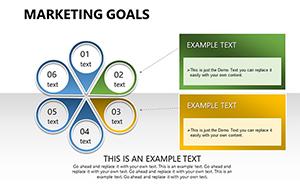
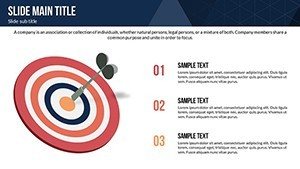
Practical Scenarios: Turning Goals into Reality
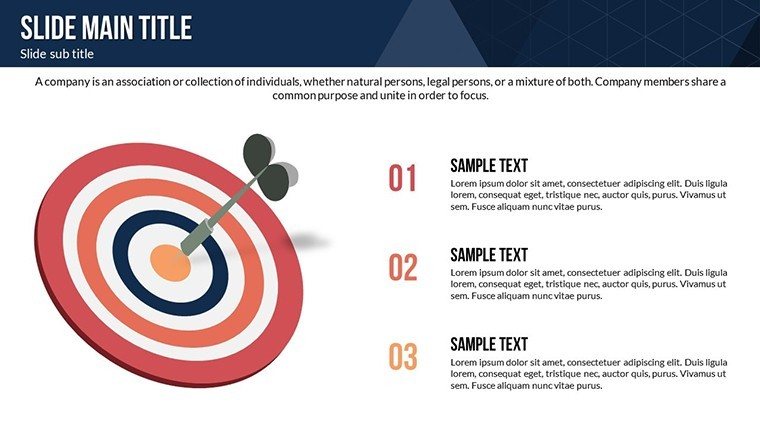
Consider a business development meeting: Employ a puzzle chart to map how individual goals interlock to form broader opportunities, as seen in case studies from consulting firms like McKinsey. Educators might use it to teach goal-setting frameworks, engaging students with visual breakdowns. In sales, compare opportunity pipelines visually, spotting bottlenecks early. Unlike plain charts, the animations here guide focus, enhancing comprehension. Integrate into workflows by linking to data tools like Tableau for real-time updates, ensuring your analyses stay relevant.
Implementing the Template Effectively
- Open the .pptx file and choose an analysis slide.
- Enter your goal metrics and adjust dependencies.
- Apply colors and animations for emphasis.
- Test interactions in slideshow mode.
- Share or present with confidence.
This method addresses common issues like data overload, providing structured clarity.
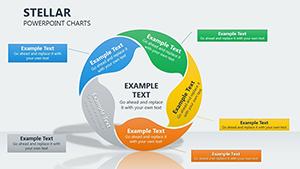
Superior Value in Opportunity Mapping
Outshining basic PowerPoint, this template's puzzle themes offer nuanced insights, like those used in agile methodologies for opportunity sprints. Value lies in efficiency - assemble insightful decks swiftly - and adaptability across sectors. For instance, in nonprofit planning, chart donor goals against program opportunities, inspired by frameworks from Harvard Business Review. Tips include using gradients for priority levels or combining with timelines for phased goals. CTAs like "Pursue this opportunity" embedded in slides spur action. End your deck with a synthesized view, motivating teams toward achievement. Secure your strategic edge now - grab this template and chart tomorrow's successes.
Frequently Asked Questions
What makes these charts suitable for analysis?
They graphically show dependencies, simplifying comparisons in puzzle formats for deeper insights.
Can I customize the animations?
Yes, all effects are editable to fit your presentation pace and style.
Who is the target audience for this template?
Business planners, analysts, and educators focused on goals and opportunities.
Does it support data import?
Absolutely, easily pull in from Excel or other sources for accurate visuals.
How many color options are there?
Multiple variations allow full customization to your branding.