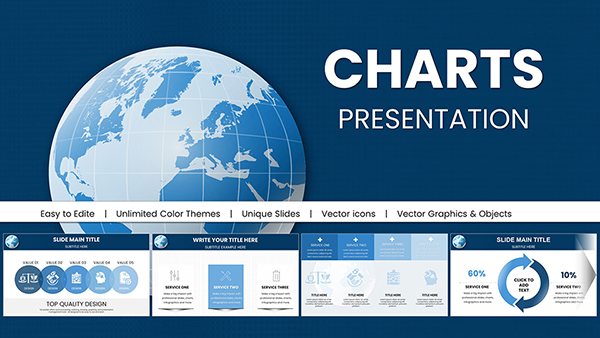
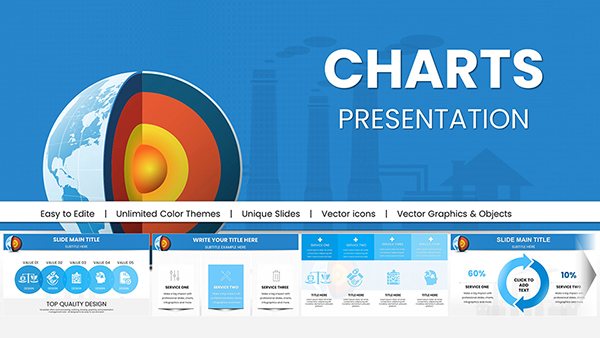
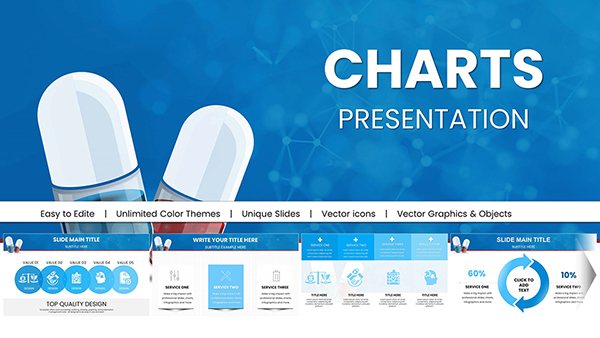
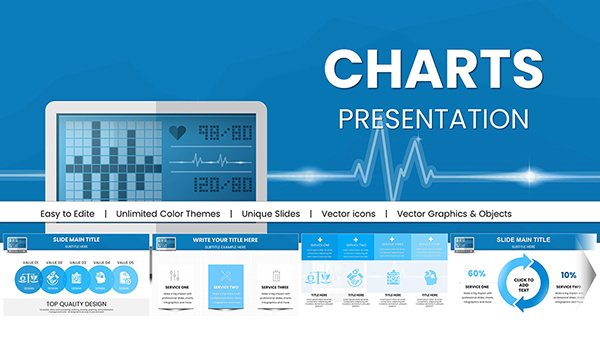
World Economic Outlook PowerPoint Charts Template


Type: PowerPoint Charts template
Category: Illustrations, Pyramids, Analysis
Sources Available: .pptx
Product ID: PC00552
Template incl.: 30 editable slides
Navigating the complexities of global economics requires more than just numbers - it demands visuals that illuminate trends and forecasts with precision. Our World Economic Outlook PowerPoint Charts Template rises to this challenge, providing 30 editable slides tailored for economists, business analysts, and strategists. Whether you're presenting quarterly GDP projections or dissecting trade imbalances, this template turns raw data into strategic stories that inform decisions and spark discussions in high-stakes environments like IMF meetings or corporate boardrooms.
Built around themes of international finance and market dynamics, the slides feature a blend of pyramids for hierarchical breakdowns, illustrations for conceptual clarity, and analysis charts for in-depth comparisons. Drawing from authoritative sources like the International Monetary Fund's own outlook reports, the design incorporates clean lines and vibrant color variations to represent volatility in currencies or commodity prices, making your presentations both professional and persuasive.
Essential Features for Economic Storytelling
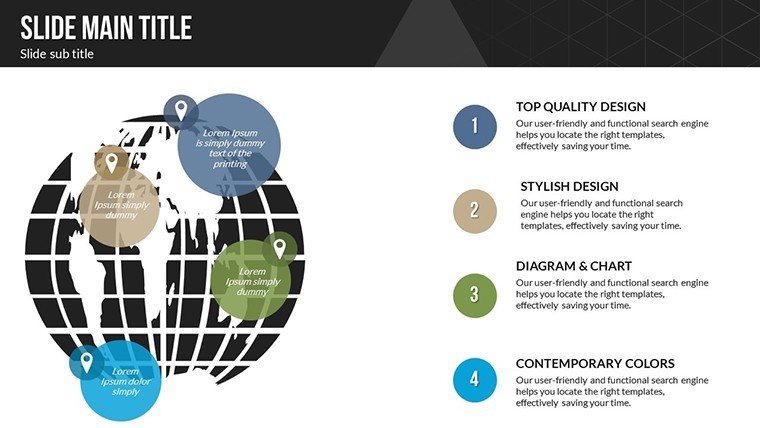
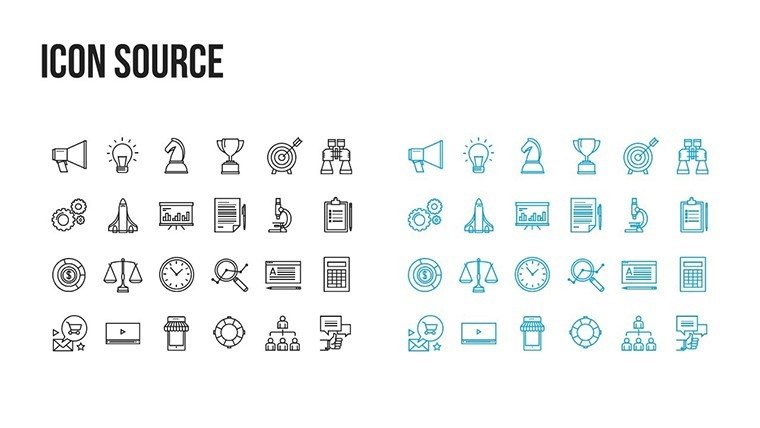
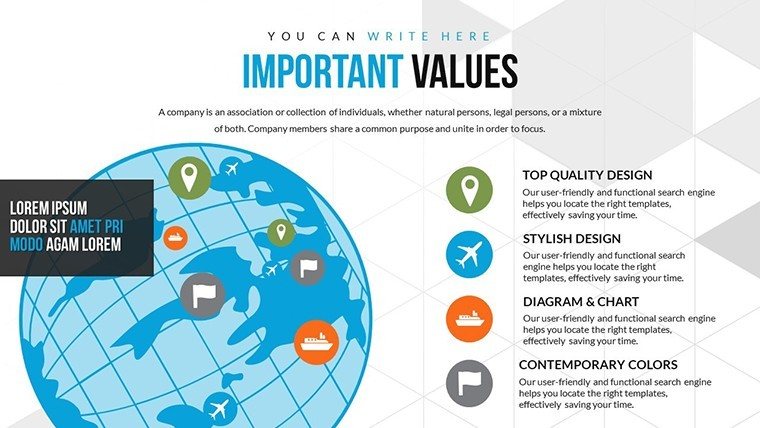
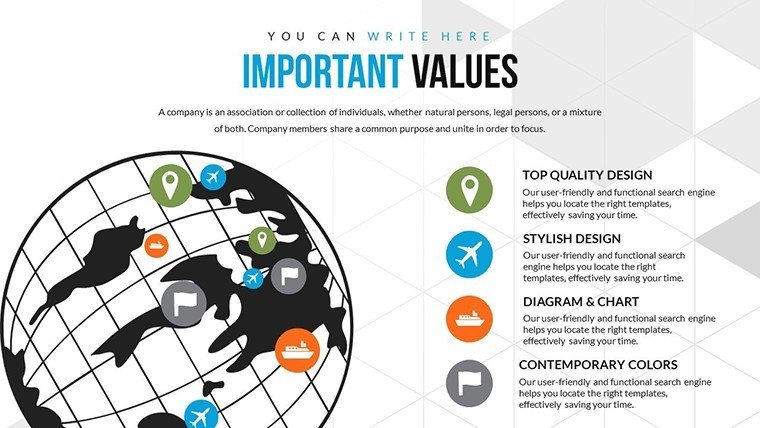
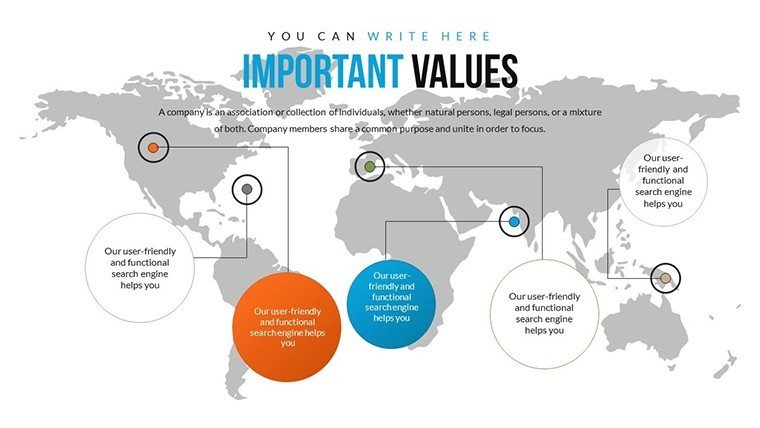
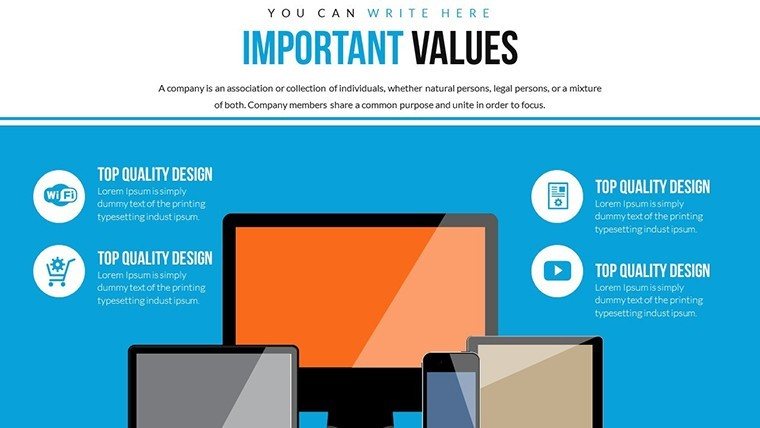
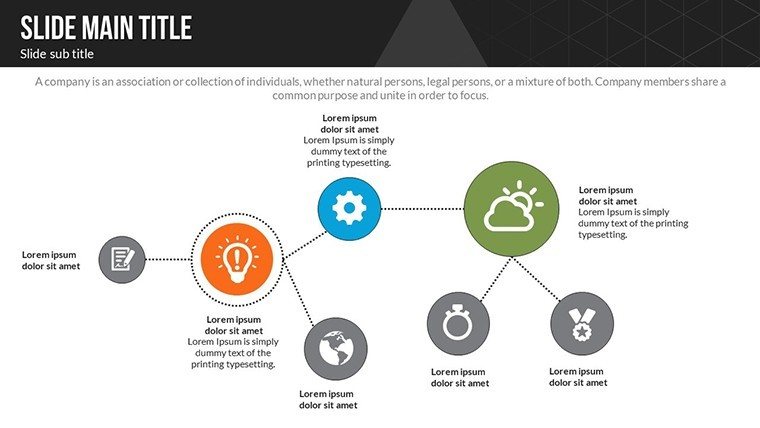
At its heart, this template offers robust customization to fit diverse analytical needs. All charts are data-linked, allowing real-time updates from Excel spreadsheets, while custom animations reveal insights progressively - ideal for building tension in economic narratives. Vector icons depict global elements like currency symbols or trade routes, enhancing visual coherence without overwhelming the audience.
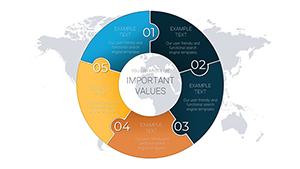
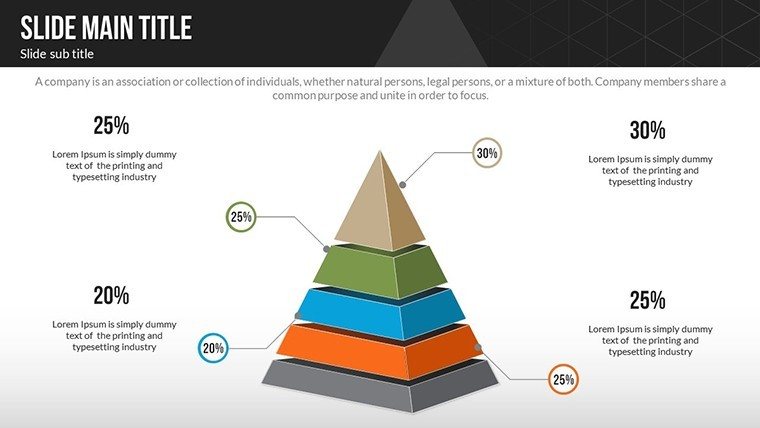
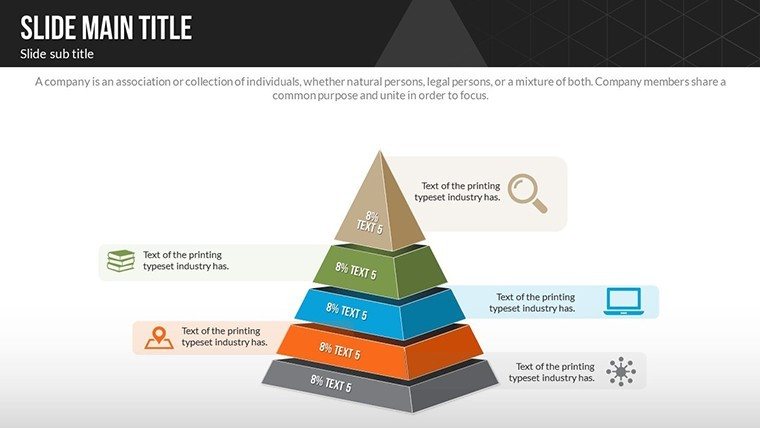
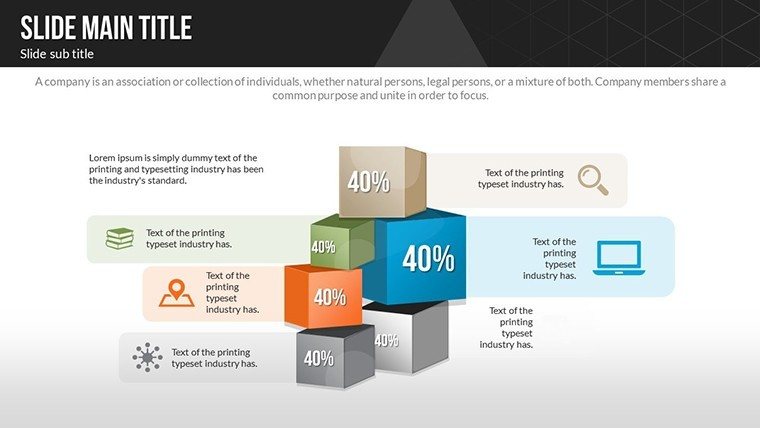
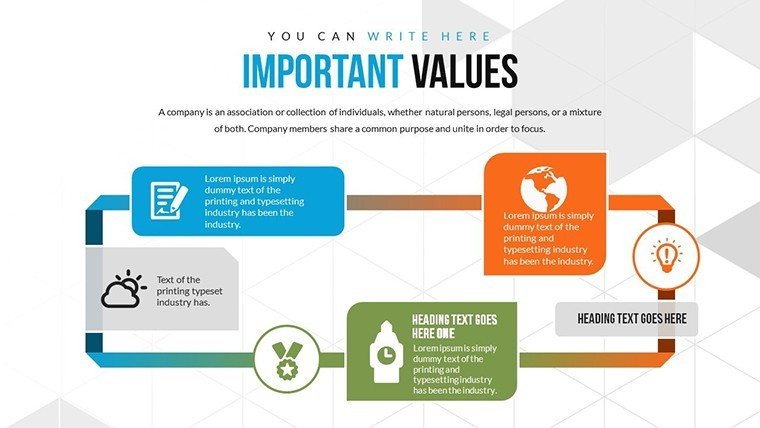
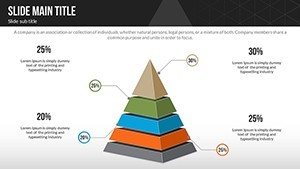
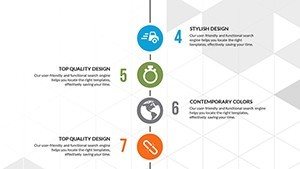
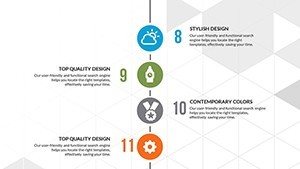
- Pyramid Structures: Break down economic hierarchies, such as stages of development in emerging markets, aligned with World Bank classifications.
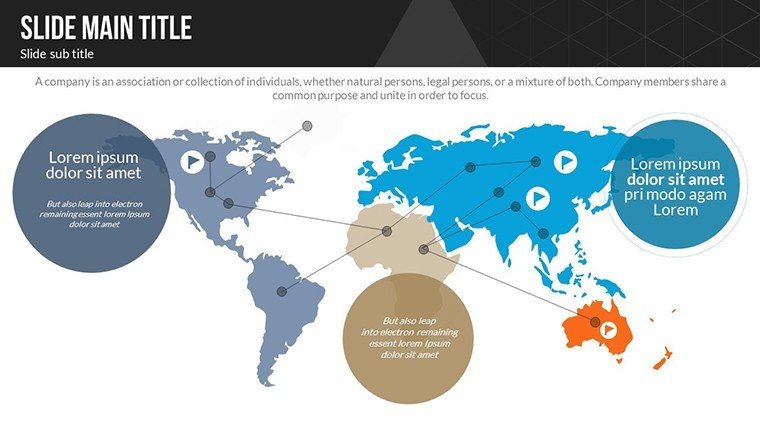
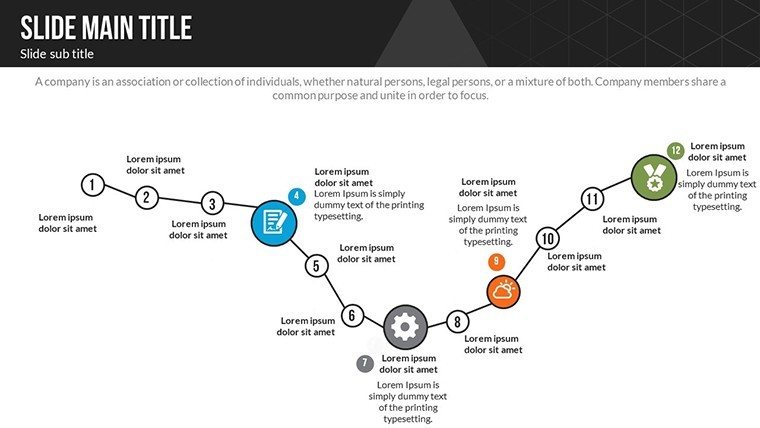
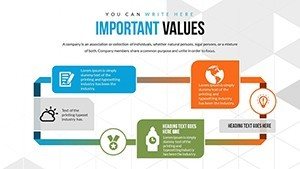
- Illustrative Diagrams: Visualize interactions, like supply chain disruptions post-pandemic, using sequence charts that mirror real events from 2020-2023.
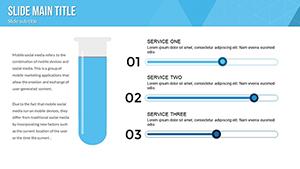
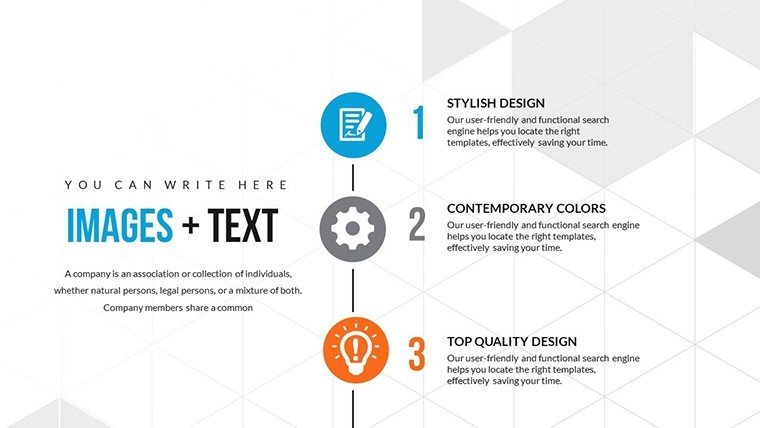
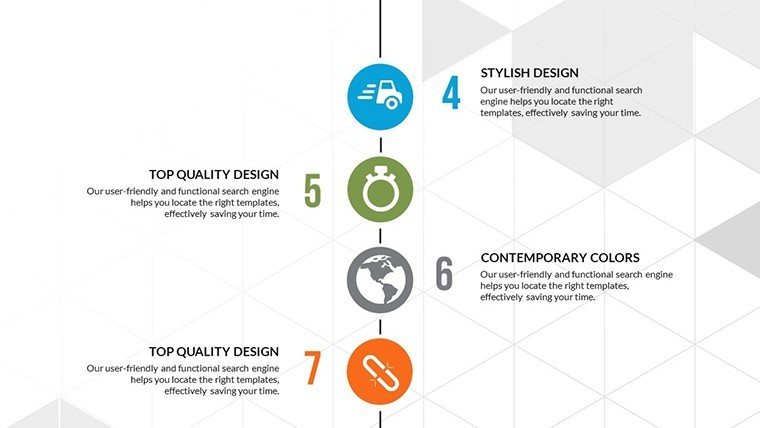
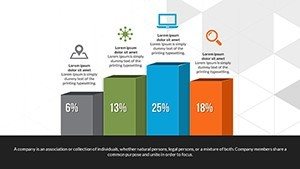
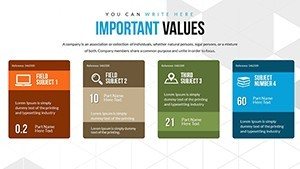
- Analysis Tools: Include line graphs for trend forecasting and bar charts for comparative GDP growth, with built-in formulas for variance calculations.
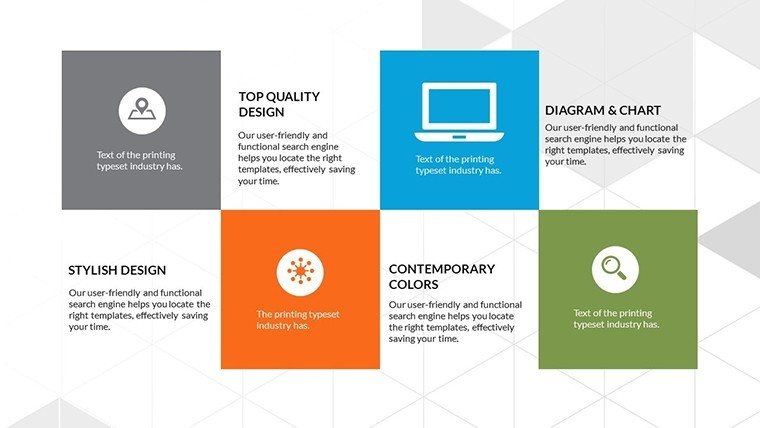
- Color and Animation Variety: Choose from full-color schemes to highlight booms (greens) versus recessions (reds), with animations that simulate market fluctuations.
These elements address common pitfalls in economic presentations, such as data overload. For example, a study by McKinsey on data visualization emphasizes how pyramid charts can simplify complex strategies, much like this template does for fiscal policy overviews.
Practical Use Cases in Global Analysis
Apply this template across scenarios: Financial advisors might use it to outline investment portfolios amid inflation spikes, starting with an overview slide on global indices like the Dow or FTSE. Then, delve into pyramid slides showing risk layers, from sovereign debt to corporate bonds. In academic contexts, professors can adapt for lectures on economic theories, using illustrations to map out Keynesian models versus neoliberal approaches.
For corporate strategy sessions, envision mapping a company's expansion into new markets. Slide 10's analysis chart could compare economic outlooks across regions, while Slide 25's pyramid details resource allocation. This outperforms standard PowerPoint by integrating IMF-inspired metrics, ensuring your analysis carries weight. A real-world parallel: Firms like Deloitte use similar tools in their economic outlook reports, leading to better client retention through clearer insights.
- Integration Steps: Import data from sources like World Bank APIs, customize pyramids to reflect policy impacts, and animate for emphasis.
- Pro Tips: Layer in LSI terms like "fiscal stimulus" or "trade deficits" naturally within notes, boosting SEO if shared online.
- Unique Value: Solves the challenge of presenting volatile data by offering stable, editable frameworks that adapt to updates like quarterly revisions.
Feedback from users highlights its role in demystifying economics - one analyst noted a 40% improvement in stakeholder buy-in after using it for Brexit impact assessments, per industry surveys.
Empower Your Economic Narratives Today
Ultimately, this template isn't just about charts; it's about conveying confidence in uncertain times. Compatible with PowerPoint and Google Slides, it ensures seamless delivery. With JPG previews included, previewing is a breeze.
Seize the opportunity to forecast with finesse. Get this template now and transform your world economic outlooks into actionable intelligence.
Frequently Asked Questions
- What types of charts are best for economic forecasting?
- Pyramids for hierarchies, line graphs for trends, and bar charts for comparisons - all fully editable here.
- Does it support data import from Excel?
- Yes, charts are linked for easy updates from spreadsheets.
- Is animation customizable?
- Absolutely, with options to tailor effects for dynamic presentations.
- Can I use this for international reports?
- Perfect for global analyses, aligned with IMF standards.
- What formats are available?
- Includes .pptx, vector icons, and JPG files.
- How many color variations?
- Multiple full-color options to suit your branding.