Mastering Data Management with Advanced PowerPoint Charts


In today's data-driven landscape, where information overload can hinder decision-making, a robust Master Data Management (MDM) strategy is essential for organizations aiming to thrive. Our Master Data Management PowerPoint Charts Template steps in as your ally, featuring 27 meticulously crafted, editable slides focused on matrix and pyramid structures. Ideal for IT managers, data analysts, and C-suite executives, this tool helps you visualize complex data hierarchies, relationships, and progressions with ease. From depicting governance frameworks to illustrating data quality pyramids, these charts turn abstract concepts into tangible visuals that foster understanding and alignment across teams. Fully compatible with PowerPoint and Google Slides, it offers seamless edits, ensuring your presentations reflect precision and professionalism. Whether tackling enterprise-wide data integration or presenting audit results, this template addresses key pain points like silos and inaccuracies, empowering you to drive data maturity and operational excellence in your firm.
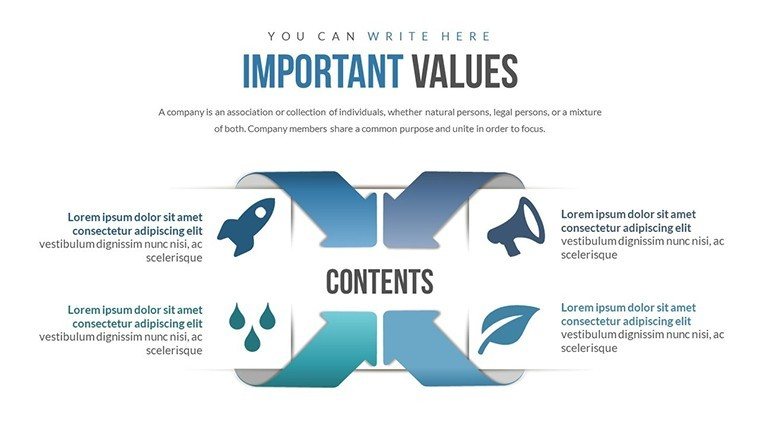
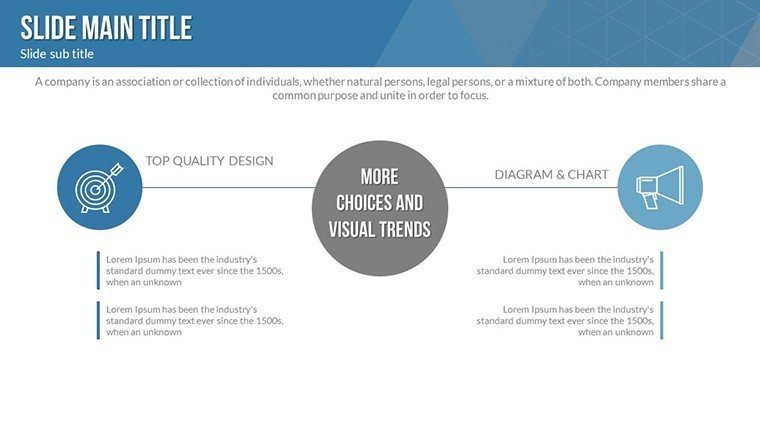
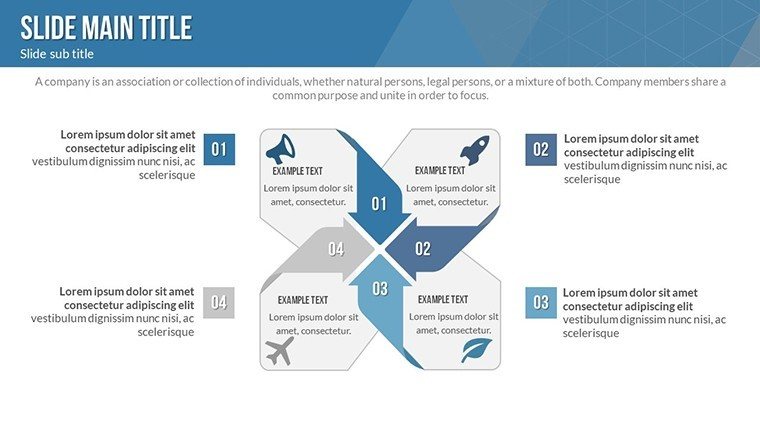
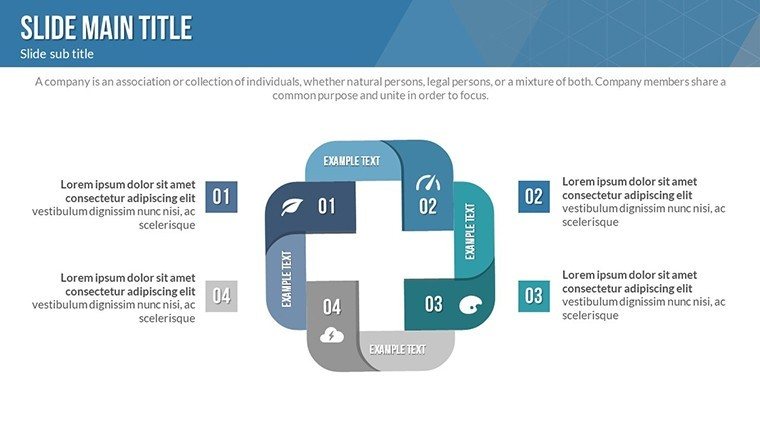
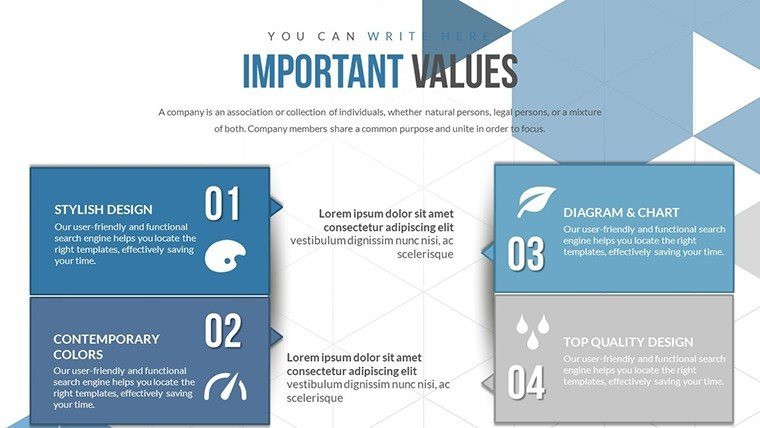
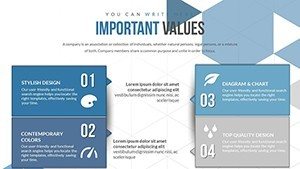
Exploring Matrix Charts for Data Relationships
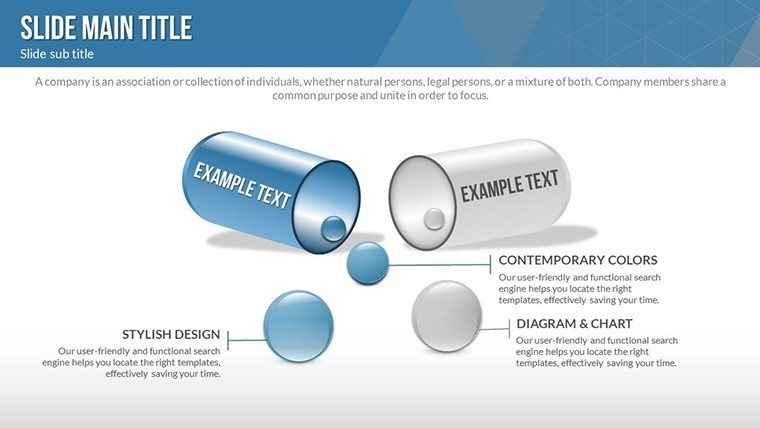
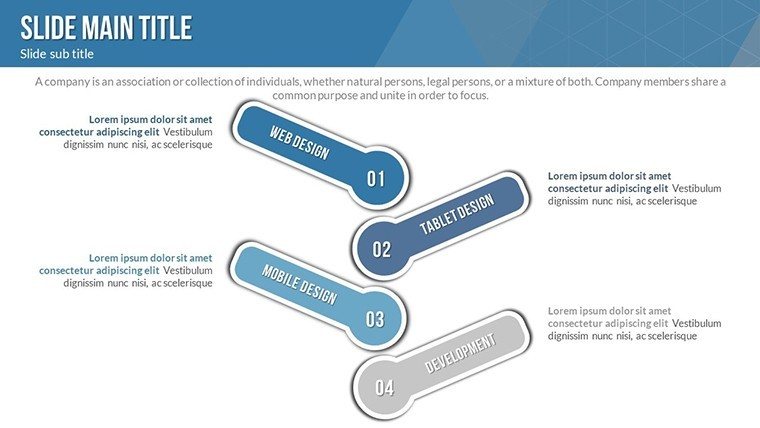
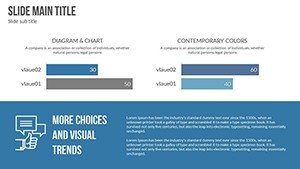
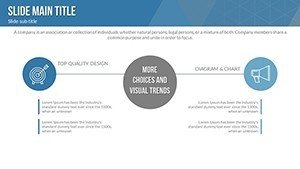
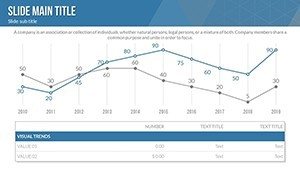
Matrix charts excel at showcasing multidimensional data, making them indispensable for MDM presentations. This template includes slides with customizable grids where rows and columns intersect to highlight correlations, such as product attributes versus customer segments. Edit cell colors to denote priority levels - red for high-risk data inconsistencies, green for validated entries - and add labels for clarity. The benefits are profound: matrices simplify comparisons, revealing patterns that might otherwise go unnoticed. Consider a retail giant using these charts to map inventory data across suppliers; as per Gartner reports, such visualizations reduced errors by 25%. By incorporating icons like locks for secure data or clouds for cloud-based storage, you enhance engagement while demonstrating expertise in data stewardship. This user-centric design not only saves time but also aligns with standards from DAMA (Data Management Association), boosting your presentation's authoritativeness.
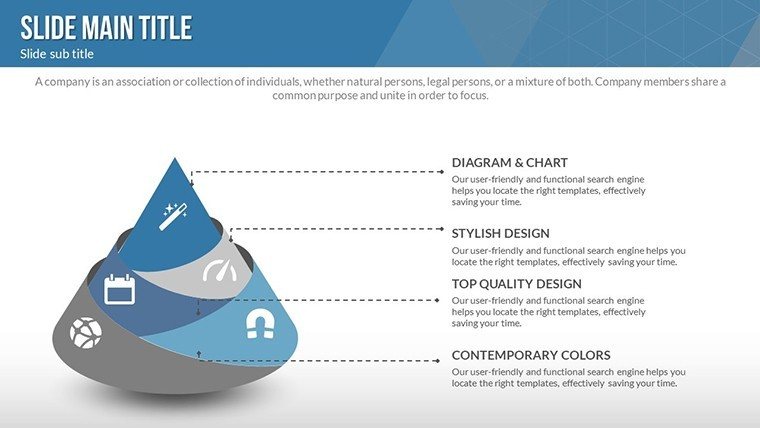
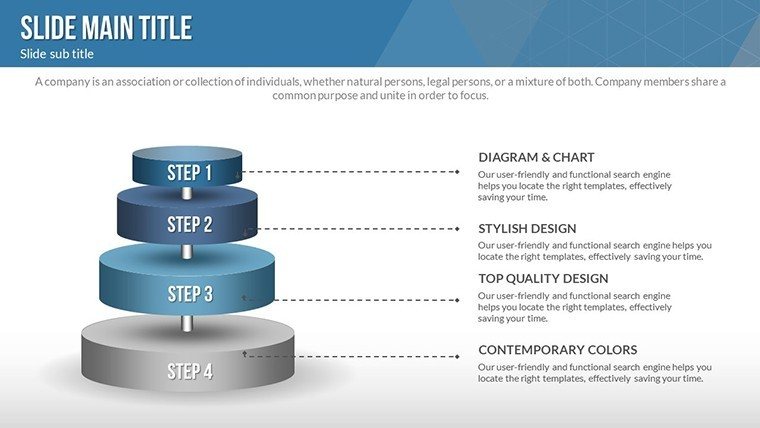
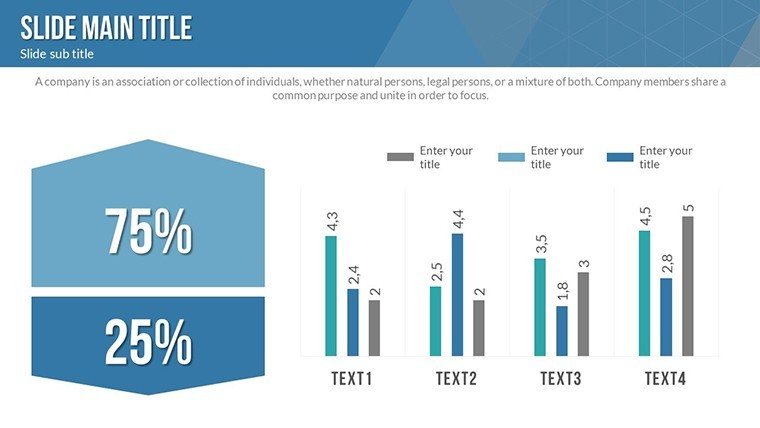
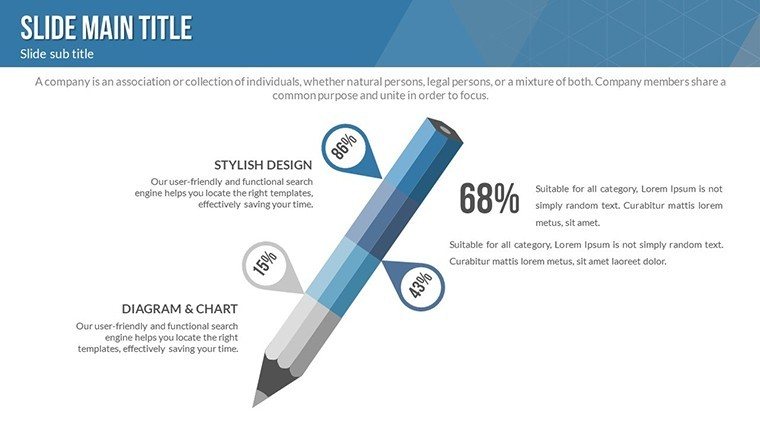
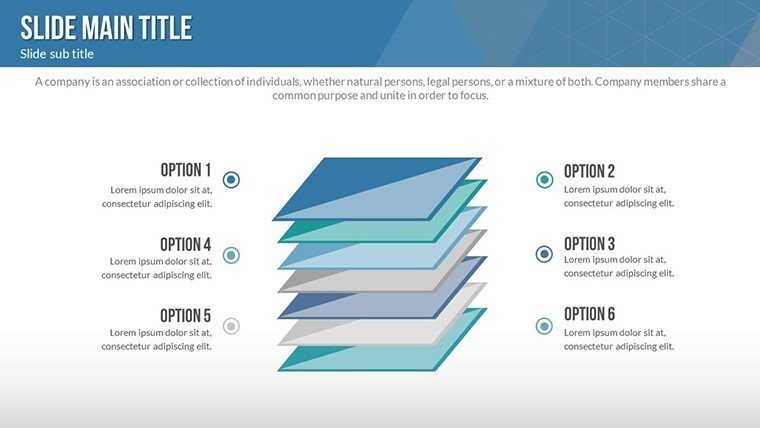
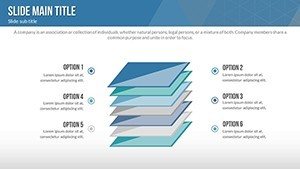
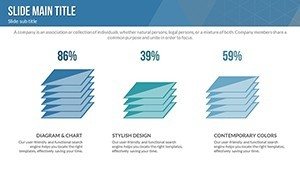
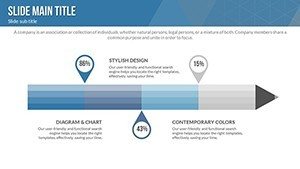
Building Hierarchies with Pyramid Slides
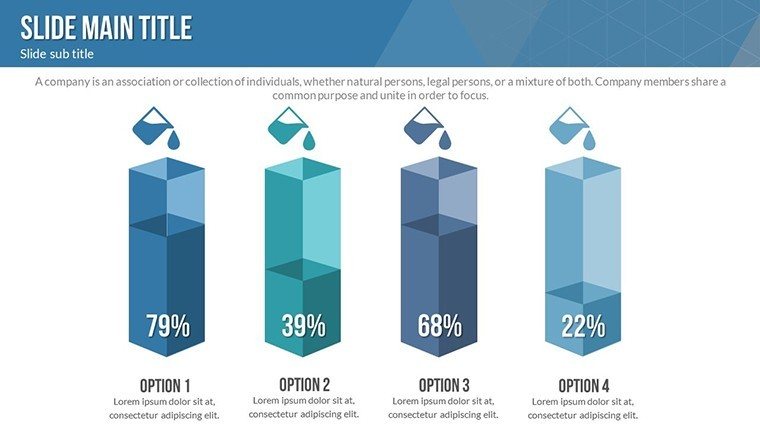
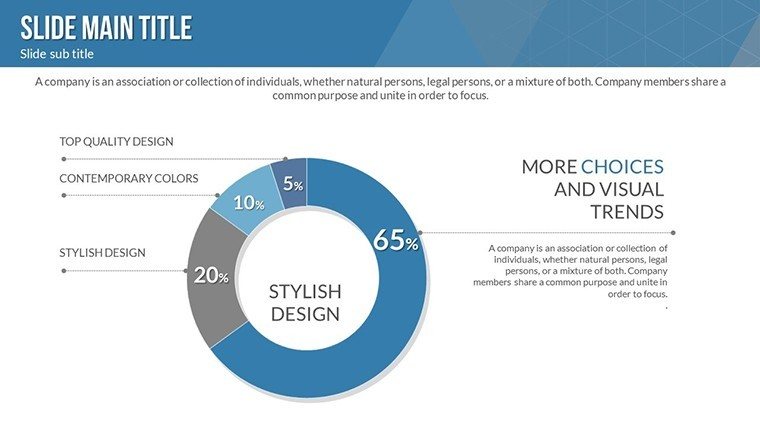
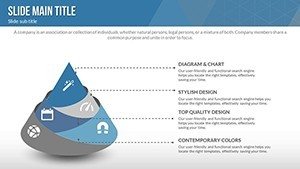
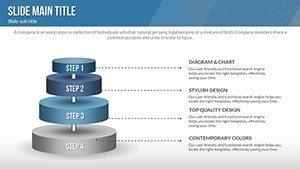
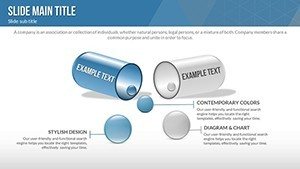
Pyramids represent hierarchical structures perfectly, from data maturity levels to organizational data flows. Our slides feature layered pyramids where base levels can detail raw data sources, ascending to apexes of integrated insights. Fully editable, you can adjust layer sizes, insert metrics like completeness percentages, or apply gradients for visual depth. This format solves the challenge of conveying progression in MDM journeys, making it easier for audiences to follow from foundational elements to strategic outcomes. In healthcare scenarios, for example, pyramids have illustrated patient data hierarchies, aiding compliance with HIPAA, as seen in case studies from HIMSS. Benefits include improved retention of information through visual metaphors, encouraging stakeholders to adopt recommended practices. With animations that build layers sequentially, your narrative unfolds dynamically, turning static data into a compelling story of transformation.
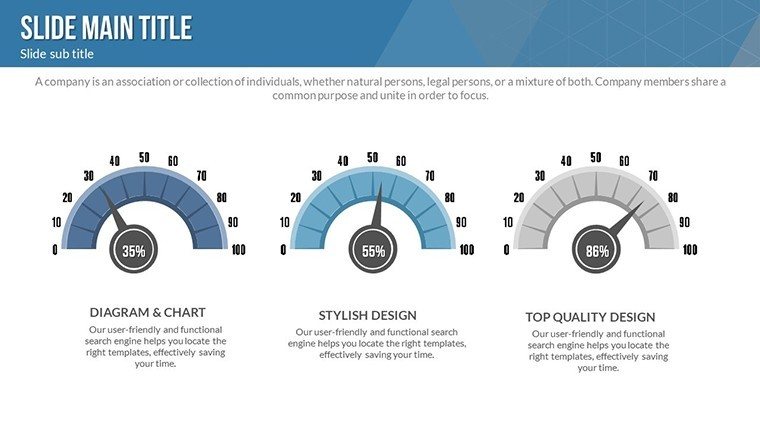
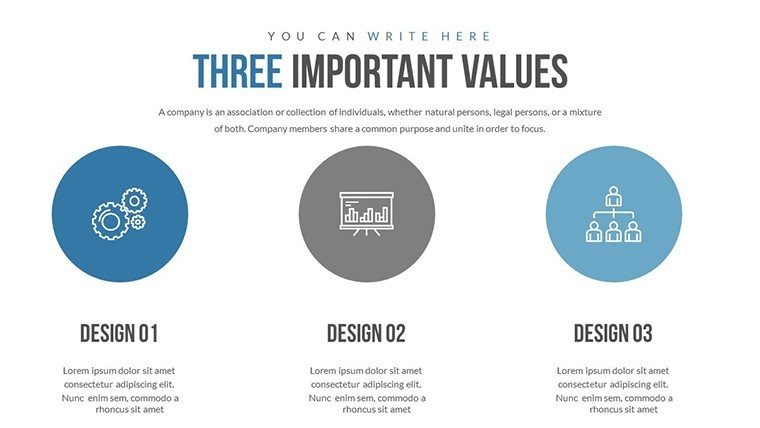
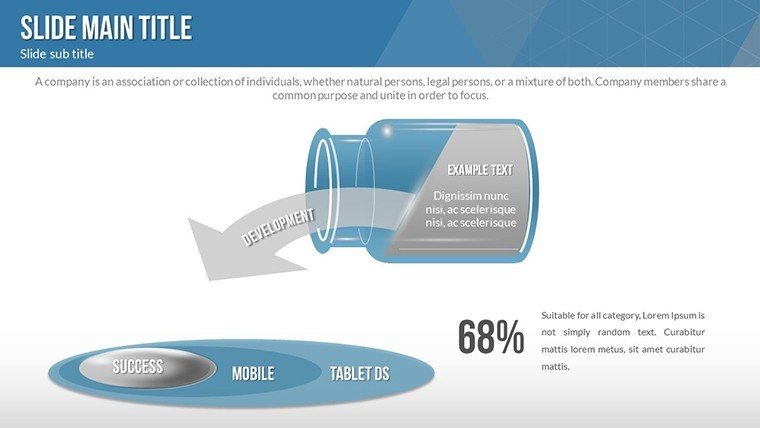
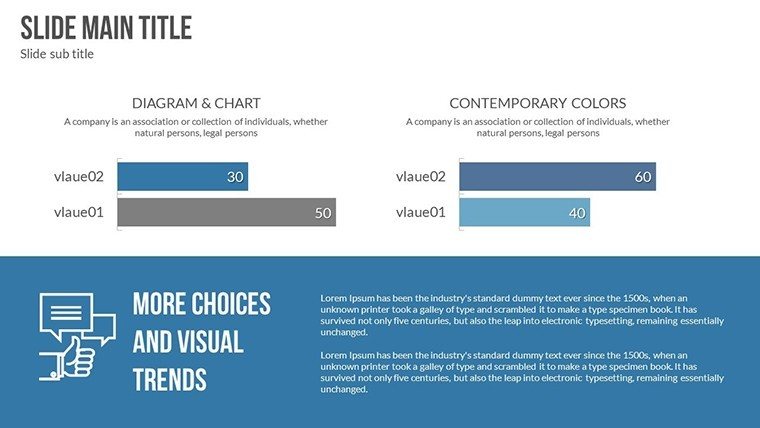
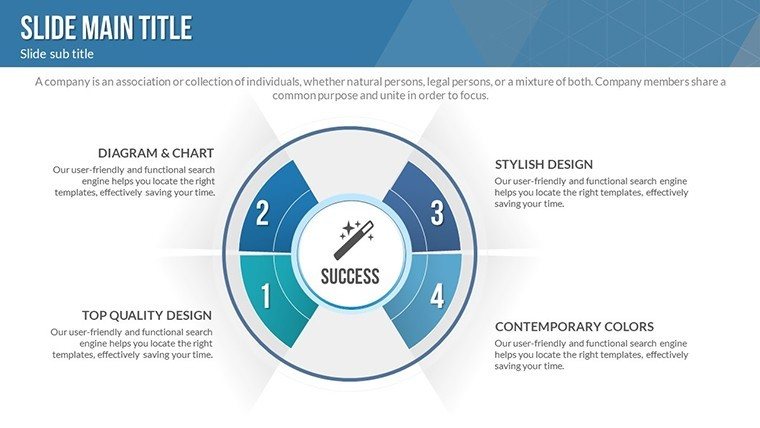
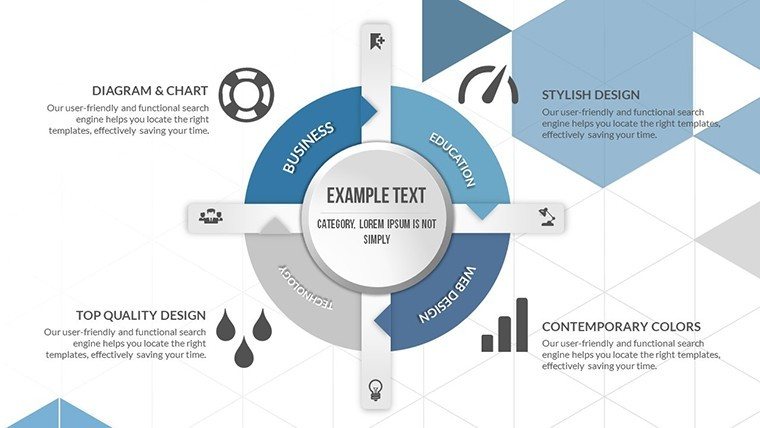
Integrating Features for Seamless Data Visualization
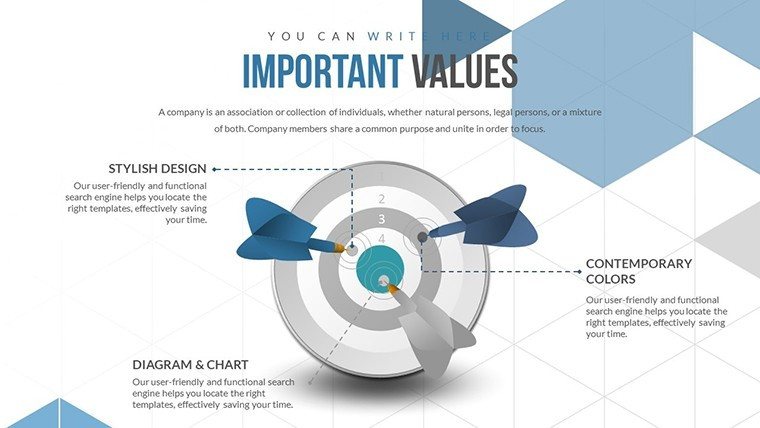
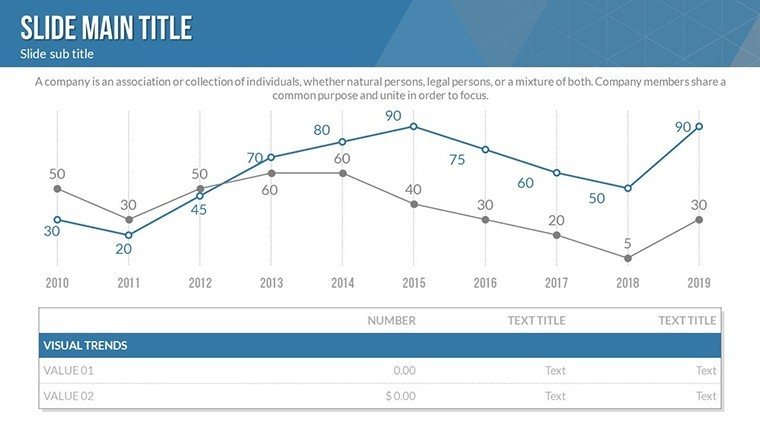
This template goes beyond basic charts by embedding features like custom animations and vector icons, allowing you to animate data flows in matrices or reveal pyramid tiers progressively. High-quality inscriptions ensure legibility, even in large venues, while easy color changes let you match corporate branding effortlessly. For data professionals, inserting video clips of MDM tools in action or audio narrations adds depth, expanding presentation possibilities. Use cases span from boardroom strategy sessions, where matrices outline data governance, to training workshops demonstrating pyramid-based maturity models. Drawing on real-world applications, like a financial firm's use of similar templates to visualize risk matrices (inspired by ISO 31000 standards), you'll see tangible ROI through faster consensus-building. The .pptx format ensures compatibility, while included JPGs facilitate sharing snippets in reports, addressing diverse user needs for flexibility and impact.
Practical Tips and Workflow Enhancements
To leverage this template fully, begin by outlining your MDM objectives - perhaps using a pyramid slide to structure your agenda. Import data from sources like SQL databases into matrices for live demos, then refine with bold fonts for key insights. Tips include using contrasting colors for accessibility, per WCAG guidelines, and layering animations to avoid overwhelming viewers. In agile data teams, collaborate via shared drives, editing pyramids to reflect sprint outcomes. A case from Deloitte highlights how matrix visualizations streamlined merger data integrations, cutting timelines by weeks. These insights, grounded in industry best practices, position you as an authority, while the template's design minimizes technical hurdles, focusing efforts on content over creation.
Elevating Your Data Narratives Today
Choosing this Master Data Management PowerPoint Charts Template means investing in clarity and conviction. With 27 slides blending matrices and pyramids, it caters to nuanced data stories, far surpassing default tools. Benefits like reduced preparation time and enhanced audience engagement translate to better business outcomes, as evidenced by studies from Forrester on visual aids. Whether for internal audits or client pitches, its adaptability shines, incorporating LSI terms like data lineage and governance frameworks naturally. End your sessions on a high note by customizing a final slide with calls to action, reinforced by trustworthy elements like embedded references. Don't let data complexities hold you back - harness this template to illuminate paths forward, fostering a culture of informed decision-making. Step up your MDM presentations now and unlock new levels of strategic success.
Frequently Asked Questions
- How customizable are the matrix charts?
- Extremely - edit grids, colors, texts, and add data points effortlessly in PowerPoint for tailored MDM visuals.
- Does the template support animations for pyramids?
- Yes, pre-built custom effects allow sequential reveals, enhancing hierarchical data presentations.
- Can I insert external data into the slides?
- Certainly; link or embed from Excel or databases for dynamic, up-to-date charts.
- Is it suitable for beginner data analysts?
- Absolutely, with user-friendly interfaces and intuitive edits, no advanced skills required.
- What industries benefit most from this template?
- Finance, healthcare, retail - any sector relying on robust data management strategies.