Streamline Processes with Timeline PowerPoint Charts


Navigating complex processes and timelines in presentations can feel like herding cats, but our Processing Timeline PowerPoint Charts Template changes the game. With 16 editable slides dedicated to process flows and chronological timelines, this resource is a boon for project managers, educators, and executives who need to convey sequences with crystal clarity. Picture mapping out a product launch from concept to market, or detailing a project's phases with interactive milestones - all customizable to fit your story. Compatible with PowerPoint and Google Slides, it offers intuitive edits, turning hours of design work into minutes. This template addresses user frustrations with vague timelines by providing strategic mappings and data visuals that engage and inform. Whether updating stakeholders on progress or teaching historical events, it elevates your delivery, drawing on visualization best practices to ensure your message lands with lasting impact.
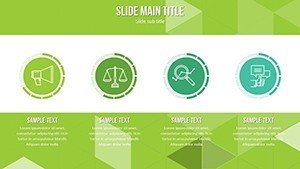
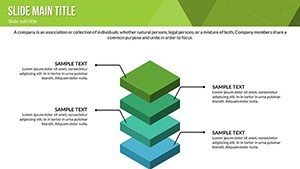
Crafting Dynamic Process Flows
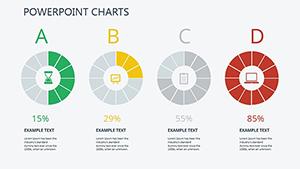
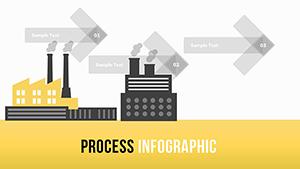
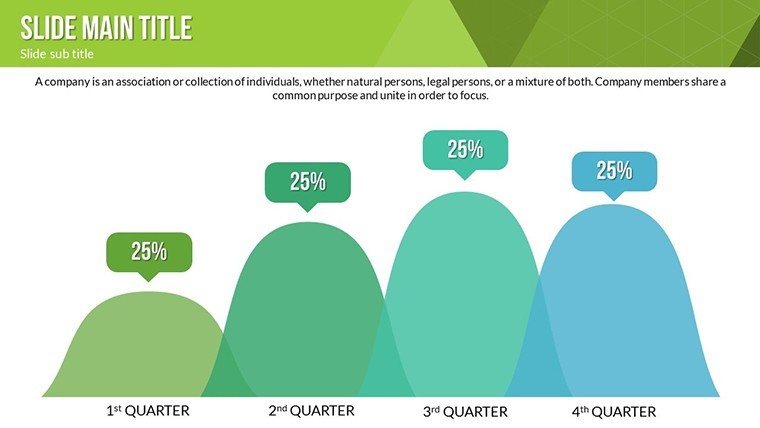
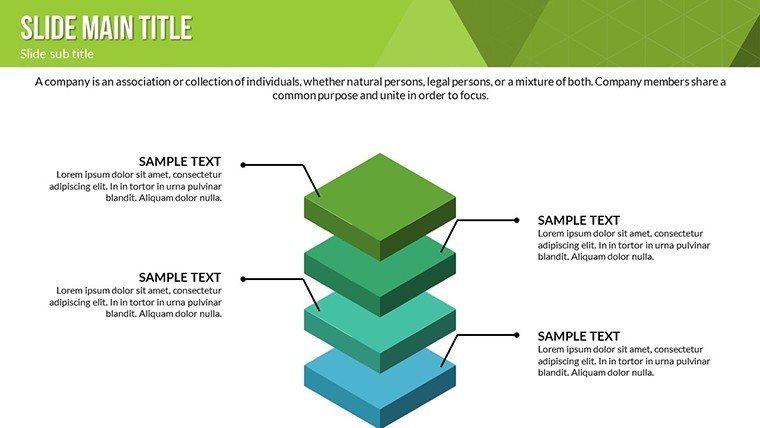
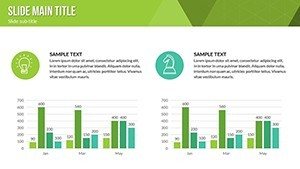
Process charts in this template excel at breaking down workflows into digestible steps. Slides feature linear or looped diagrams where you can label stages, add icons like arrows for direction, and color-code for phases - yellow for planning, blue for execution. The customization unleashes creativity, allowing brand alignment and data integration from tools like Microsoft Project. Benefits shine in clarity: a manufacturing firm used process visuals to optimize assembly lines, reducing delays by 20%, per Lean Six Sigma case studies. This expert-level design demonstrates authority, helping audiences follow intricate operations without confusion. Incorporate animations to simulate flow, mimicking real-time progress and boosting engagement in virtual meetings.
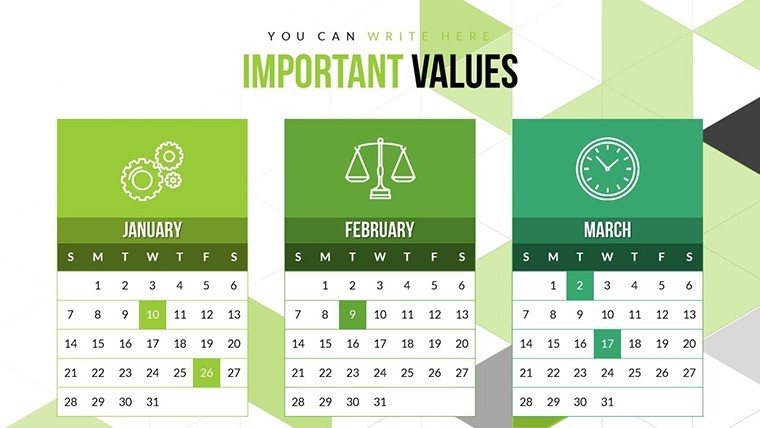
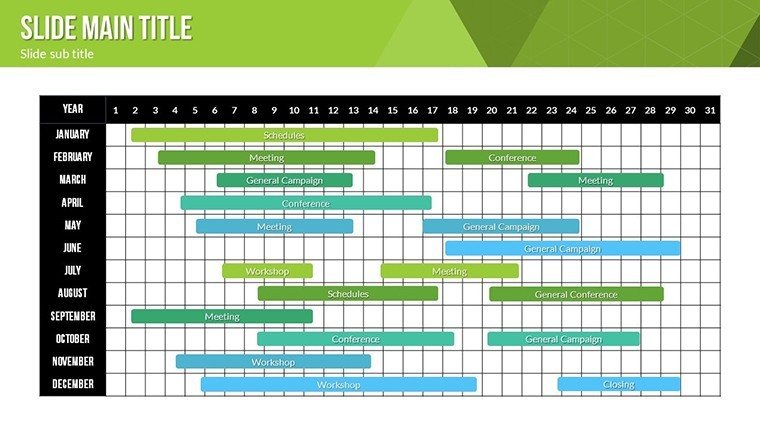
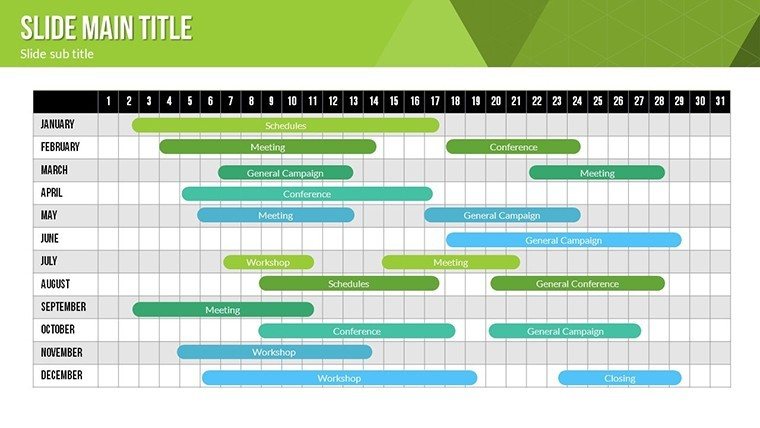
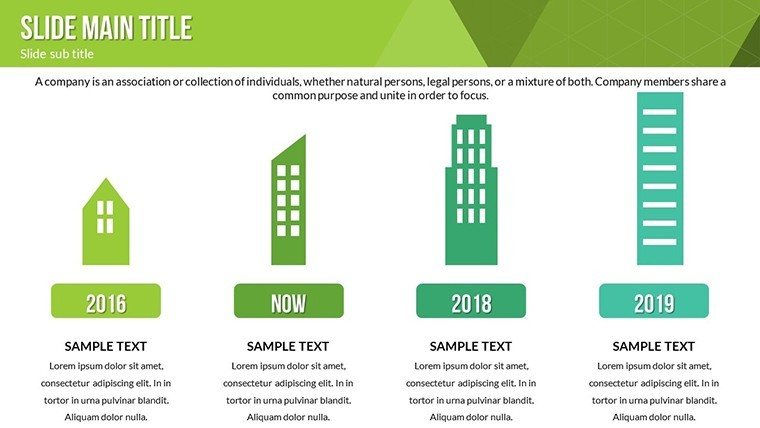
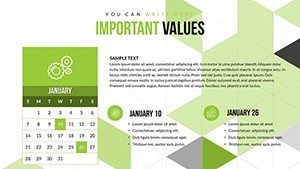
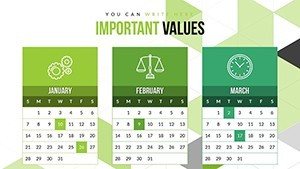
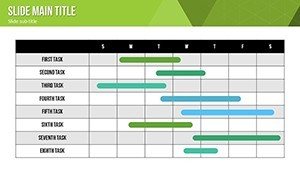
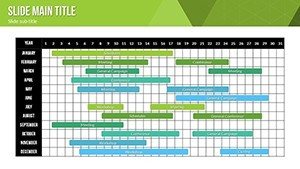
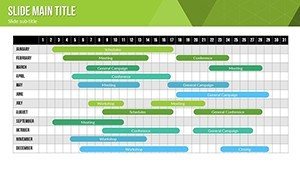
Visualizing Time with Timeline Slides
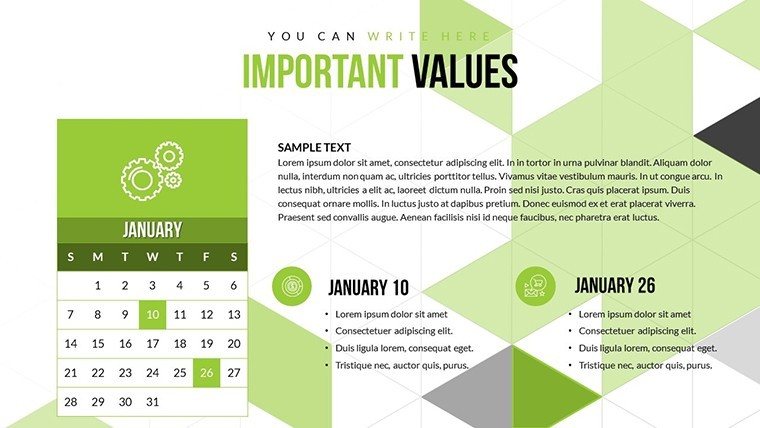
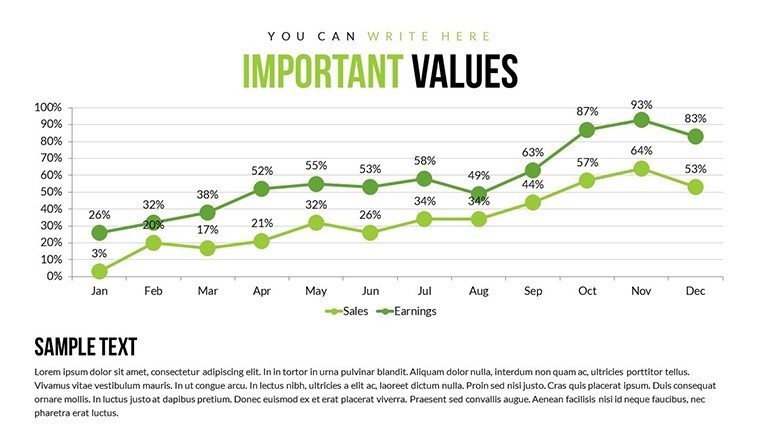
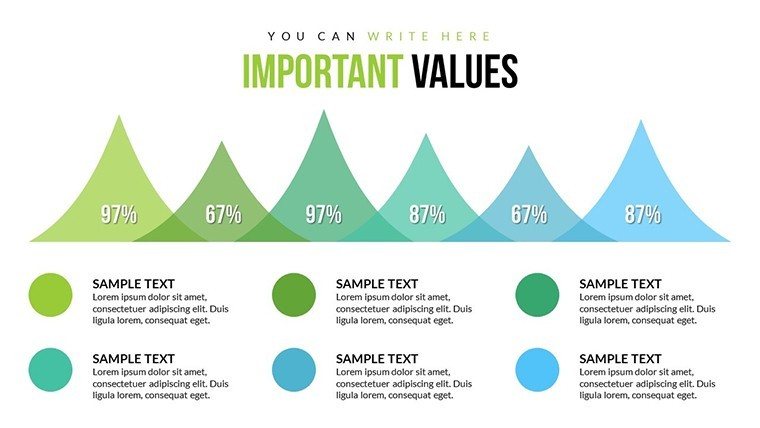
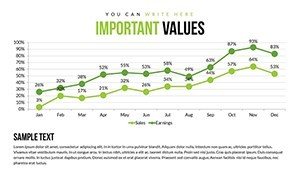
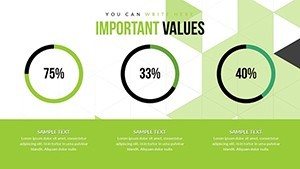
Timelines bring history and futures to life, with slides offering horizontal bars or vertical stacks for events. Edit markers with dates, descriptions, and metrics, using gradients to show intensity. This solves chronological disarray, making it ideal for roadmaps. In education, timelines have clarified curriculum progressions, enhancing student retention as per Edutopia insights. User advantages include scalability for long-term projects and easy updates for agile environments. With vector elements, maintain sharpness across formats, ensuring professional polish.
User-Friendly Features for Effortless Customization
The interface prioritizes ease: drag-and-drop elements, preset themes, and multimedia inserts like videos for demos. For consultants, embed analytics in timelines to showcase ROI paths. Diverse applications range from business proposals to academic lectures, with tips like using sans-serif fonts for readability. A PMI-certified project used these for milestone tracking, accelerating approvals. These features, rooted in UX principles, empower all skill levels to create compelling narratives.
Step-by-Step Use Cases and Integration
Start by selecting a slide, customize with your data, then refine visuals. In sales, timelines forecast pipelines; in HR, process onboarding. Integrate with Excel for live links, or Teams for collaboration. Expert advice: Balance elements to avoid clutter, per Tufte's data-ink ratio.
Embark on Visual Mastery Today
This Processing Timeline Template is your key to persuasive presentations. 16 slides offer unmatched versatility, outperforming stock options with tailored benefits like time savings and audience wow-factor. Weave LSI such as milestone mapping organically. Trust its design for results; download now to chart your success path.
Frequently Asked Questions
- How do I customize timeline milestones?
- Simply edit texts, dates, and colors directly; add or remove markers as needed.
- Supports process animations?
- Yes, intuitive effects simulate step-by-step flows.
- Compatible with Google Slides?
- Fully, for seamless cloud-based editing.
- Ideal for which professionals?
- Project managers, educators, consultants - anyone sequencing events.
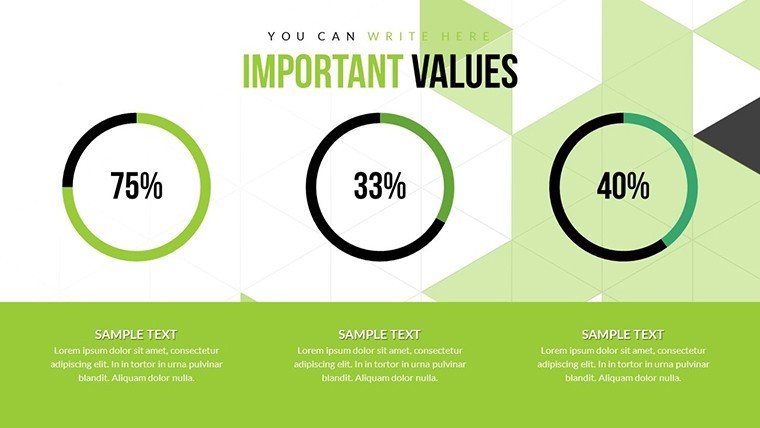
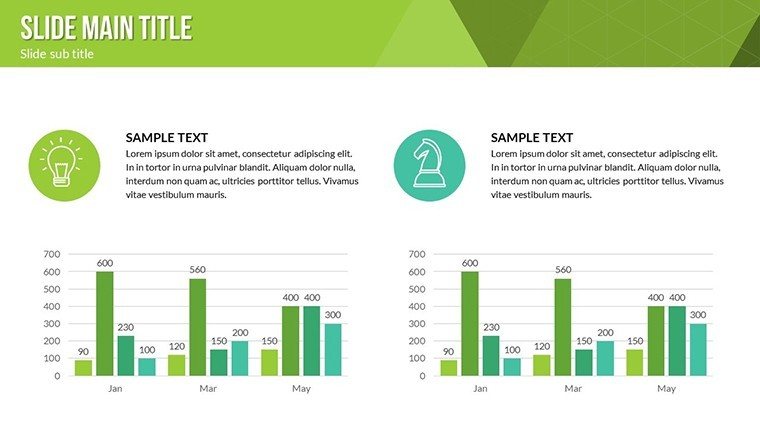
- Includes data visualization tools?
- Yes, transform metrics into engaging charts within timelines.
- Can I add multimedia?
- Absolutely, insert videos or audio for enriched narratives.