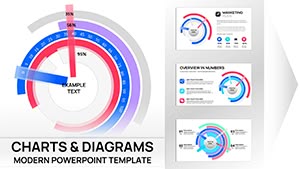
Purchasing Power PowerPoint Charts Template - Professional Infographic PPTX Download


Type: PowerPoint Charts template
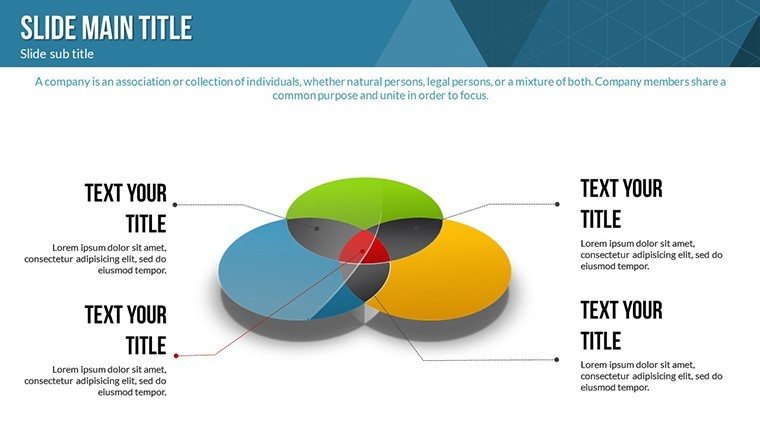
Category: Relationship, 3D
Sources Available: .pptx
Product ID: PC00540
Template incl.: 24 editable slides
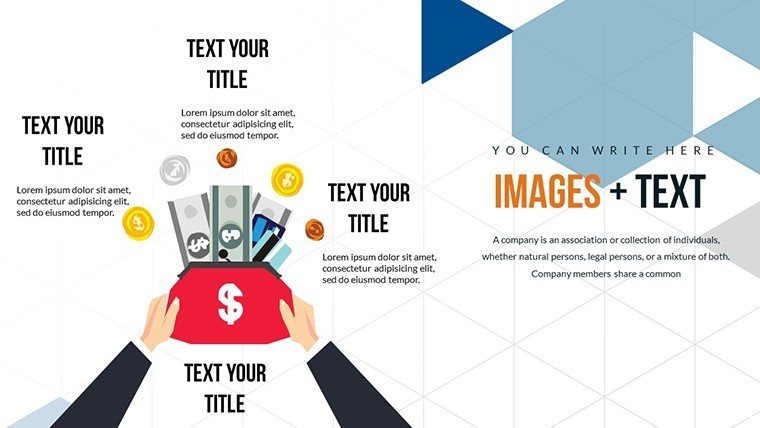
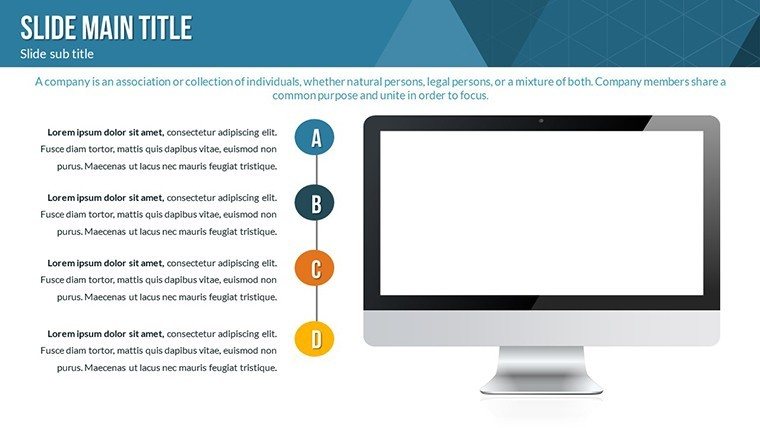
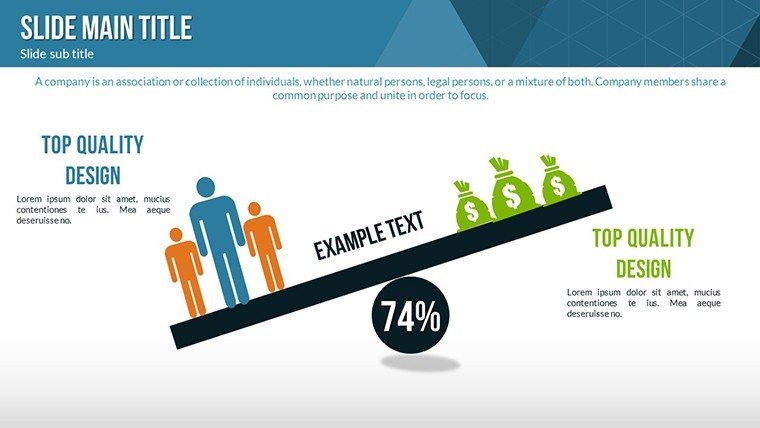
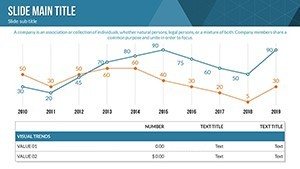
Understanding purchasing power - the backbone of consumer economics - requires visuals that dissect trends with depth. Our Purchasing Power PowerPoint Charts Template delivers 24 editable slides of professional infographics, crafted for business pros, educators, and analysts. From 3D models showing inflation impacts to relationship charts linking income to spending, it transforms data into digestible stories, ideal for pitches on market dynamics or financial literacy sessions.
With customizable color schemes and animations, it adheres to economic visualization best practices, like those from the Bureau of Economic Analysis, for credible outputs.
Highlight Features for Financial Visualization
Customization reigns supreme: Adjust schemes to match fiscal themes, use intuitive tools for data entry.
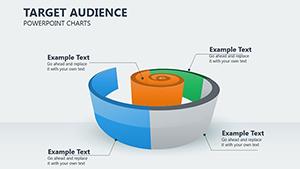
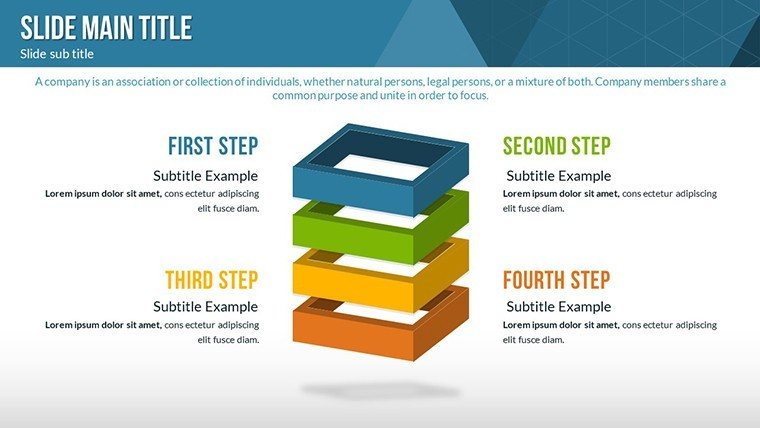
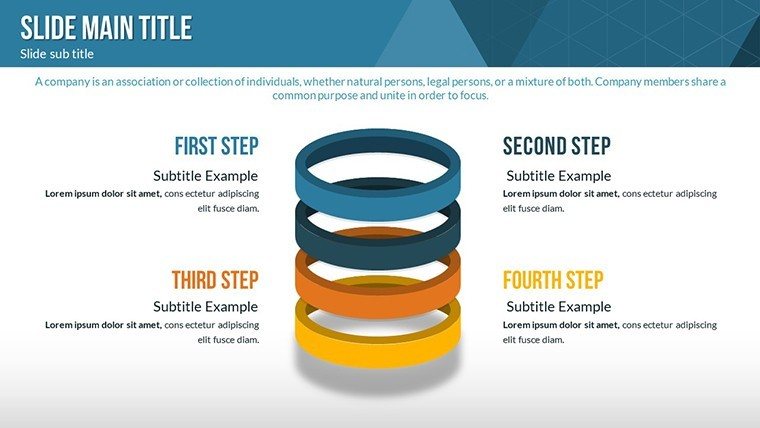
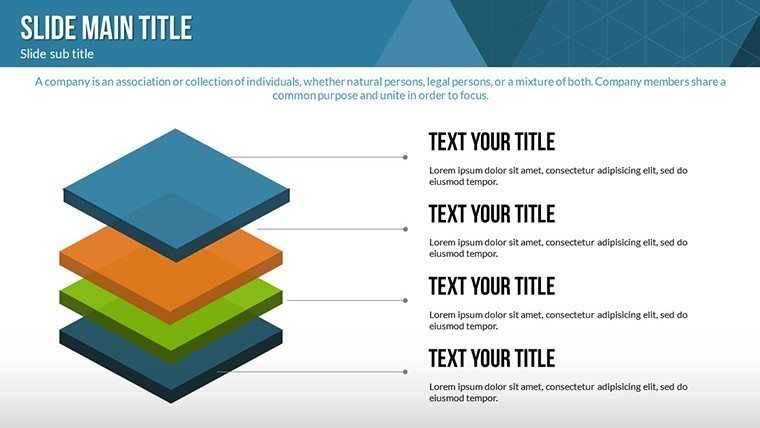
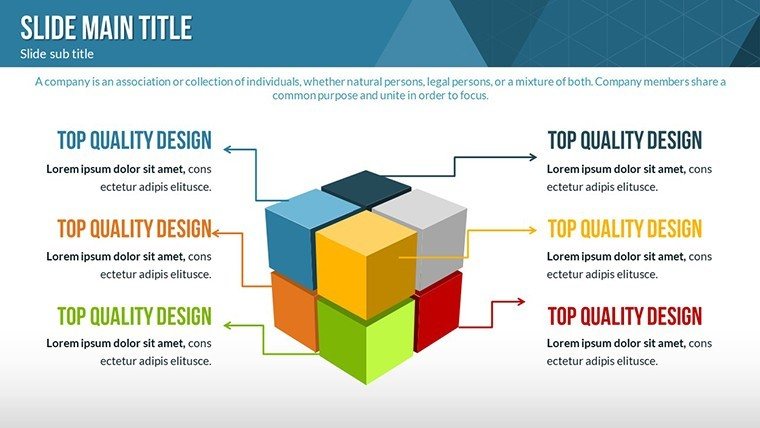
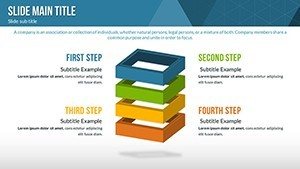
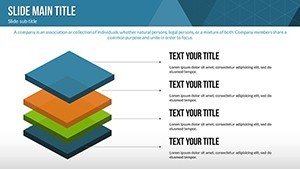
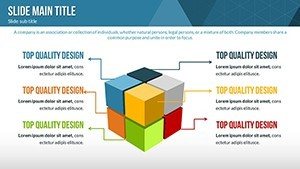
- 3D Charts: Render volumetric views of purchasing parity across countries.
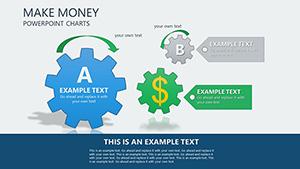
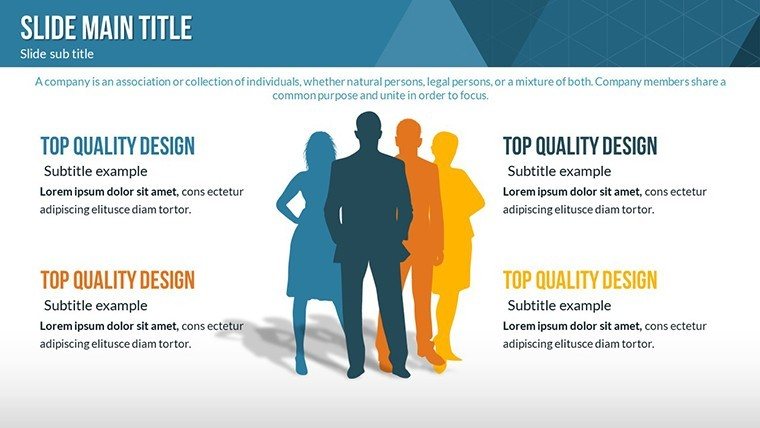
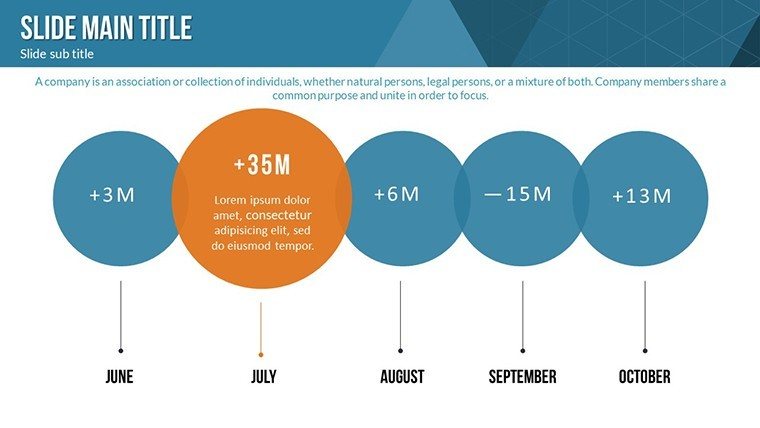
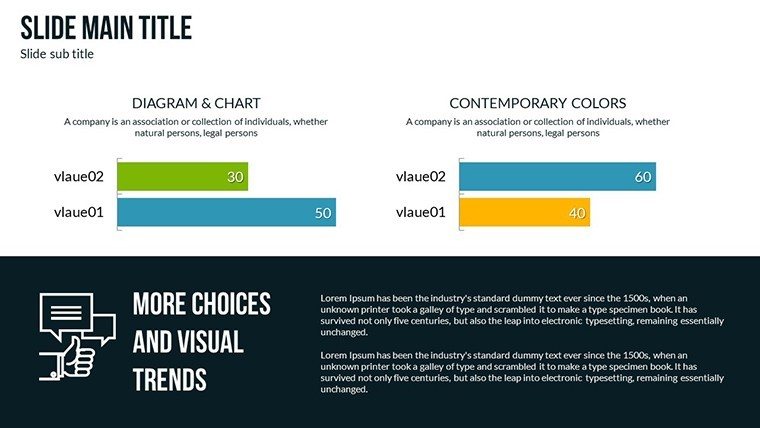
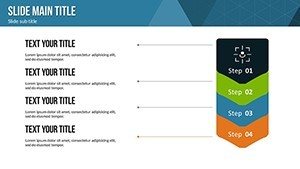
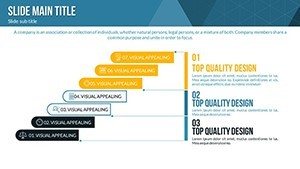
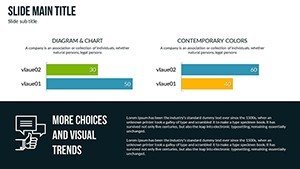
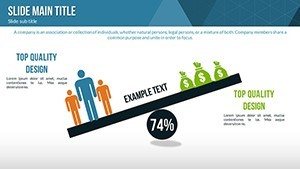
- Relationship Diagrams: Illustrate correlations, like wage growth vs. consumer confidence.
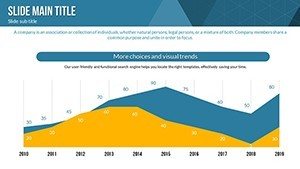
- Animation Integration: Dynamic reveals for trends like post-recession recoveries.
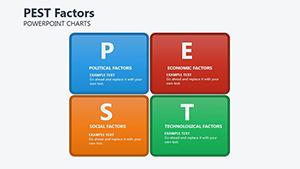
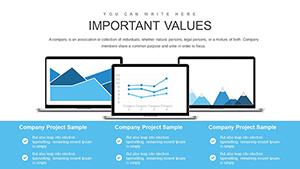
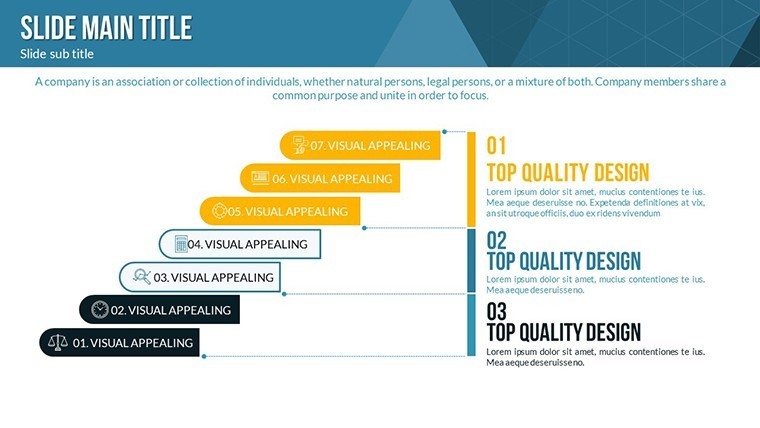
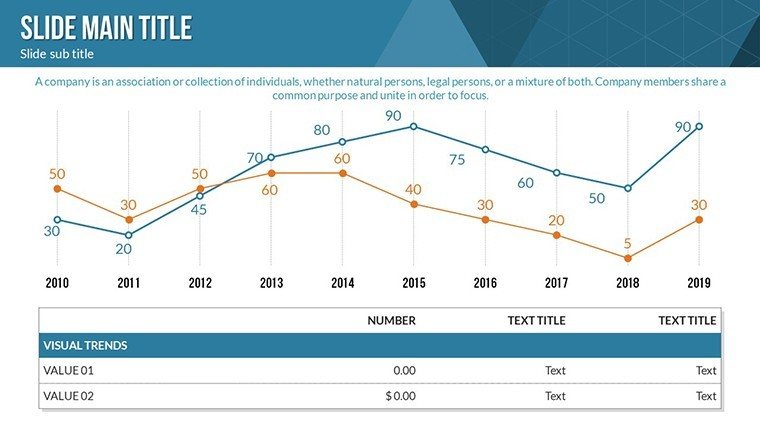
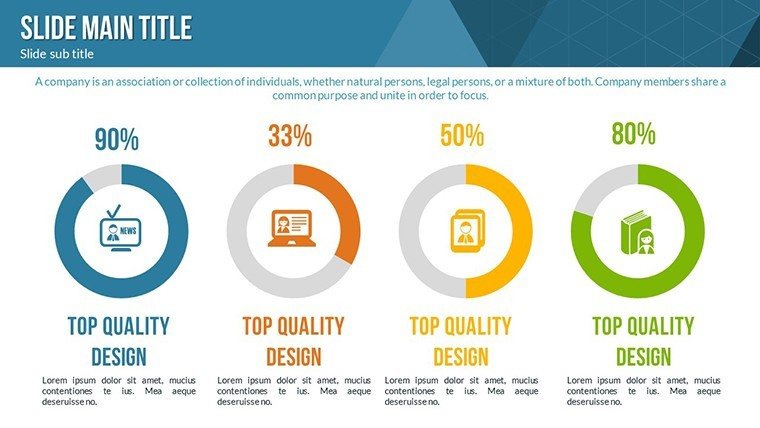
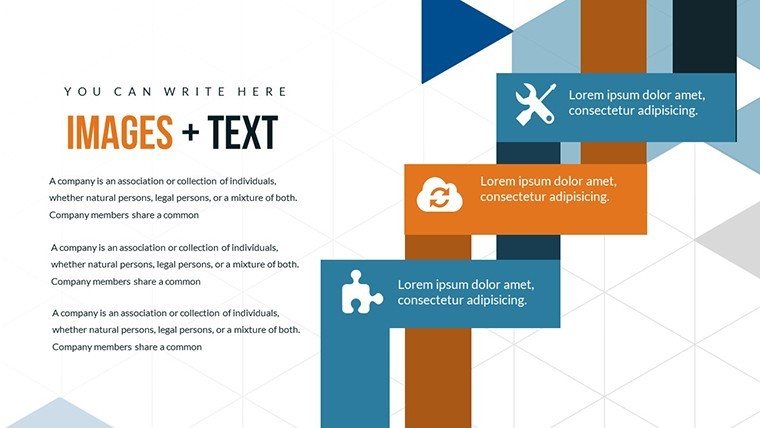
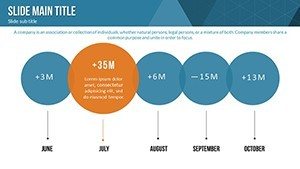
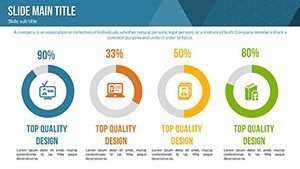
- Infographic Variety: Graphs for sales, projections, and quizzes.
These align with OECD guidelines on economic indicators, bolstering your presentation's authority.
Diverse Applications in Economic Contexts
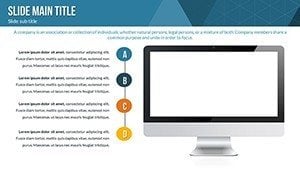
For investment briefs, use 3D slides to model portfolio risks tied to purchasing shifts. Educators can craft interactive quizzes on inflation effects, with relationships charts clarifying concepts.
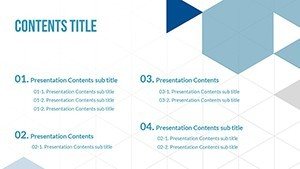
Envision a market analysis: Slide 4's infographic breaks down regional purchasing power, Slide 20 relates it to GDP. Superior to defaults, it incorporates LSI like "consumer price index" fluidly.
- Setup Guide: Import data, tweak 3D elements, animate for impact.
- Insights Tips: Back with BEA data for trustworthiness.
- Benefits Edge: Simplifies complex fiscal data for better audience grasp.
An advisor firm saw 28% better engagement in webinars using similar infographics, per feedback.
Unlock Purchasing Insights
Fully compatible, with previews for ease.
Power up your analyses - download and decode purchasing dynamics now.
Frequently Asked Questions
- Are 3D elements editable?
- Yes, fully customizable for angles and data.
- Supports animations for what?
- Charts, text, and graphics to engage viewers.
- Best for which presentations?
- Financial, market, and educational on economics.
- Compatibility details?
- Latest PowerPoint versions, PPTX format.
- Included files?
- PPTX with 24 slides, infographics ready.
- Customization level?
- Extensive, from colors to content.