Factors PEST PowerPoint Charts Template: Strategic Insight Made Simple


Type: PowerPoint Charts template
Category: Matrix, Business Models, Tables
Sources Available: .pptx
Product ID: PC00200
Template incl.: 29 editable slides
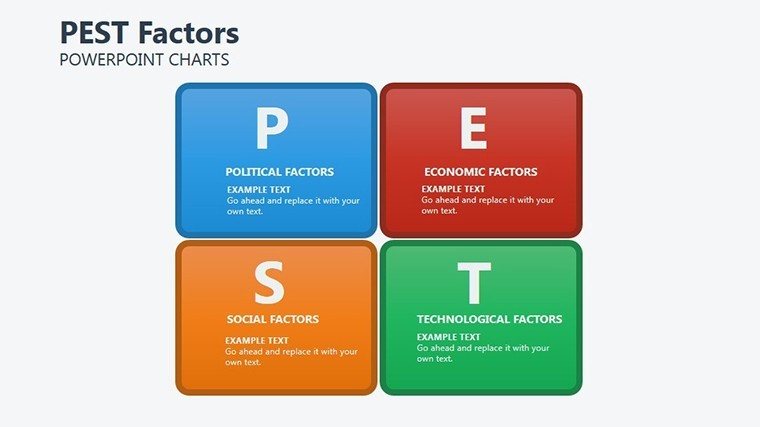
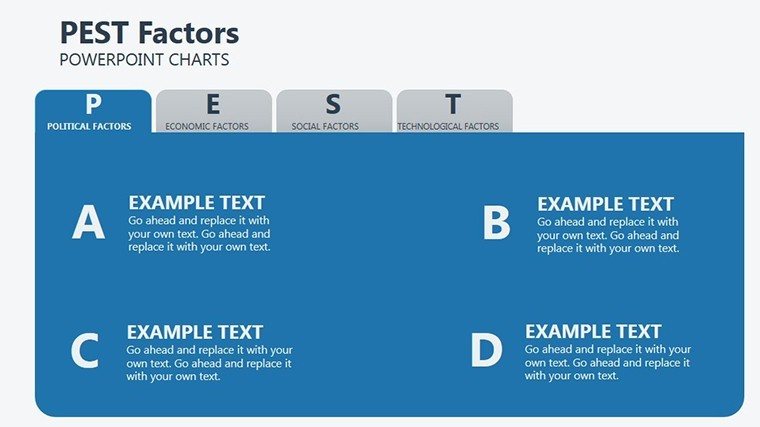
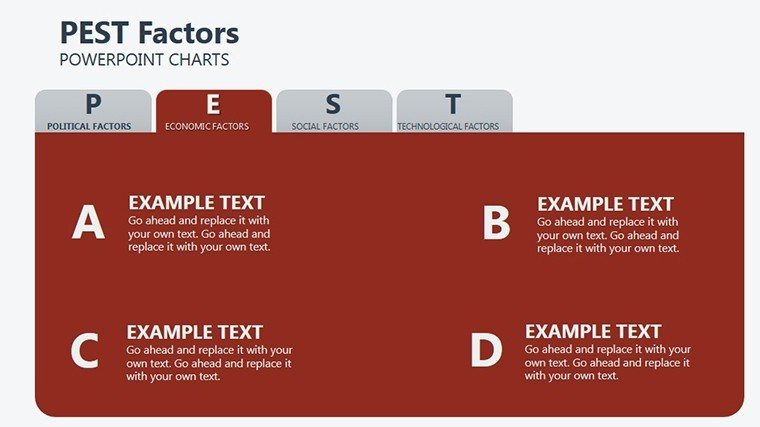
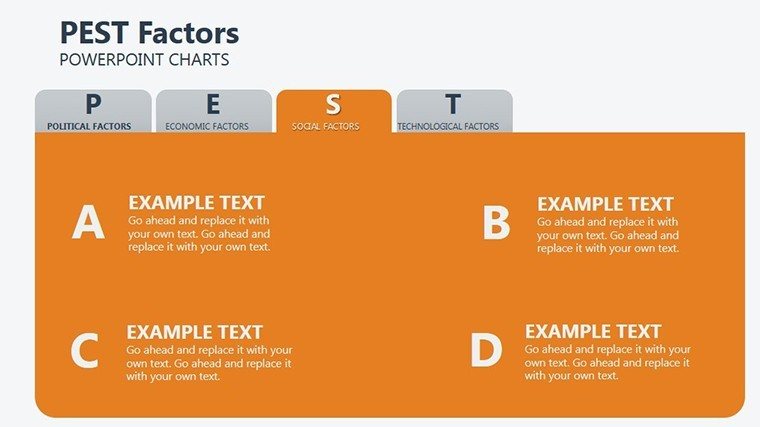
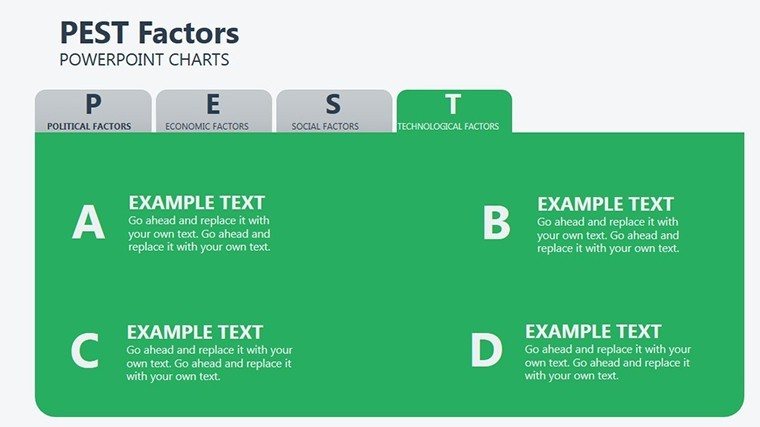
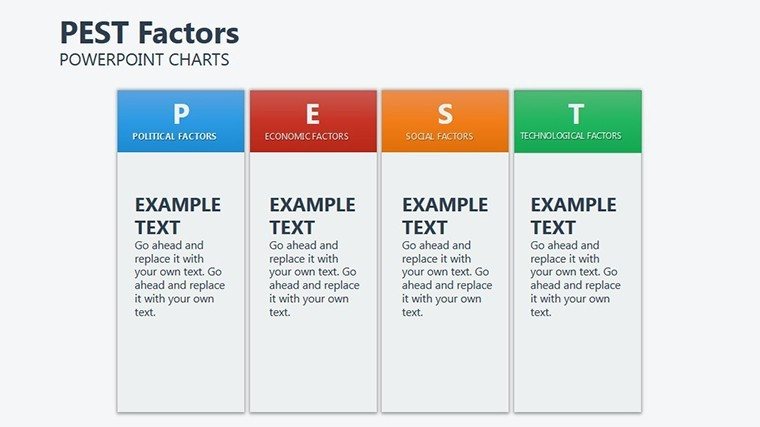
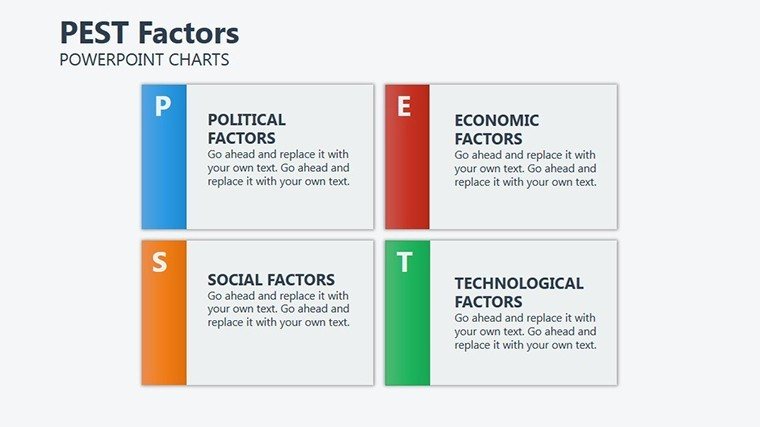
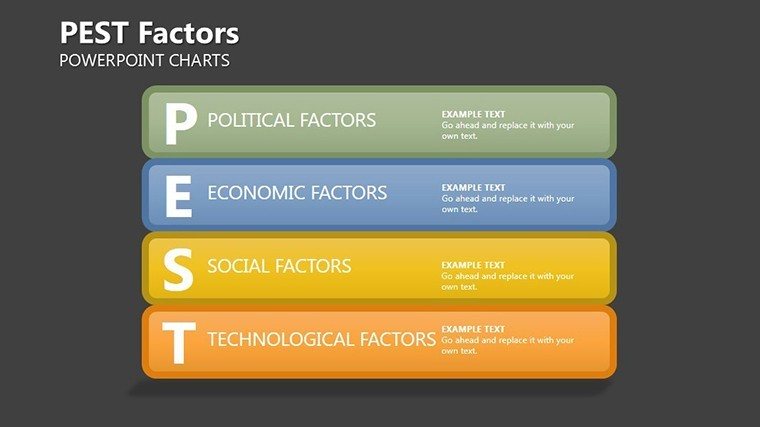
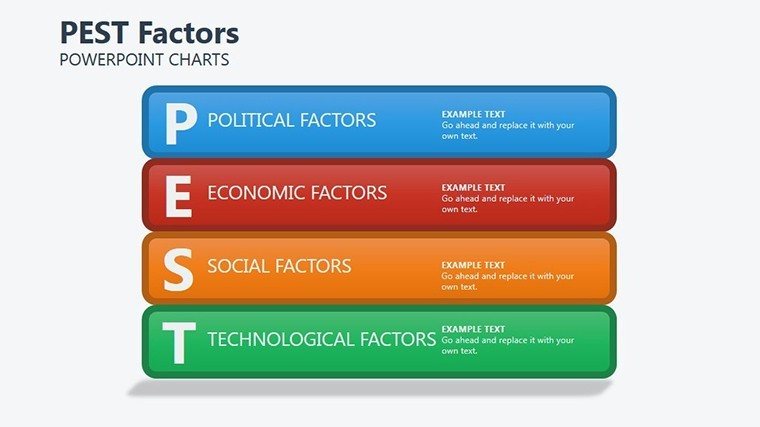
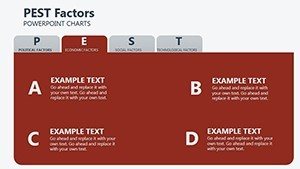
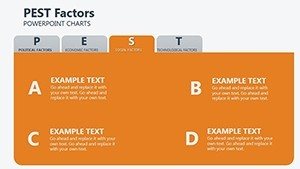
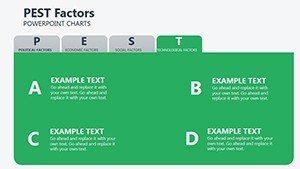
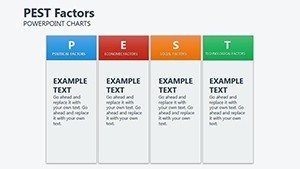
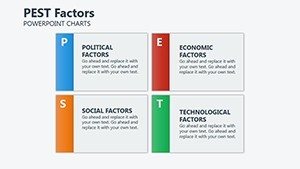
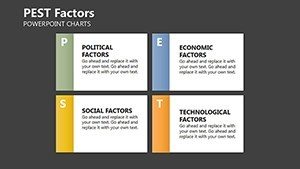
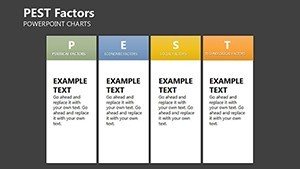
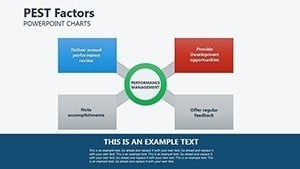
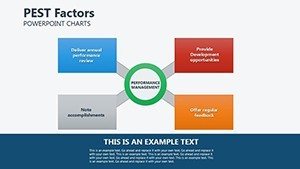
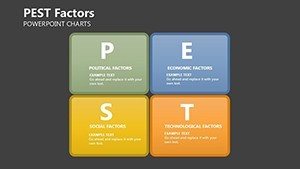
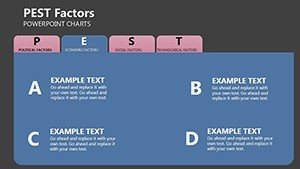
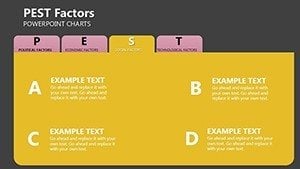
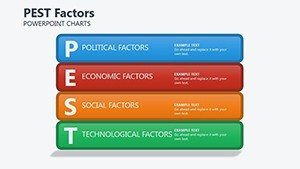
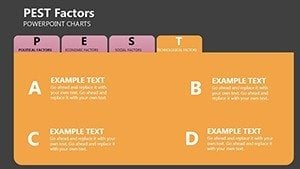
Navigating the external business environment demands more than intuition - it requires structured analysis that anticipates shifts and seizes opportunities. Enter our Factors PEST PowerPoint Charts Template, a comprehensive tool with 29 editable slides dedicated to Political, Economic, Social, and Technical factor breakdowns. Ideal for strategists and consultants, it simplifies PEST analysis, a framework endorsed by business gurus like those at McKinsey, to help firms like architecture practices assess regulatory impacts or tech firms gauge innovation trends. This template cuts through complexity, offering ready-made structures so you can populate with your data and present persuasively, all while compatible with PowerPoint and Google Slides for effortless collaboration.
Standout Features for In-Depth Analysis
Crafted for depth, this template's features empower users to dissect macro-environmental forces with precision and visual appeal.
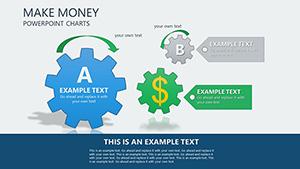
Versatile Chart Formats
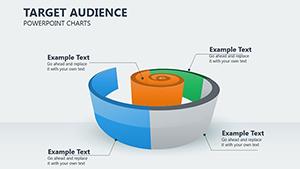
Bar charts dominate for quantitative comparisons, such as economic indicators across regions, with customizable scales to highlight variances accurately. Pie charts segment influences, like social demographics affecting market entry, ensuring proportional accuracy per strategic planning best practices.
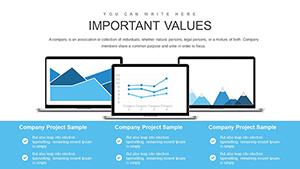
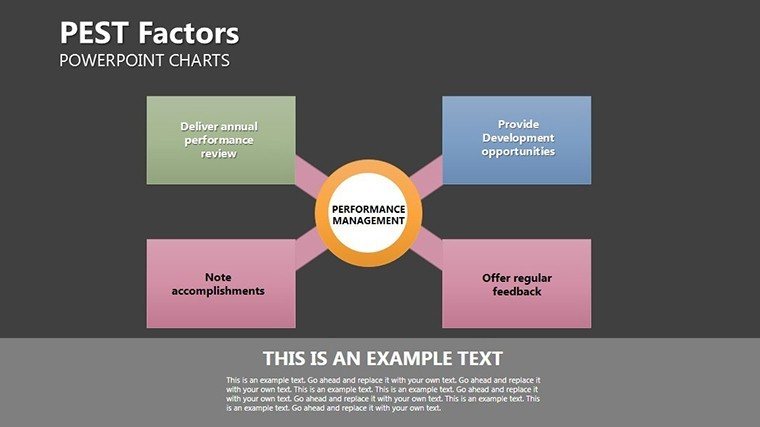
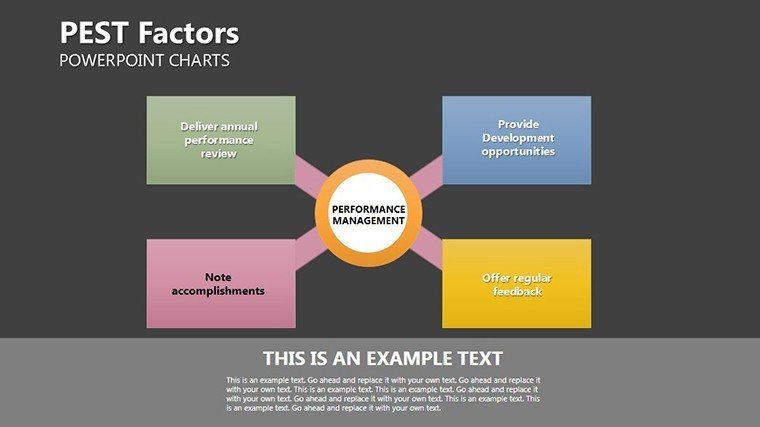
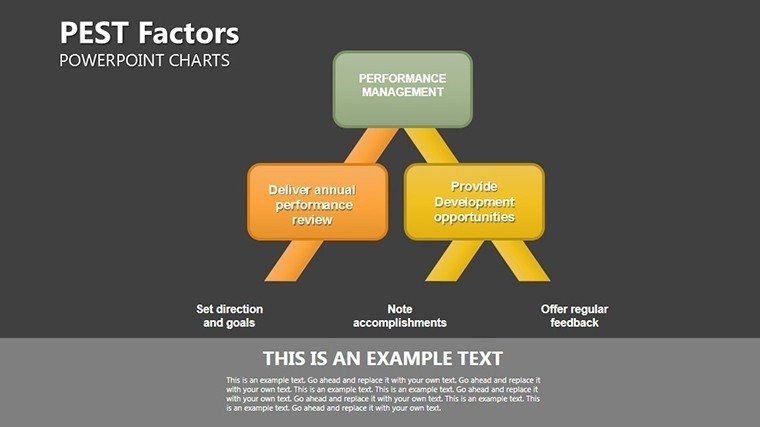
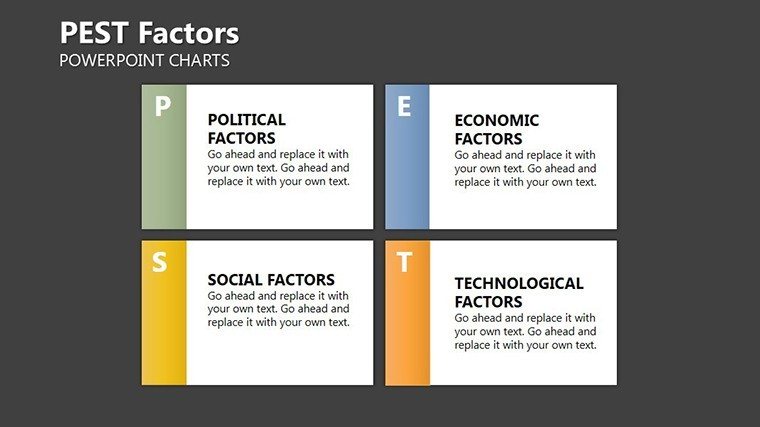
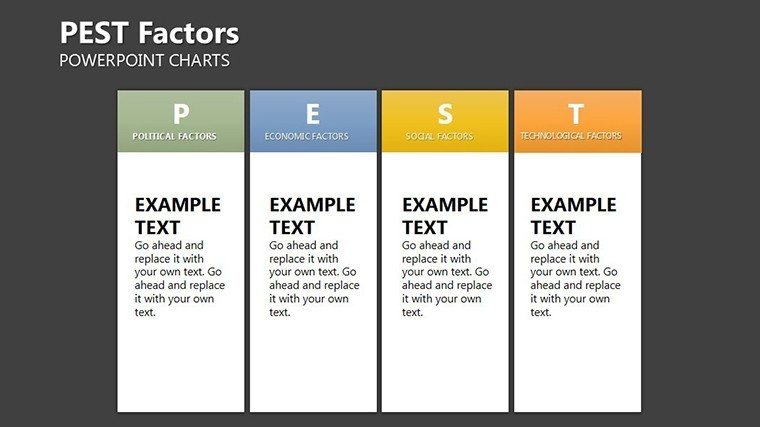
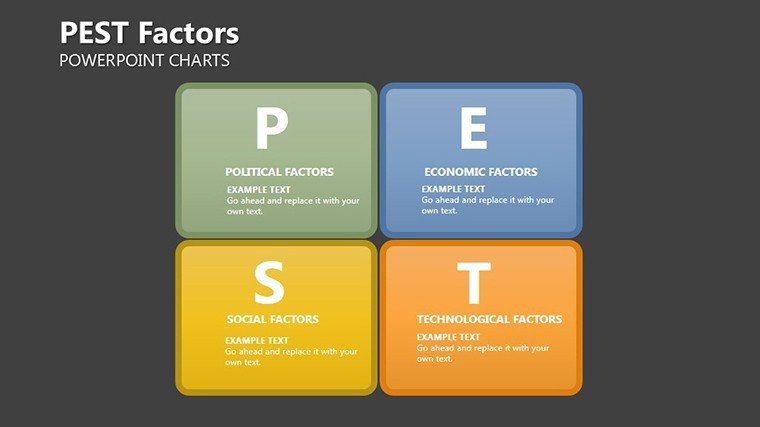
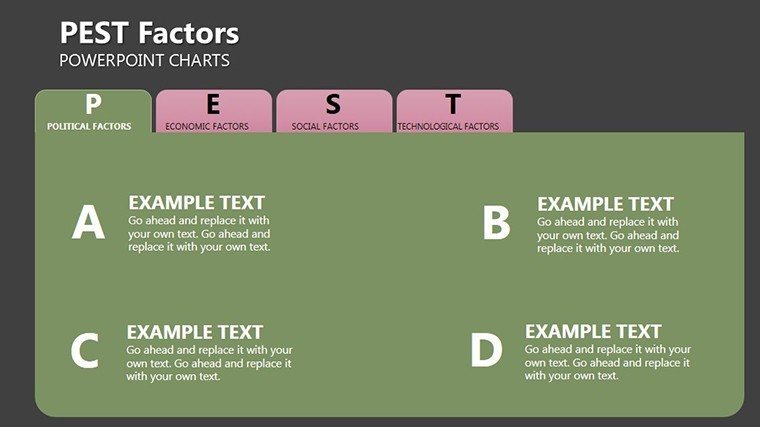
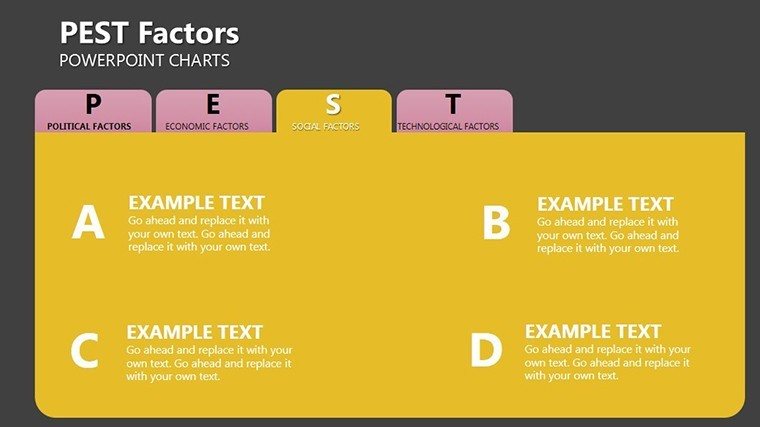
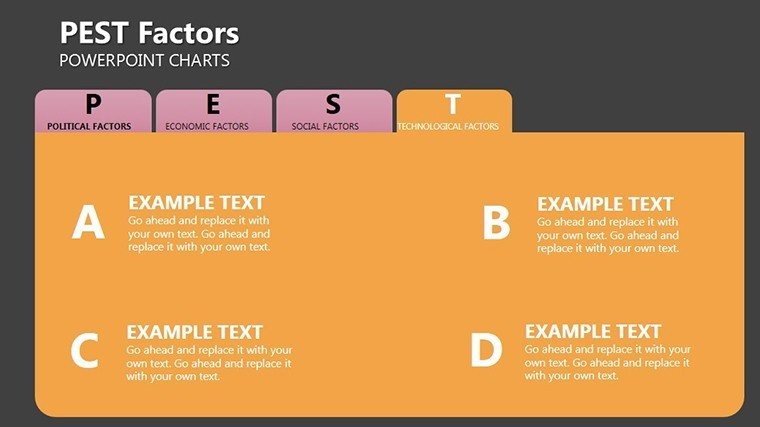
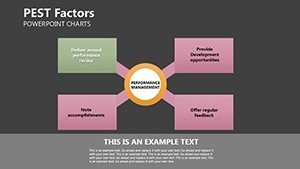
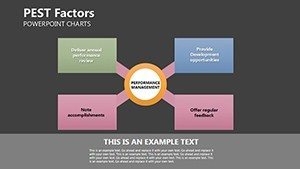
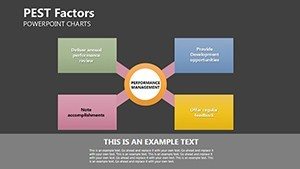
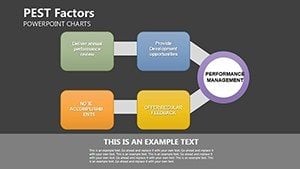
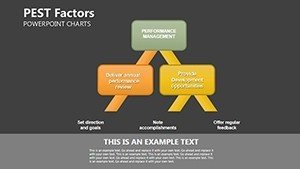
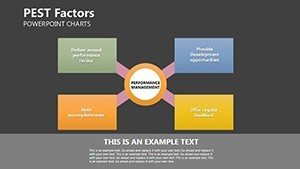
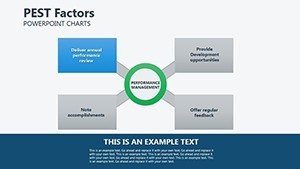
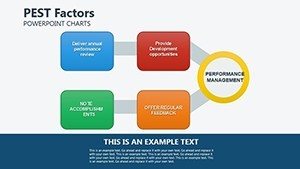
Line graphs track evolutions, ideal for technical advancements over time, while matrix layouts organize PEST elements into quadrants for holistic views. Each chart includes explanatory placeholders, facilitating quick adaptations for scenarios like a retail chain evaluating political tariffs.
User-Centric Design Elements
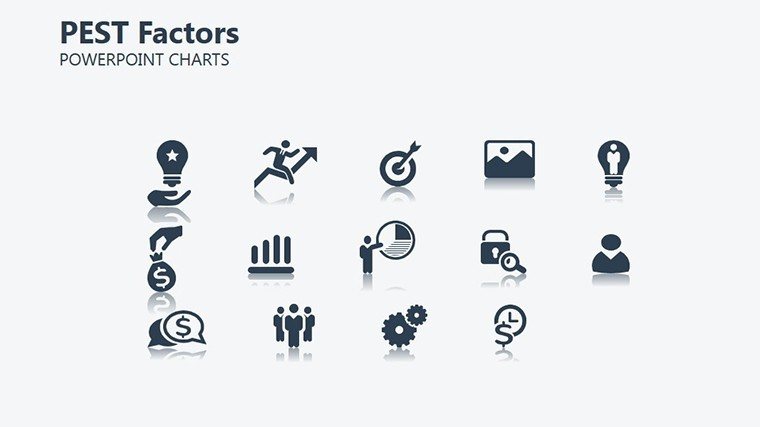
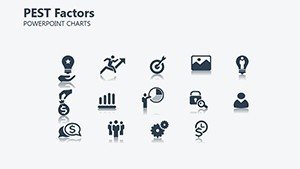
Fully editable colors and fonts align with corporate identities, and the inclusion of icons - flags for political, coins for economic - adds intuitive layers. Time-saving ready slides cover intros, analyses, and conclusions, with high-res quality for professional outputs.
Benefits and Strategic Applications
This template transforms PEST from theory to actionable insight, benefiting users by clarifying ambiguities and fostering informed strategies. For educators teaching business models, it visualizes concepts, enhancing comprehension as per pedagogical studies. Benefits include boosted engagement - visual aids improve retention by 65%, per neuroscience research - and efficiency, allowing focus on interpretation over creation.
Authoritativeness shines in professional settings, with designs that convey expertise, crucial for consultant reports or student theses. Unlike standard tools, it offers PEST-specific frameworks, reducing setup time and errors.
Diverse Use Cases with Real-World Ties
- Business Strategy: Matrix charts for risk assessment in expansion plans, as in architecture firms navigating zoning laws.
- Educational Lectures: Bar graphs for factor comparisons, aiding MBA case studies.
- Consulting Deliverables: Pie charts for stakeholder impacts, supporting recommendations with data.
- Student Projects: Line graphs for trend analyses, elevating academic presentations.
- Financial Reports: Integrated views for economic forecasting, informing investment decisions.
Applications extend to monitoring changes, like post-pandemic social shifts, with slides designed for iterative updates.
Strategic Tips for Effective Deployment
Expert advice: Prioritize high-impact factors per industry - political for regulated sectors like healthcare. Use color coding consistently, e.g., red for risks, and integrate with SWOT for comprehensive strategies. Workflow: Research factors, input data, refine visuals, present - seamless for teams via shared edits.
Example: A consultant for an urban planning firm used this to analyze technical factors in smart city projects, leading to proactive adaptations and project wins, mirroring AIA-guided approaches.
FAQ
- What is PEST analysis in this template?
- A framework for external factors, with dedicated slides for each category to guide thorough reviews.
- How customizable are the PEST charts?
- 100% editable, from data to designs, for tailored strategic fits.
- Suitable for non-business uses?
- Yes, adaptable for educational or personal strategic planning.
- Does it include examples?
- Yes, placeholders with sample data to jumpstart your analysis.
- Compatible with Google Slides?
- Fully, for collaborative and cloud-based work.
- Any support for beginners?
- Included notes and intuitive layouts make it accessible.
Empower your strategies - download this PEST template and navigate uncertainties with confidence.