Marketing Analytics PowerPoint Charts Template: Master Data Visualization


Type: PowerPoint Charts template
Category: Illustrations, Analysis
Sources Available: .pptx
Product ID: PC00528
Template incl.: 21 editable slides
Data is the new oil, but without refinement, it's just a mess. Our Marketing Analytics PowerPoint Charts Template refines your metrics into polished, actionable insights. Tailored for marketers, analysts, and project managers, this collection of 21 editable slides specializes in financial charts, spatial relationships, and sequence visualizations. It's your ally in decoding complex datasets, turning numbers into narratives that drive decisions and growth.
Envision a dashboard slide aggregating campaign ROI with embedded derivatives charts, or a timeline mapping customer journey interactions. This template, in .pptx format, streamlines the process, allowing you to focus on interpretation rather than creation, ensuring your presentations are both accurate and compelling.
Essential Features for Analytical Excellence
Crafted with precision, this template emphasizes functionality and depth in data handling.
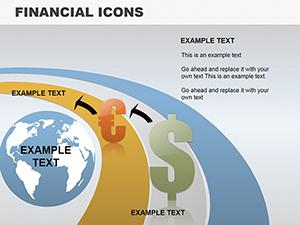
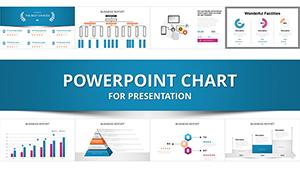
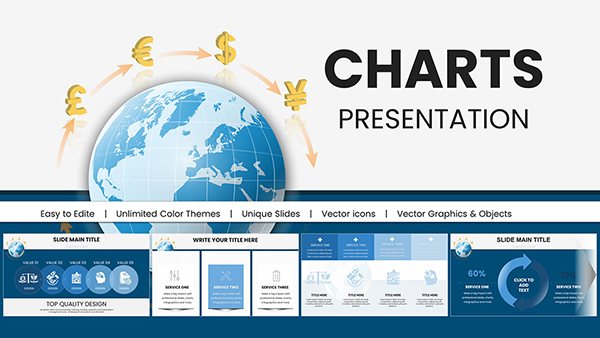
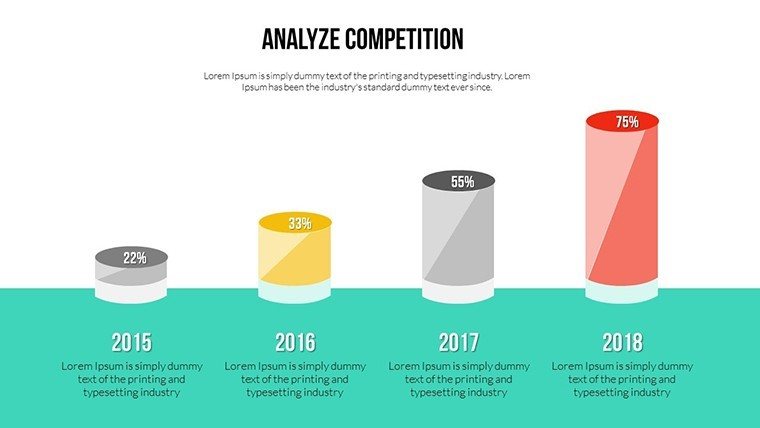
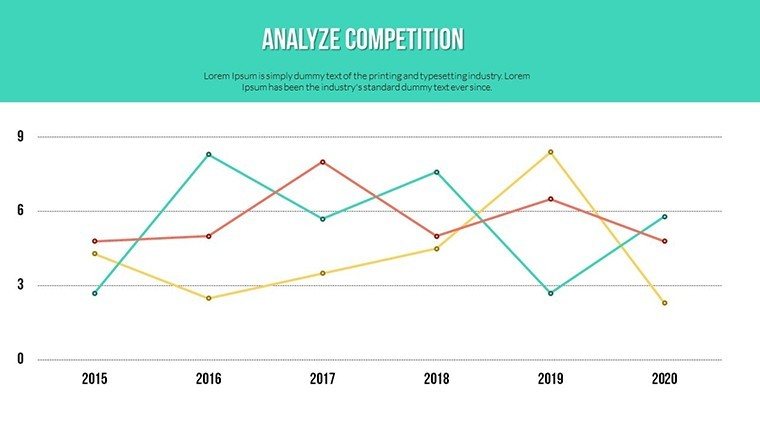
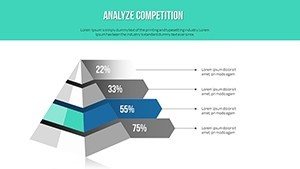
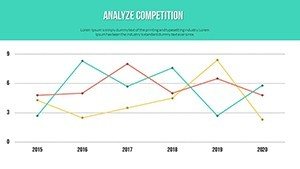
- Specialized Chart Types: Financial embeddings, bar charts for comparisons, and line graphs for trends, all optimized for marketing contexts.
- Editable Objects: Interact with elements directly, adjusting for real-time data updates without starting from scratch.
- Resource Allocation Tools: Visuals for scheduling and team coordination, ideal for multifaceted projects.
- Professional Polish: Clean designs that align with industry standards, enhancing credibility in stakeholder meetings.
Inspired by analytics frameworks like those from Gartner, the template promotes efficient data storytelling, minimizing misinterpretation through clear, labeled visuals.
Practical Applications in Marketing Realms
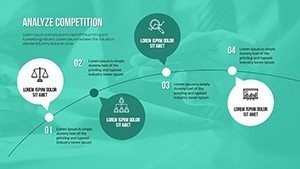
For project managers juggling deadlines, use the sequence charts to illustrate workflow dependencies, much like in agile methodologies where visualizing sprints prevents bottlenecks. A real estate firm, for instance, applied similar tools to analyze market trends, optimizing ad spends and increasing leads by 25%, as per industry benchmarks.
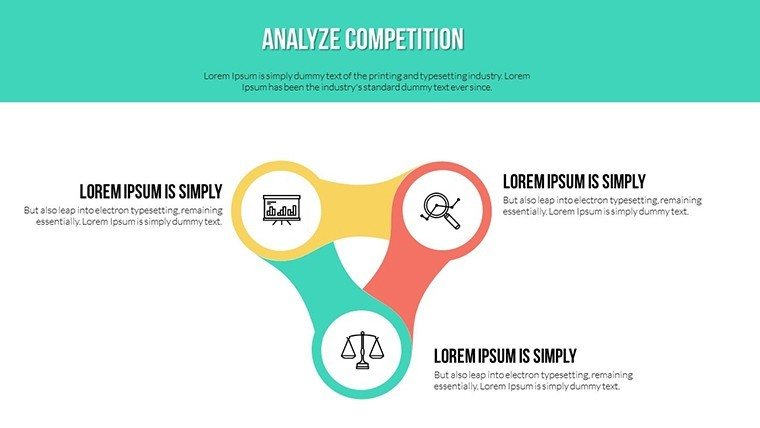
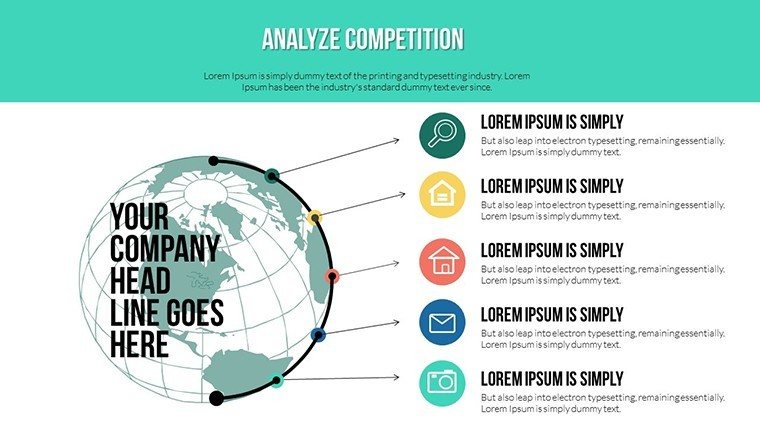
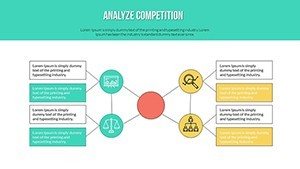
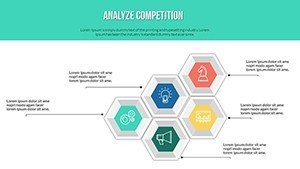
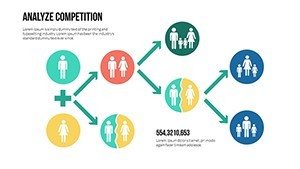
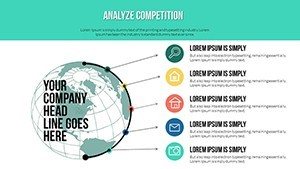
Marketers benefit from spatial relationship diagrams to map customer segments geographically, refining targeting strategies. In e-commerce, this could mean charting conversion funnels to identify drop-offs, leading to targeted interventions that boost sales.
The template excels in refining presentations for executive reviews, where financial charts clarify budget impacts. Benefits include better resource allocation, risk mitigation, and fostered collaboration, ultimately elevating team performance and ROI.
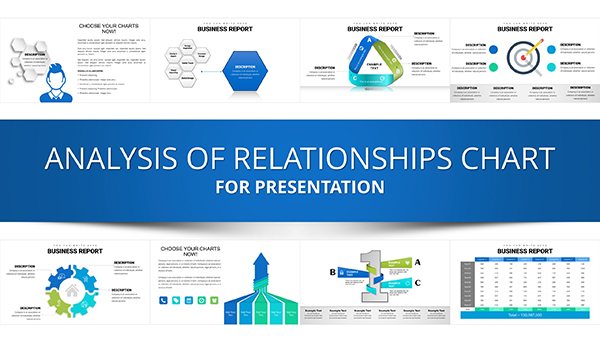
Slide-by-Slide Insights
Explore the structure:
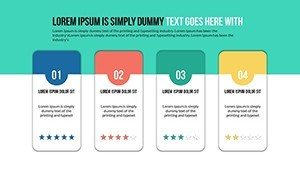
- Slides 1-3: Setup and Dashboards: Overview panels with key metric summaries and customizable filters.
- Slides 4-10: Core Analytics: Financial charts, including derivatives and P&L visuals for in-depth reviews.
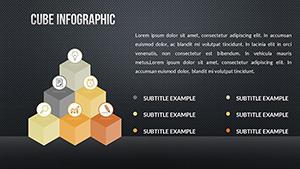
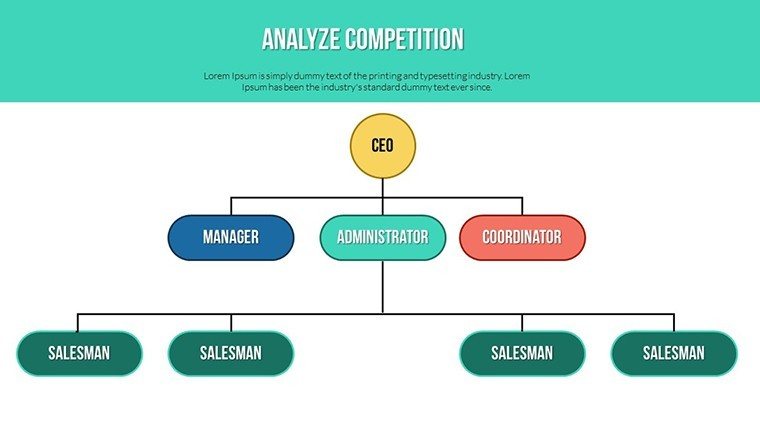
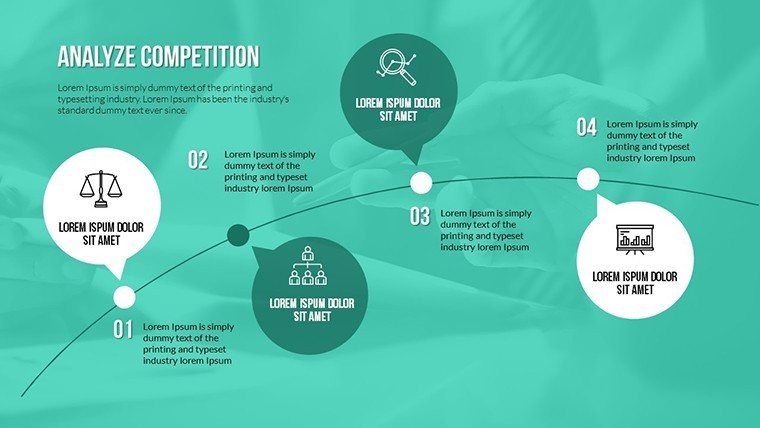
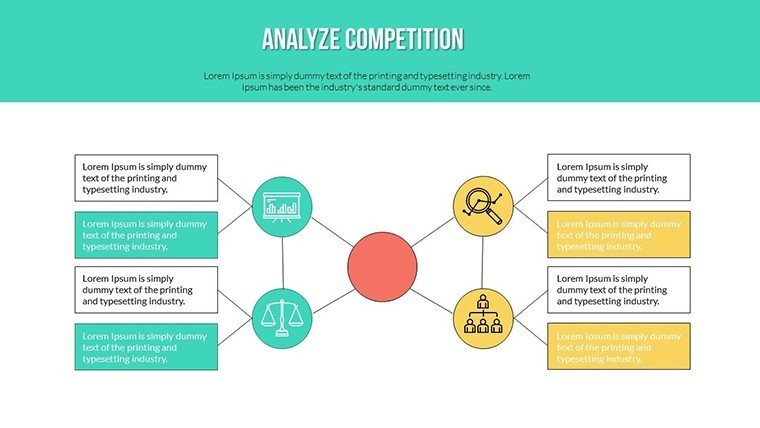
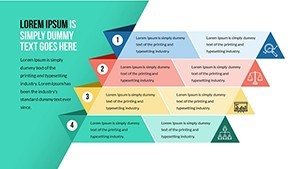
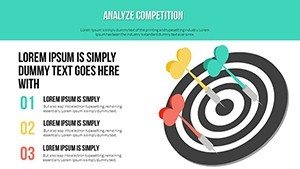
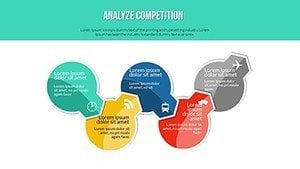
- Slides 11-16: Relationship Mapping: Spatial and sequence diagrams for process flows and data interconnections.
- Slides 17-21: Summaries and Forecasts: Predictive trend lines and action-oriented conclusions.
These allow for modular builds, scaling complexity as needed.
Expert Strategies for Optimal Use
From my analytics background, here's how to maximize:
- Data Integration: Link to Excel for live updates, ensuring accuracy in volatile markets.
- Visual Best Practices: Use consistent scales in charts to avoid distortion, per data viz experts like Stephen Few.
- Collaborative Enhancements: Share editable versions for team inputs, streamlining feedback loops.
- Performance Tracking: Incorporate KPIs with color-coded indicators for quick scans.
An agency case: Using analogous templates, they streamlined client reports, reducing prep time by 40% and improving satisfaction scores.
Empower Your Analytics Journey
In an era of big data, this Marketing Analytics PowerPoint Charts Template is your compass. It doesn't just present information - it unlocks its potential, helping you navigate towards success.
Take control of your data - download and customize this template to transform your marketing efforts.
Frequently Asked Questions
What chart types are included?
Financial embeddings, bars, lines, and spatial diagrams tailored for analytics.
Is it only for PowerPoint?
Yes, .pptx format, but convertible to other tools if needed.
How editable are the slides?
Fully, with direct object manipulation for custom fits.
Suitable for large datasets?
Yes, designed to handle complexity without performance issues.
Does it support animations?
Basic ones are included; add more via PowerPoint features.