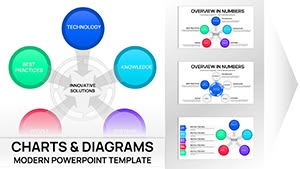
Professional Business Slideshow PowerPoint Charts: Captivate and Convince


Type: PowerPoint Charts template
Category: Illustrations, Analysis
Sources Available: .pptx
Product ID: PC00524
Template incl.: 18 editable slides
Picture this: You're in a high-energy business meeting, and instead of yawns, your slides elicit nods of agreement and sparks of interest. That's the magic of our Professional Business Slideshow PowerPoint Charts Template. Boasting 18 meticulously designed editable slides, this tool is tailored for ambitious professionals who want to communicate ideas with clarity and charisma. From sales teams crafting compelling pitches to managers leading team huddles, it addresses the core need for visuals that simplify complexity. With its sleek design, you can quickly adapt charts to showcase quarterly stats or project roadmaps, turning mundane data into dynamic stories. This isn't just a template - it's a catalyst for better engagement, drawing on proven design principles to make your presentations memorable and effective.
Delving into Sleek Design and Custom Features
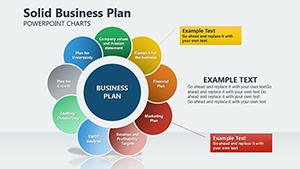
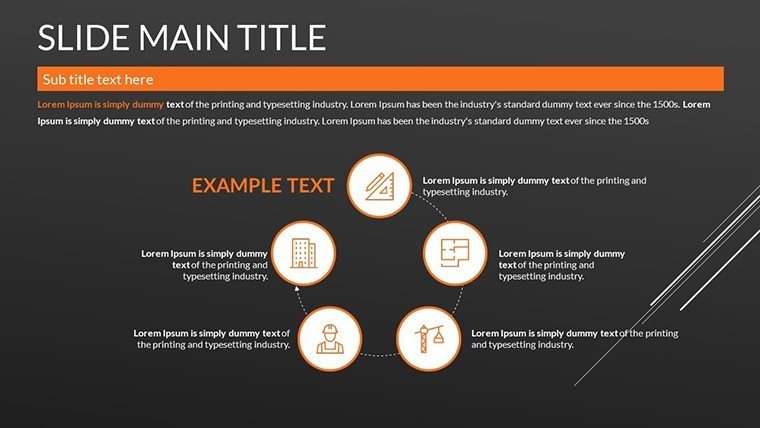
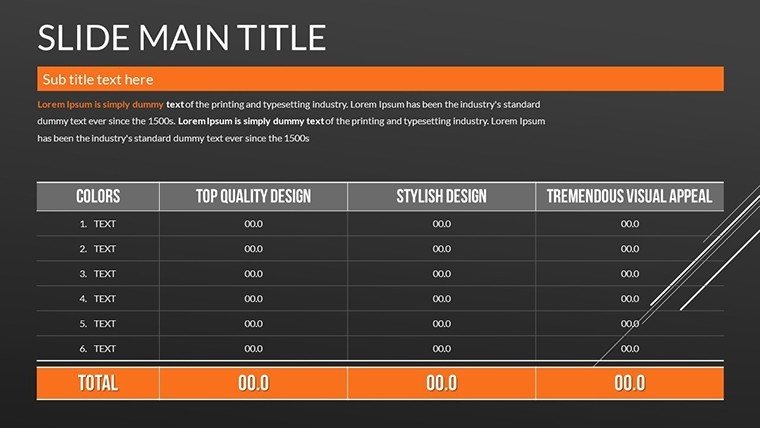
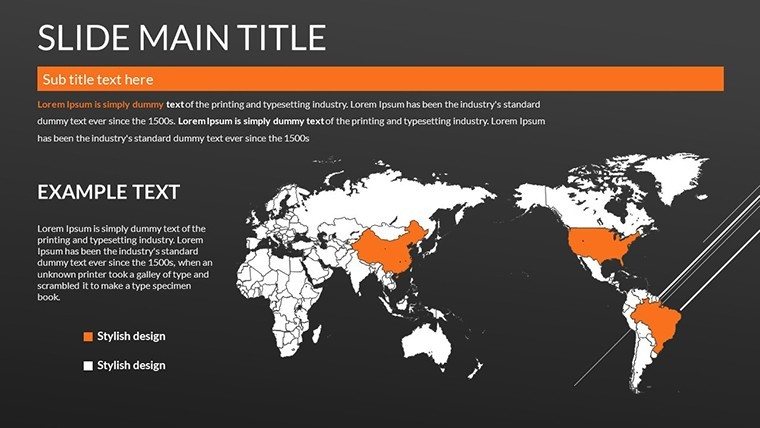
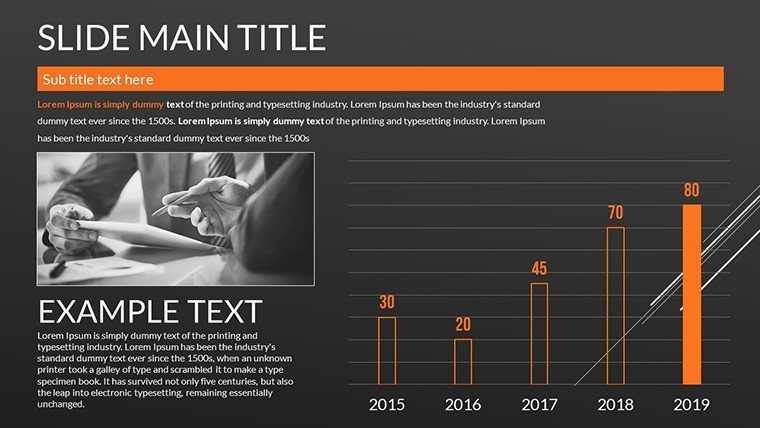
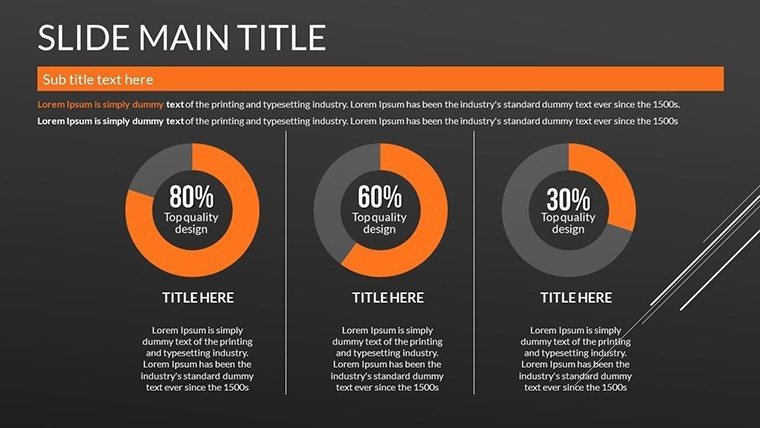
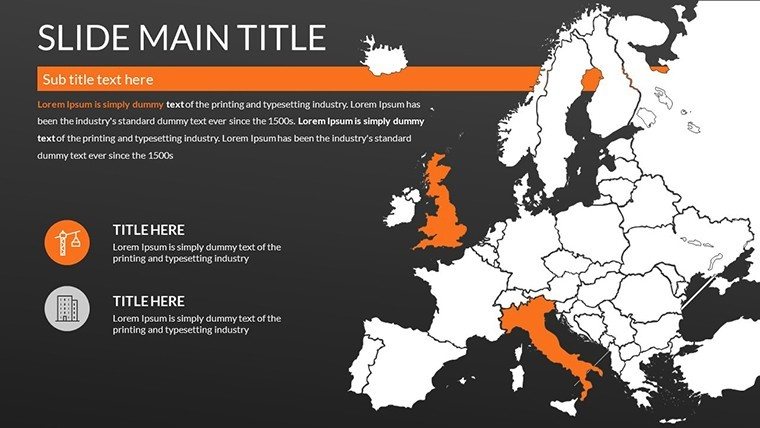
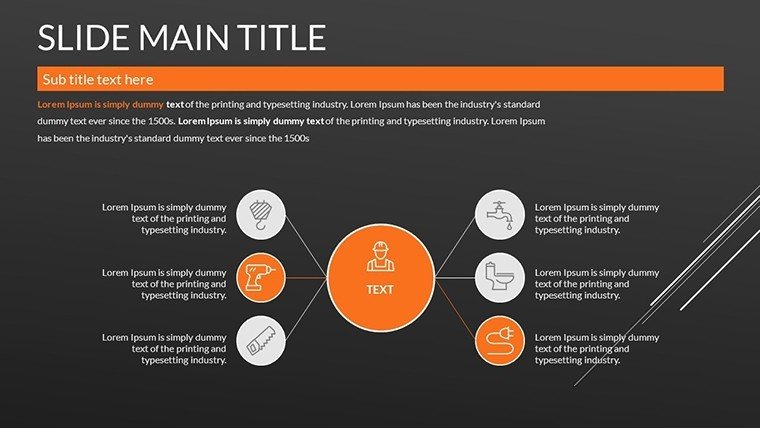
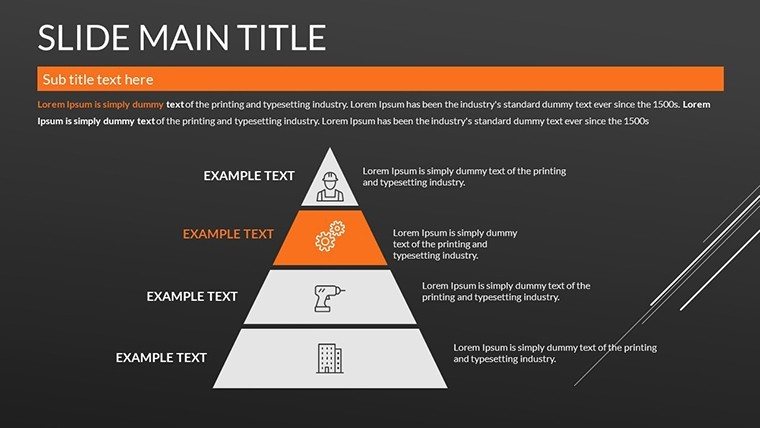
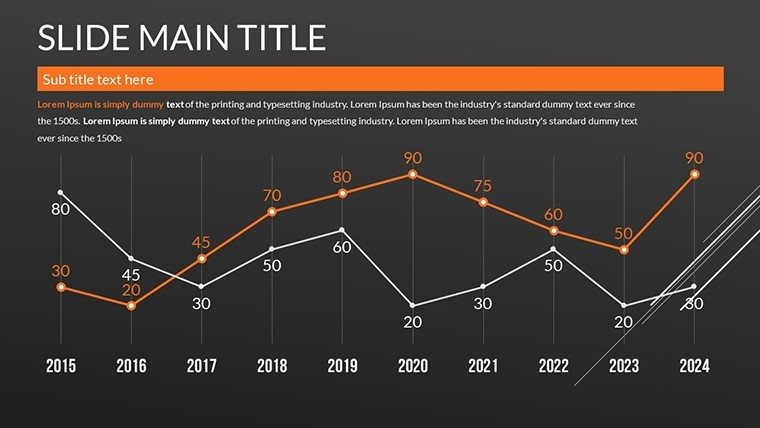
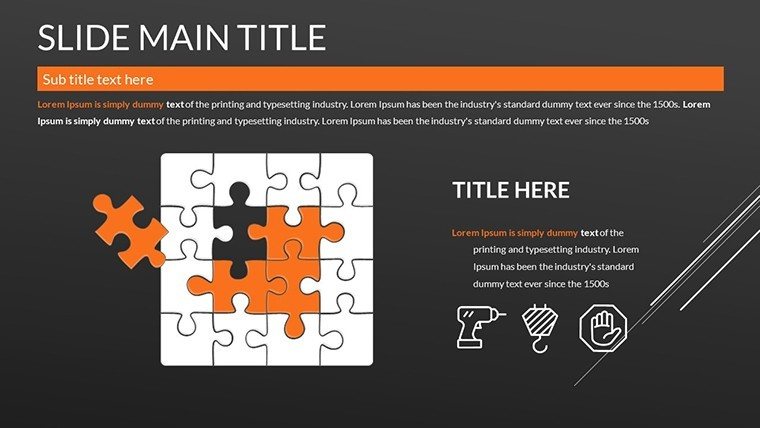
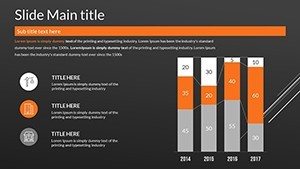
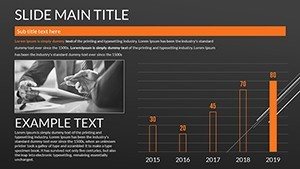
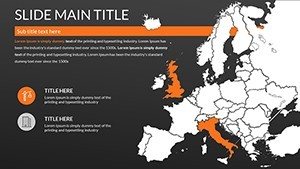
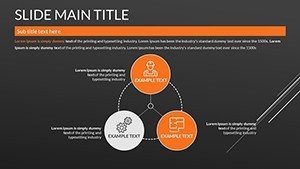
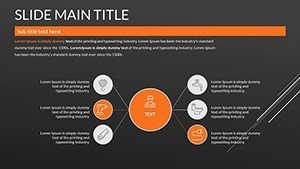
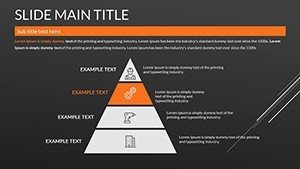
At the heart of this template lies a commitment to modern elegance. The 18 slides feature clean layouts with eye-catching color palettes that enhance readability without distracting from your message. For example, infographic slides allow you to visualize processes like customer journeys with flow diagrams, where arrows and icons guide the narrative flow. Graphs come in various forms - column charts for comparing sales figures across regions, or area charts for illustrating cumulative growth. Each element is customizable: Adjust hues to match your brand's vibrant scheme, or tweak fonts for a more formal tone.
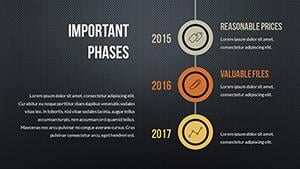
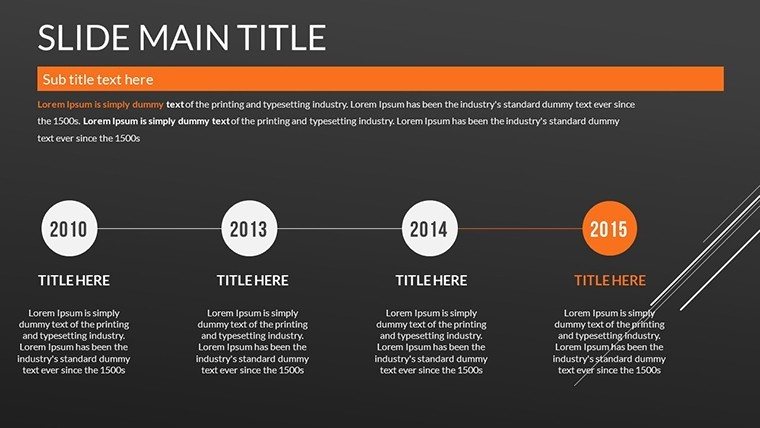
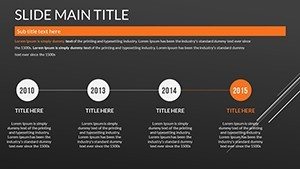
Complementing these are high-quality images and icons that add a professional polish. Think of embedding a timeline chart to outline project phases, complete with milestones that can be dragged and dropped for real-time updates during brainstorming sessions. In practice, companies like those in the Deloitte network use similar visuals in their consulting reports to clarify strategies, resulting in higher client satisfaction. This template empowers you to do the same, fostering a sense of expertise and reliability in your deliveries.
Practical Scenarios: Tailored for Business Success
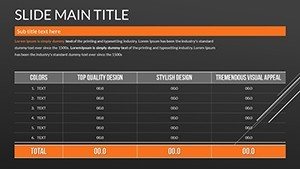
Applying this in real life is straightforward and impactful. For a sales presentation, kick off with an engaging cover slide, then dive into market analysis using bubble charts that plot competitor positioning based on size and revenue. This visual aid helps highlight opportunities, much like in Harvard Business Review case studies where data visualization led to breakthrough insights. In project proposals, utilize SWOT matrices with customizable quadrants to assess strengths and threats, providing a balanced view that reassures stakeholders.
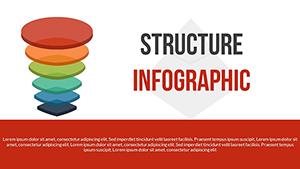
Marketing pros can benefit by creating campaign overviews with funnel charts, tracking leads from awareness to conversion - perhaps showing a 20% improvement post-implementation. For educational workshops, the template's interactive elements, like clickable hyperlinks in org charts, make sessions more engaging, akin to interactive e-learning modules. Even in investor briefings, financial projections via line graphs project confidence, backed by data from reliable sources like Bloomberg for added authority.
Streamlining Your Presentation Process
Integration is seamless, with full compatibility across PowerPoint versions and Google Slides for collaborative editing. Unlike stock templates that feel rigid, this one offers flexibility - resize graphs, add animations for emphasis, or incorporate your logos effortlessly. Users often report slashing prep time by half, allowing focus on content over design. A tip from design gurus: Use contrast effectively; pair dark backgrounds with light text for high-visibility slides, adhering to accessibility guidelines.
Compare this to basic tools: Where defaults might clutter with unnecessary elements, our template promotes brevity, ensuring each slide advances your story. In a case from a tech startup, adopting polished slideshows like this boosted funding rounds by presenting clear, investor-ready visuals.
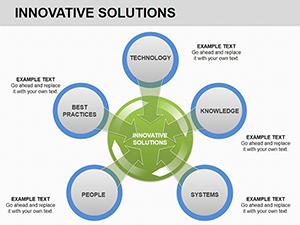
Addressing Pain Points with Innovative Solutions
Common hurdles like audience disengagement are tackled head-on. Dynamic charts keep viewers hooked, while pre-designed layouts prevent overload. For team meetings, agenda slides with progress bars track discussions, maintaining momentum. In client pitches, testimonial integrations via quote bubbles add credibility without extra effort.
Further, the template supports multimedia - embed videos in demo slides for product showcases, enhancing interactivity. This multifaceted approach ensures your presentations stand out in crowded fields, driving better results like increased conversions or team alignment.
The Ultimate Boost for Your Professional Toolkit
Ultimately, this Professional Business Slideshow PowerPoint Charts Template is about empowerment. Its blend of style, functionality, and ease makes it indispensable for anyone serious about communication. Elevate your game, impress your peers, and achieve your goals with visuals that speak volumes.
Don't wait - grab this template now and redefine your slideshows. Your audience deserves the best; deliver it with confidence.
Frequently Asked Questions
What makes this slideshow template stand out?
Its sleek design and customizable elements ensure professional, engaging presentations tailored to your needs.
How many editable slides does it include?
It features 18 fully editable slides with various charts and infographics.
Is it suitable for team collaborations?
Yes, compatible with Google Slides for easy sharing and editing.
Can I add my own images and icons?
Absolutely, the user-friendly interface allows seamless integration of custom assets.
What format is the file in?
It's available in .pptx for immediate download and use.