Promo code "00LAYOUTS"
SWOT Strategic Analysis PowerPoint Charts: Unlock Business Potential
Type: PowerPoint Charts template
Category: Business Models
Sources Available: .pptx
Product ID: PC00506
Template incl.: 18 editable slides
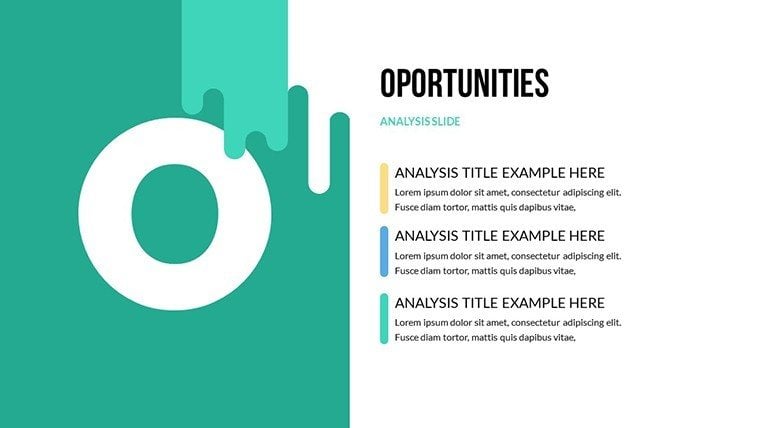
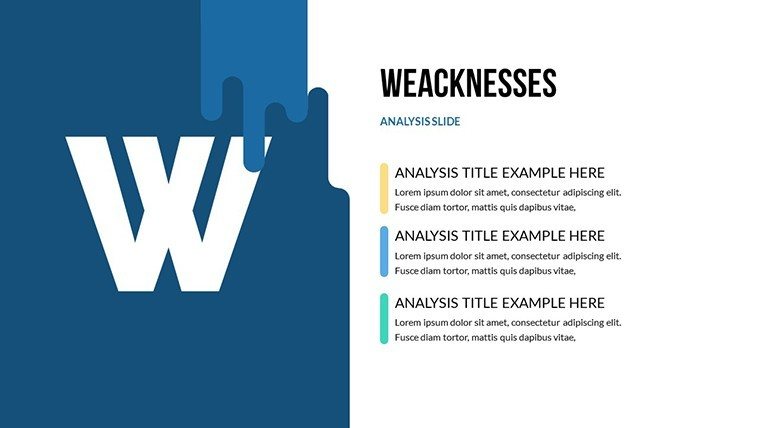
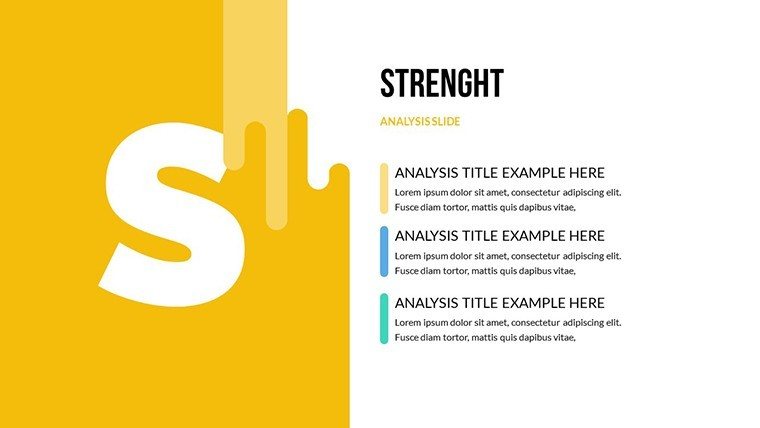
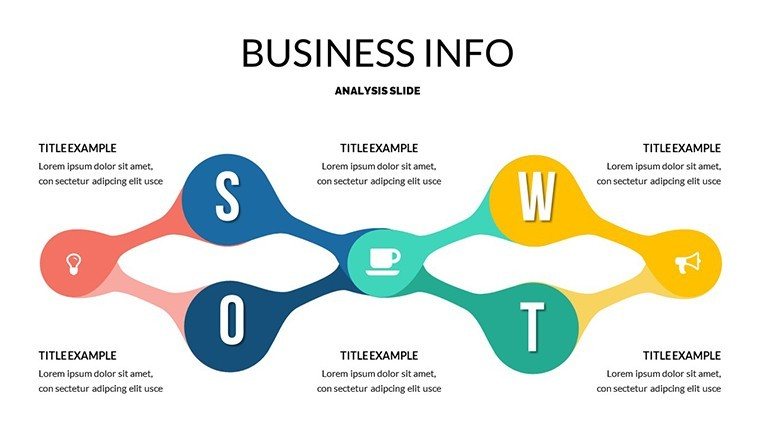
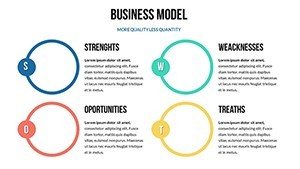
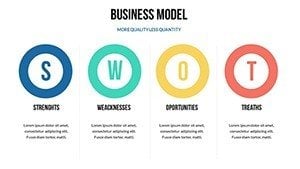
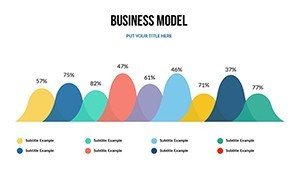
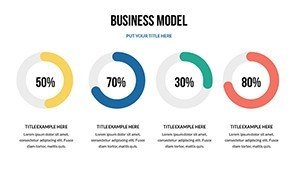
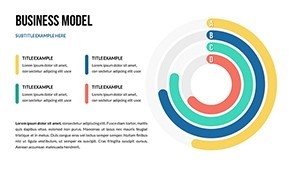
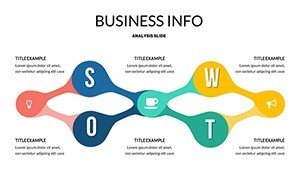
Strategic analysis forms the backbone of informed business decisions, and nothing encapsulates it better than a robust SWOT framework. Our SWOT - Strategic Analysis PowerPoint Charts Template provides 18 editable slides to dissect strengths, weaknesses, opportunities, and threats with precision and flair. Suited for executives, consultants, and entrepreneurs, it aligns with methodologies from sources like the Balanced Scorecard Institute, helping you craft strategies that stand out in competitive arenas.
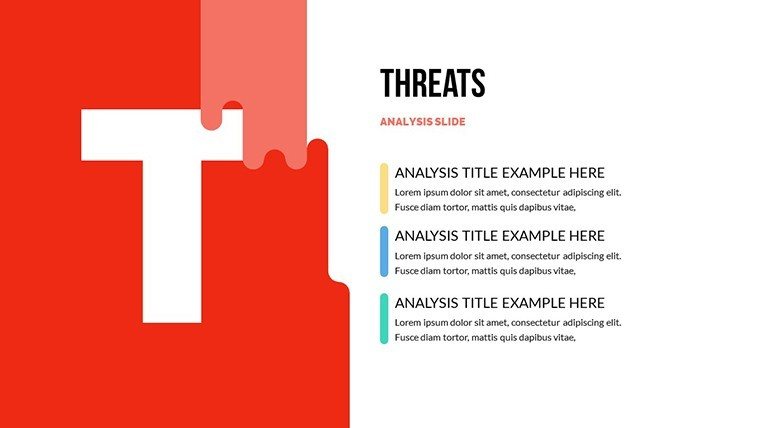
Visualize pivoting a startup's direction by highlighting market threats vividly, or guiding a team through internal audits with interactive matrices. This template's PowerPoint compatibility ensures it's a staple in your toolkit, blending ease with expertise.
Core Features Driving Strategic Excellence
Delve into features that make strategic planning intuitive and effective.
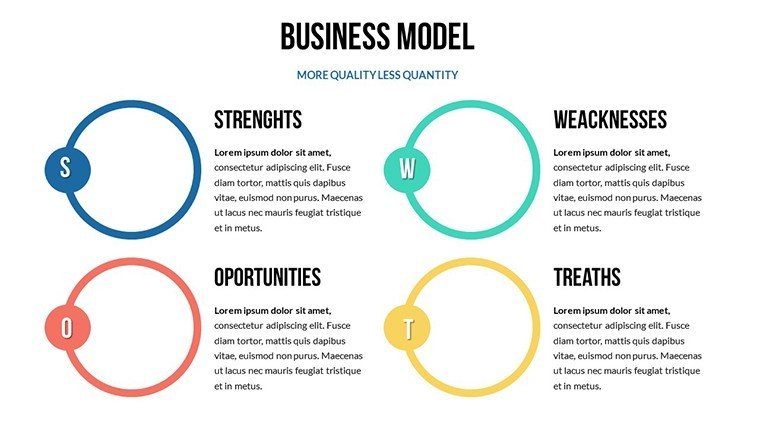
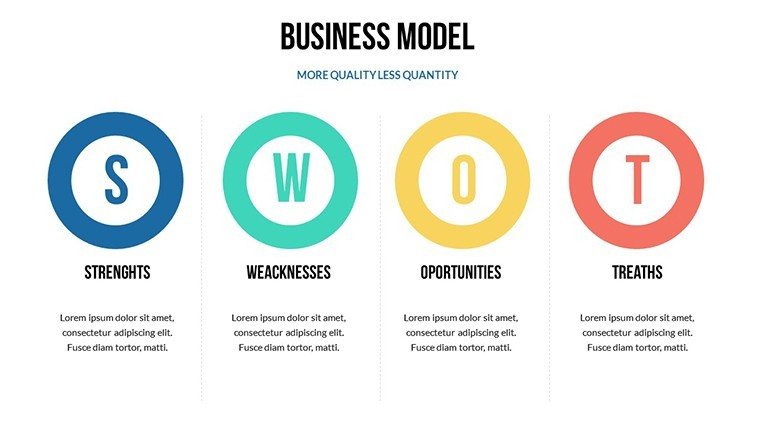
- SWOT-Specific Designs: Dedicated matrices and charts for each component.
- Editable Graphics: Icons, colors, and texts fully modifiable.
- Professional Icons: Enhance visuals with thematic elements.
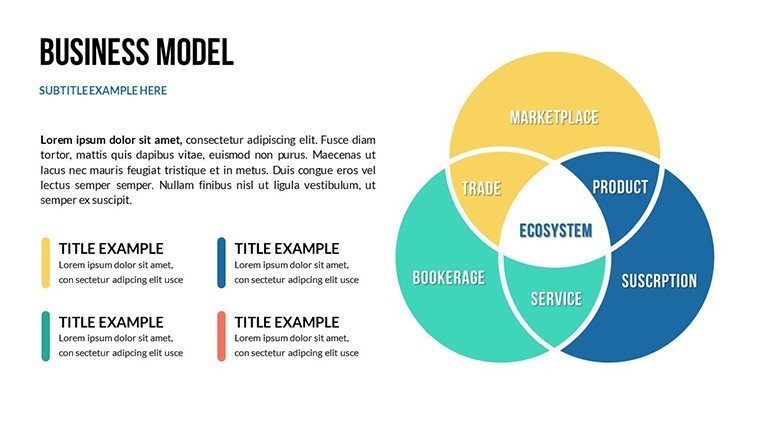
- Business Model Focus: Integrates with broader frameworks.
- Seamless Compatibility: Works across PPTX-supporting software.
It surpasses generic slides by offering tailored quadrants, ideal for nuanced analyses like those in Forbes business articles.
Targeted Use Cases for Maximum Impact
Consultants can present client audits using color-coded threats, echoing real cases from McKinsey reports. Entrepreneurs pitch to VCs with opportunity-focused slides, drawing from successful Kickstarter campaigns.
Academics illustrate theories, while marketers assess competitive edges in dynamic sectors like tech.
Strategic Deployment Guide
- Brainstorm SWOT elements collaboratively.
- Populate slides with data and visuals.
- Customize for audience relevance.
- Iterate based on feedback.
- Execute with actionable outcomes.
This mirrors processes in agile businesses like Google, where SWOT drives innovation.
Value Proposition and Pro Advice
Outperform basic tools with integrated visuals that clarify complexities, boosting strategy adoption rates. Trust its proven format for reliable results.
Expert tips: Prioritize high-impact items in bold, or use gradients for threat severity, per strategy gurus like Michael Porter.
Comprehensive Slide Details
Navigate the 18 slides:
- Slides 1-3: Overview and setup.
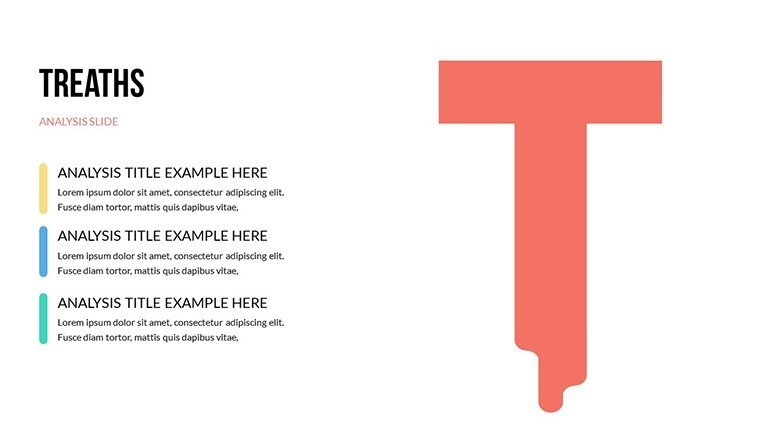
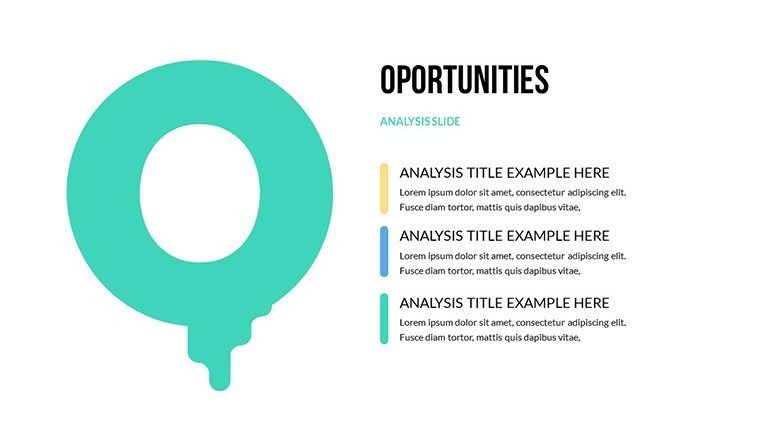
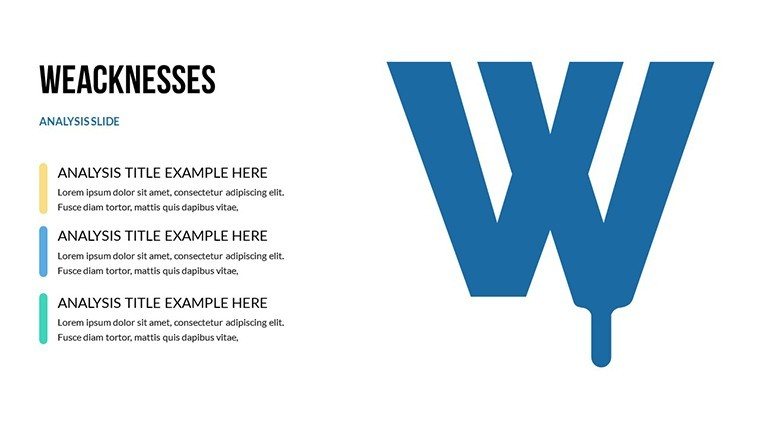
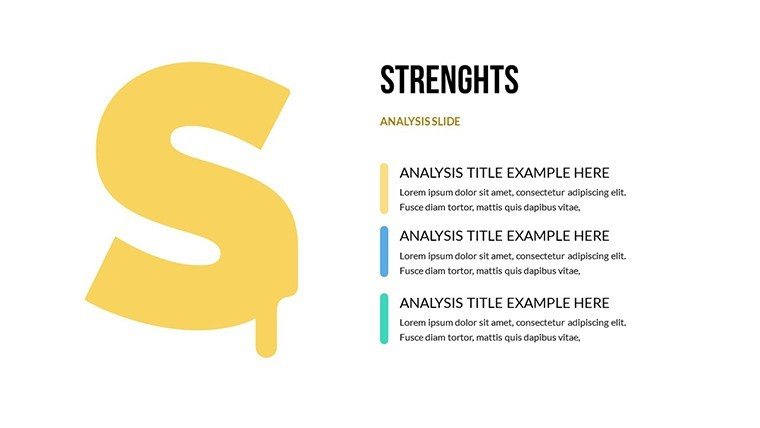
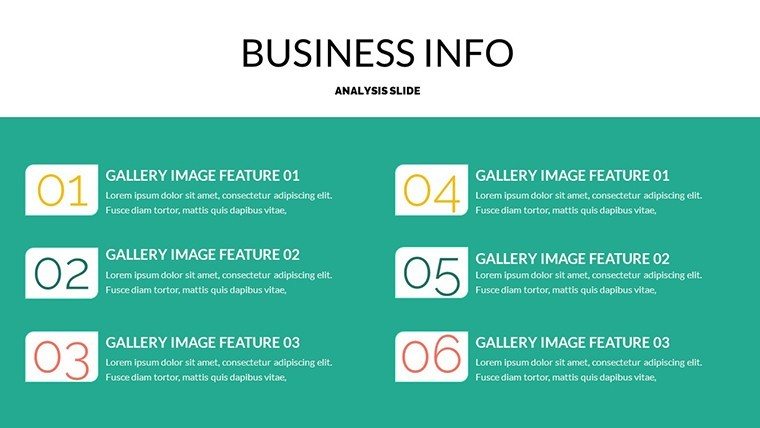
- Slides 4-10: In-depth SWOT breakdowns.
- Slides 11-15: Integration with other models.
- Slides 16-18: Action plans and summaries.
Easy-to-use for strategic novices and pros alike.
Blend in "strategic planning visuals" for organic discoverability.
Seize strategic superiority - secure this template and chart your path to success.
Frequently Asked Questions
- How detailed are the SWOT matrices?
- Multi-level with space for notes and priorities.
- Does it support other software?
- Yes, compatible with PowerPoint and similar.
- Ideal for group sessions?
- Perfect for workshops with editable fields.
- Can I add custom icons?
- Easily import and integrate your own.
- What's included in the download?
- Full .pptx file with all 18 slides.
- Any examples provided?
- Sample data to get started quickly.

