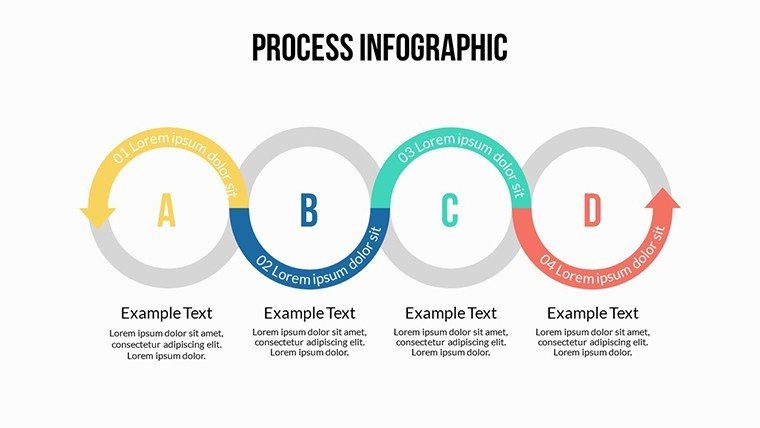
Process Infographic PowerPoint Charts: Map Out Technical Excellence


Type: PowerPoint Charts template
Category: Process
Sources Available: .pptx
Product ID: PC00502
Template incl.: 18 editable slides
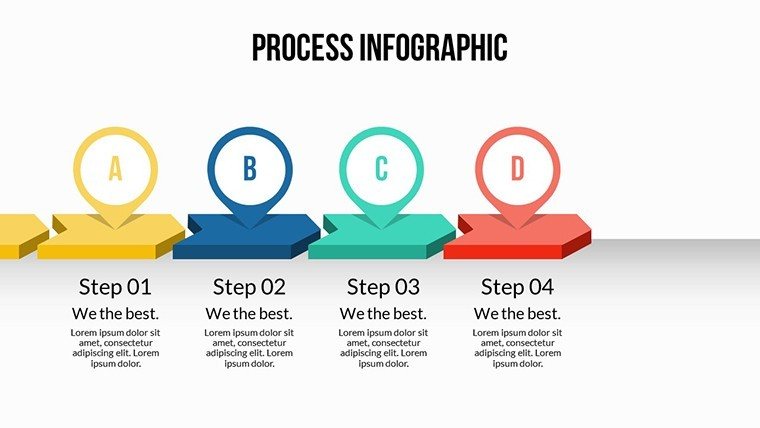
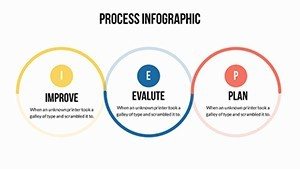
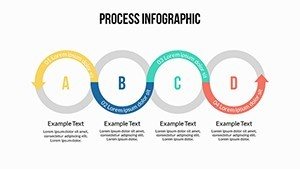
Navigating the intricacies of modern technology requires visuals that capture sequences with precision. Our Process Infographic PowerPoint Charts template provides 18 editable slides to diagram workflows, from software development cycles to engineering protocols. Tailored for IT professionals, engineers, and tech innovators, it emphasizes order and technical operations based on cutting-edge standards. As noted in IEEE publications, effective process mapping can enhance team productivity by 35%, and this template delivers just that. With infographics that highlight sequential steps, you can illustrate everything from agile methodologies to manufacturing pipelines, incorporating modern tech elements for relevance. This tool not only saves design effort but also ensures your presentations convey authority, fostering better collaboration and innovation in tech-driven environments.
Harnessing Infographics for Technical Processes
In the realm of technology, clarity in process depiction is paramount. This template uses infographic designs to sequence operations, drawing from frameworks like ISO 9001 for quality management. Slides feature structured layouts for depicting algorithms or system integrations, with editable components that adapt to your specs. For a devops team, map deployment pipelines with step indicators, using tech icons to represent servers or code branches. The focus on modern technologies ensures your visuals stay current, aiding in compliance audits or stakeholder briefings.
Core Features for Technical Visualization
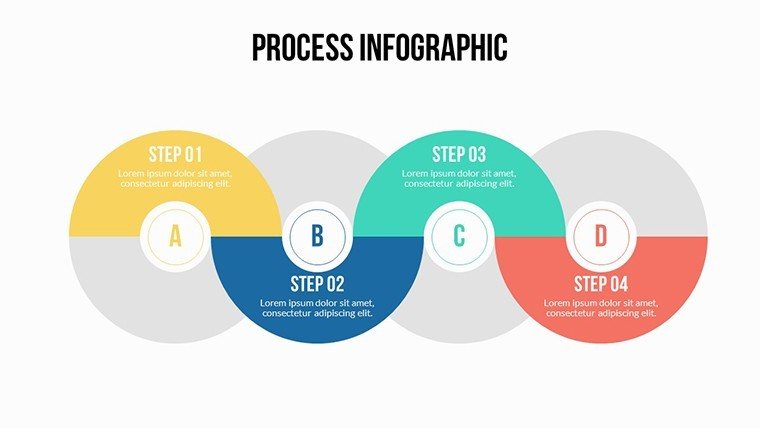
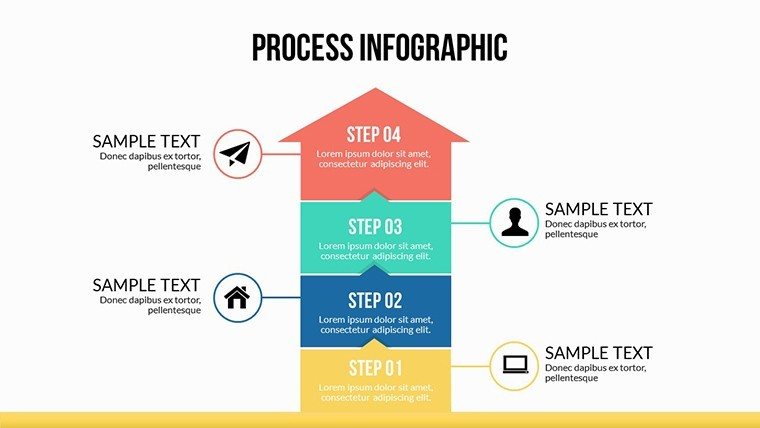
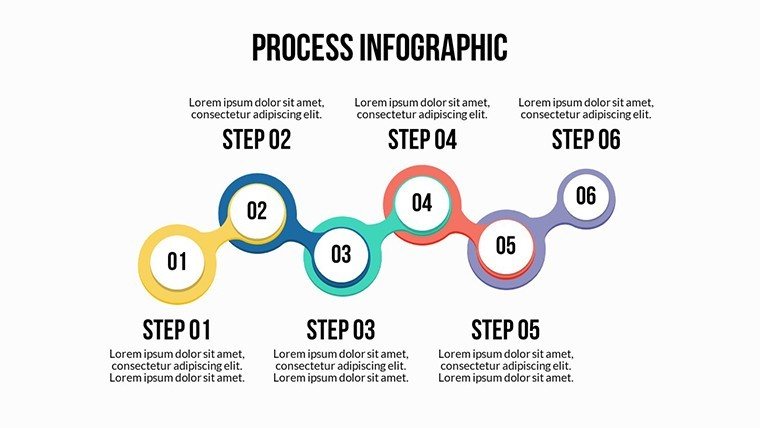
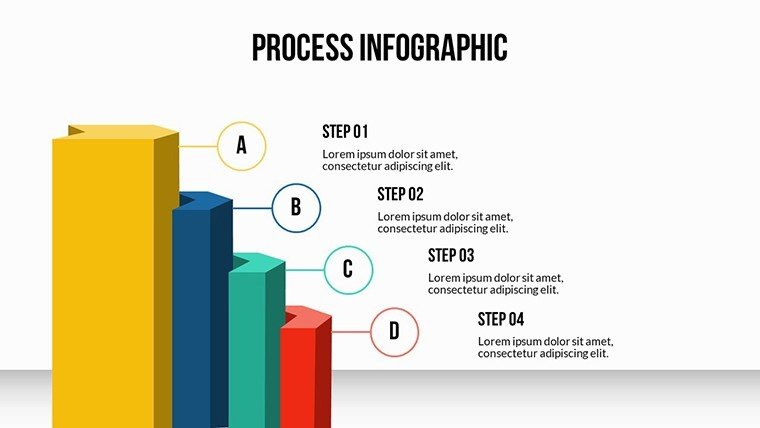
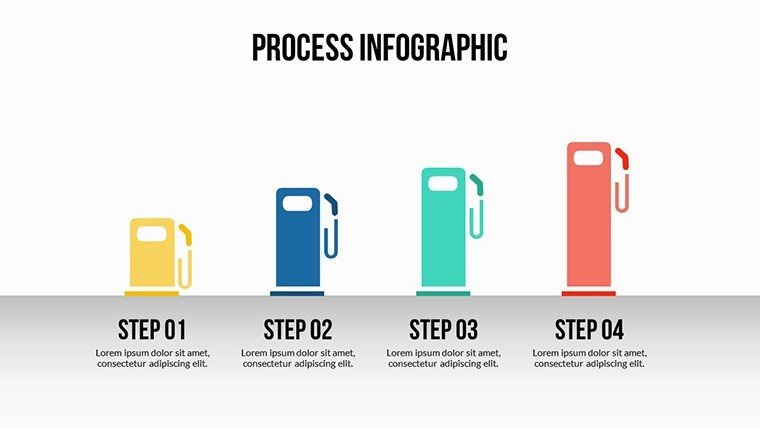
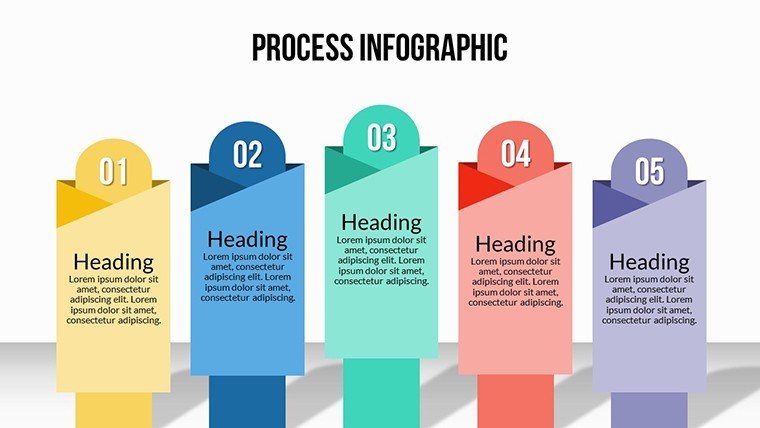
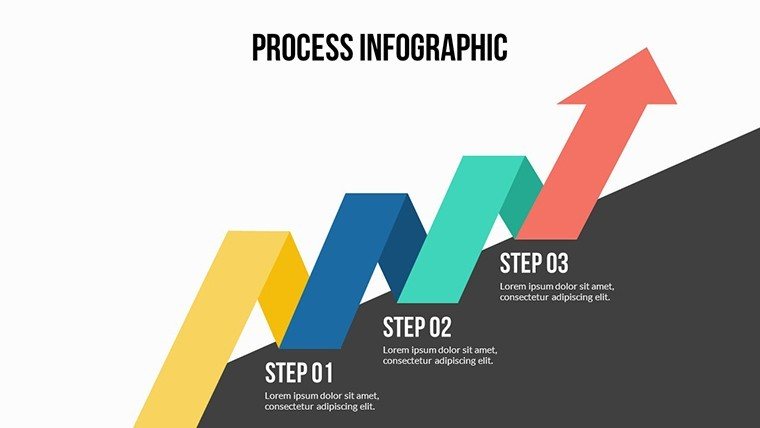
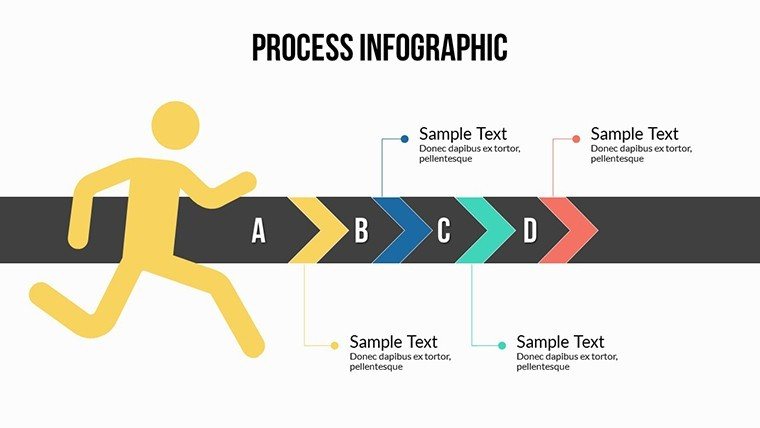
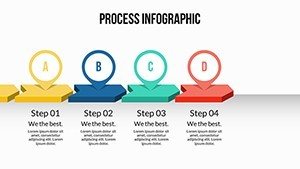
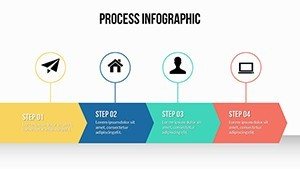
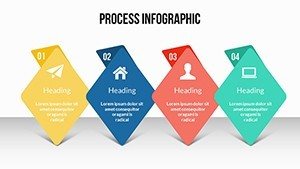
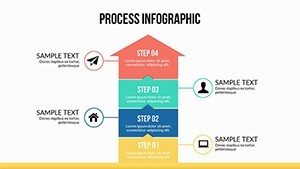
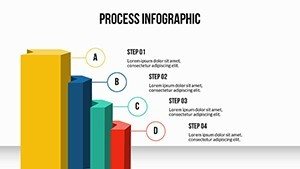
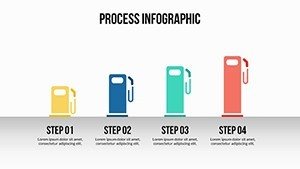
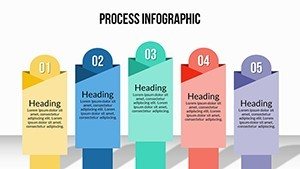
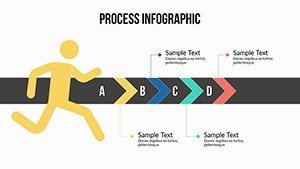
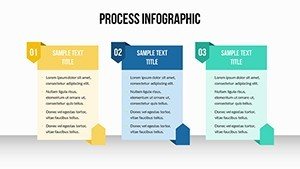
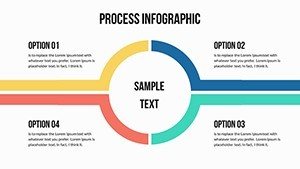
- Sequential Infographic Designs: Arrows and stages for clear process flows.
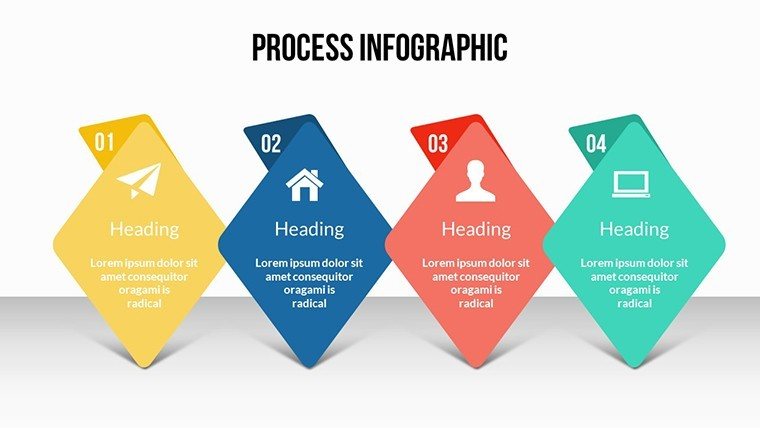
- Tech-Oriented Elements: Icons for databases, networks, and automation tools.
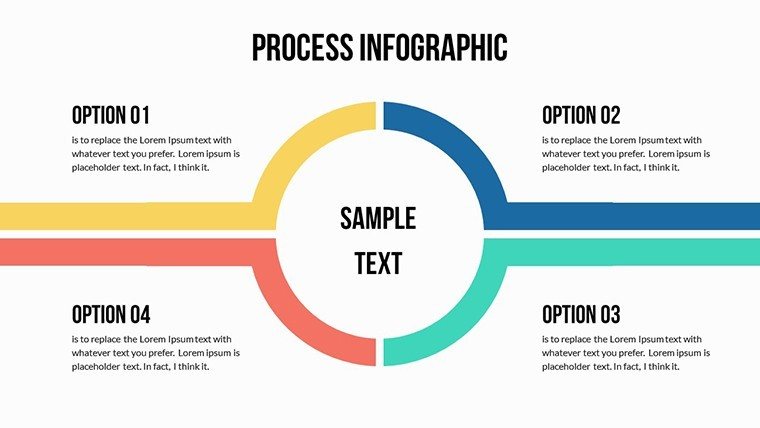
- Editable Layers: Customize text, shapes, and data for precision.
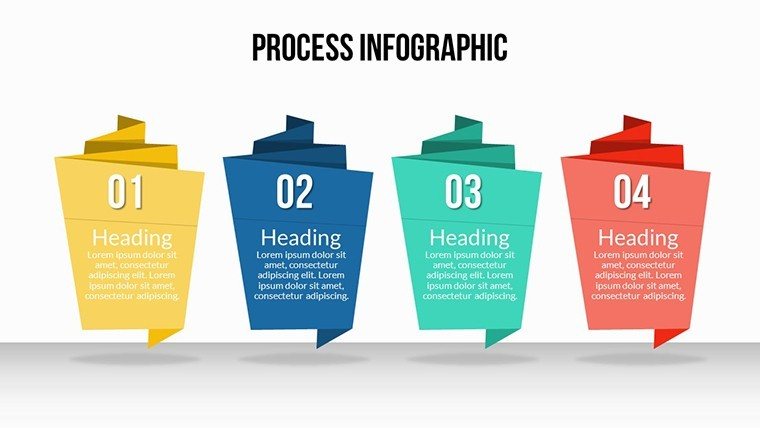
- Modern Aesthetic: Clean lines and colors suited to tech presentations.
- PowerPoint Optimization: Quick loads and edits on any version.
Aligned with practices from tech giants like Google, emphasizing scalable visuals.
Applications in Tech and Engineering Fields
Apply this template to diverse scenarios: Software engineers can outline CI/CD processes, mirroring GitHub workflows. In manufacturing, diagram assembly lines per Lean principles from the Society of Manufacturing Engineers. For cybersecurity, visualize threat response sequences, enhancing training as per NIST guidelines.
Crafting Your Process Infographic
- Choose a base slide for your operation type.
- Add steps and connect with arrows.
- Incorporate tech icons for context.
- Input specifics - timelines, responsibilities.
- Adjust visuals for emphasis.
- Export for sharing or integration.
Compatible with Visio for advanced diagramming.
Advantages Over Generic Charts
Standard tools lack tech specificity; this template offers tailored infographics for complex operations, reducing misinterpretation.
Expert Advice for Tech Infographics
- Use consistent icons: Standardize symbols for quick recognition.
- Highlight bottlenecks: Color-code critical paths.
- Scale for detail: Zoom-friendly for deep dives.
- Align with standards: Reference industry norms.
- Update dynamically: Easy revisions for evolving processes.
From agile coaches at Scrum Alliance.
Innovate Your Tech Narratives - Download Today
Unlock precise process mapping with this essential template.
Frequently Asked Questions
Are the charts fully editable for technical details?
Yes, every component can be modified.
Supports integration with other tools?
Yes, like Excel for data or Jira for project links.
Suitable for non-tech users?
Intuitive design makes it accessible.
What about animation additions?
Base is static, but PowerPoint animations can be applied.
License for enterprise use?
Yes, commercial-friendly.
How to handle complex processes?
Use multiple slides for breakdowns.