Infographic Creator PowerPoint Charts Template


In today's fast-paced world, where data drives decisions, presenting information in a visually compelling way is key to capturing attention and conveying messages effectively. Our Infographic Creator PowerPoint Charts template is designed specifically for professionals who need to turn raw data into engaging stories. With 22 fully editable slides, this template caters to a wide array of needs, from business analysts showcasing market trends to educators illustrating complex concepts. Imagine effortlessly creating matrix layouts that organize multifaceted data or 3D charts that add depth to your presentations, making them not just informative but memorable. This isn't just a template; it's a toolkit that empowers you to communicate with clarity and creativity, saving hours of design time while ensuring your slides look professional and polished.
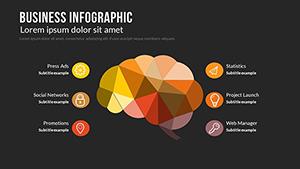
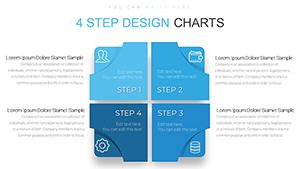
Discover the Versatility of Matrix and 3D Designs
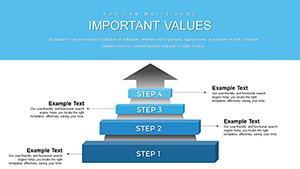
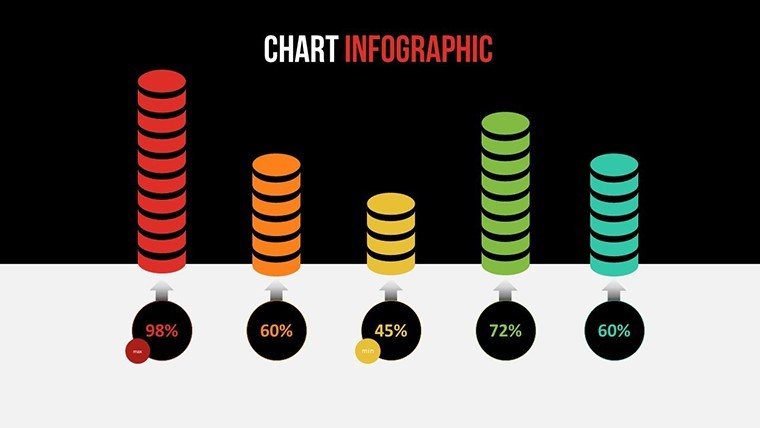
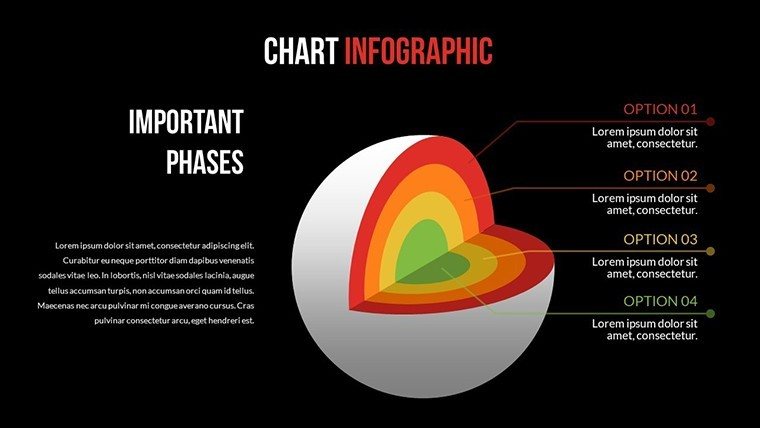
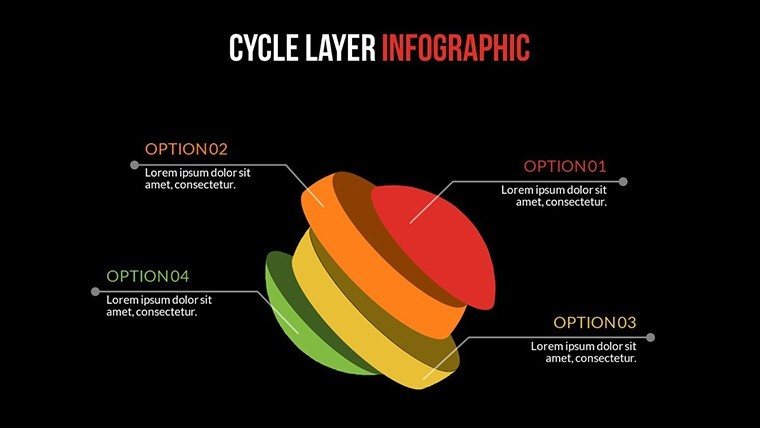
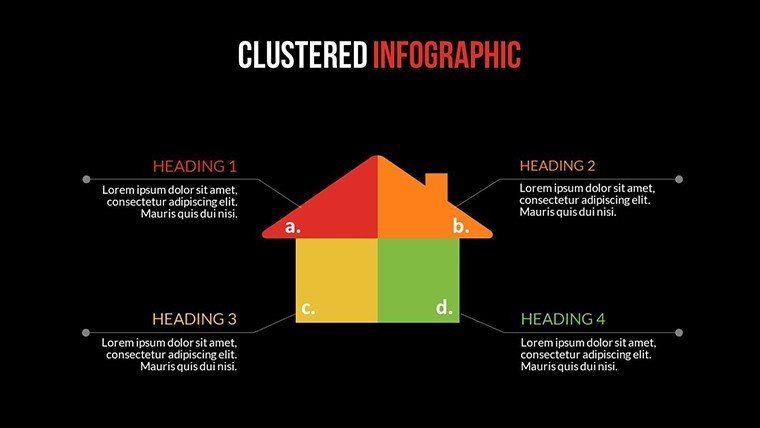
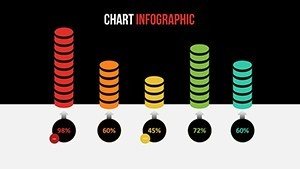
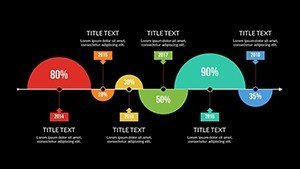
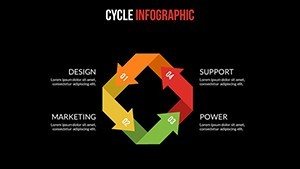
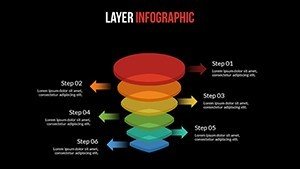
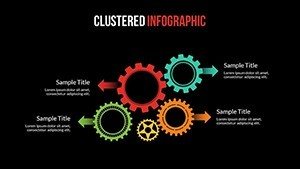
Dive deeper into what makes this template stand out. The matrix designs are perfect for comparative analyses, allowing you to juxtapose variables side by side for quick insights. For instance, if you're in marketing, use these to compare campaign performances across channels, highlighting wins and areas for improvement with color-coded cells that pop on screen. The 3D elements bring a dynamic flair, ideal for presenting volumetric data like sales growth over quarters, where the added dimension helps audiences grasp scale and progression intuitively. Each slide is built with high-definition graphics, ensuring crisp visuals even when projected in large venues. Customization is seamless - adjust colors to match your brand palette, tweak fonts for readability, or resize elements without losing quality. This flexibility means you can adapt the template to any theme, whether it's a corporate report or a creative pitch.
Real-World Applications That Drive Results
Consider how this template fits into your workflow. For a project manager overseeing a team, the matrix slides can map out task dependencies, clarifying roles and timelines to prevent bottlenecks. In a real-world scenario, a tech startup used similar matrix charts to pitch to investors, breaking down their go-to-market strategy into digestible segments, which helped secure funding by demonstrating organized thinking. Educators might leverage the 3D charts to teach statistical concepts, like population distributions, where the visual elevation makes abstract numbers tangible. The template's user-friendly interface means even those new to PowerPoint can produce pro-level outputs. Integrate it with data from Excel for live updates, or pair with animation tools for subtle transitions that keep viewers engaged without overwhelming them.
Step-by-Step Guide to Maximizing Your Slides
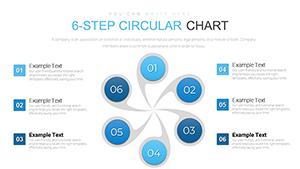
- Start by selecting a base slide that matches your data type - matrix for comparisons or 3D for depth.
- Import your data directly into the placeholders, watching as the charts auto-adjust for accuracy.
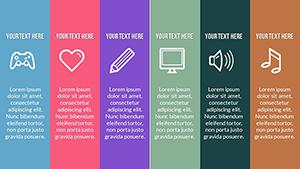
- Customize aesthetics: Choose from predefined themes or create your own for brand consistency.
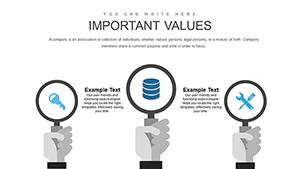
- Add annotations or icons from the built-in library to emphasize key points.
- Preview in slideshow mode, tweaking transitions for smooth flow.
- Export or present, confident in a polished delivery.
This structured approach not only streamlines creation but also enhances audience retention, as studies from presentation experts like those at Duarte Design show that visual aids increase recall by up to 65%.
Why This Template Outshines Basic PowerPoint Tools
Compared to standard PowerPoint features, our template offers pre-built sophistication that basic charts lack. While default options might suffice for simple bar graphs, they fall short on customization and visual appeal. Here, you'll find themed icons, gradient fills, and shadow effects that elevate your content to infographic quality, akin to tools used in award-winning TED Talks. For data analysts, this means less time fiddling with alignments and more on insights. The HD quality ensures no pixelation, crucial for virtual meetings via Zoom or Teams. Plus, with compatibility across PowerPoint versions and even Google Slides imports, accessibility is never an issue.
Enhance Your Workflow with Pro Tips
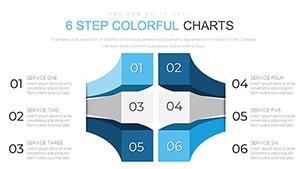
- Use color psychology: Blues for trust in financial data, greens for growth in sustainability reports.
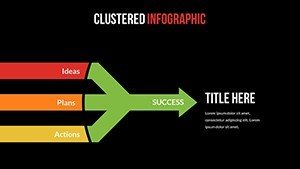
- Incorporate storytelling: Sequence slides to build a narrative arc, starting with problems and ending with solutions.
- Optimize for mobile: Ensure charts are legible on smaller screens for on-the-go reviews.
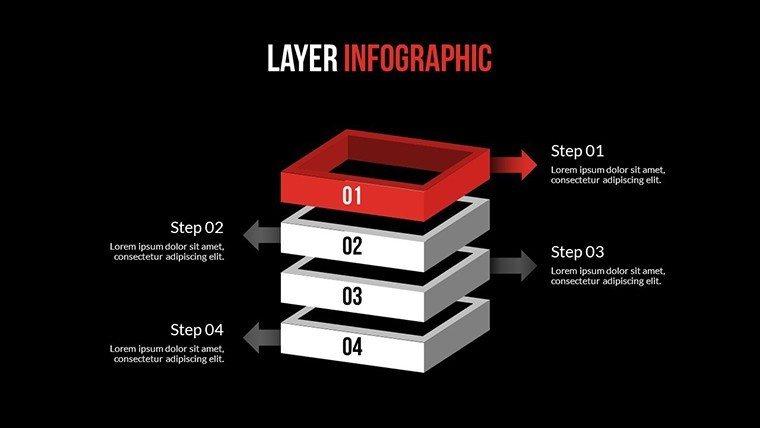
- Leverage layers: Stack elements in 3D views to reveal hidden insights on hover or click.
- Test accessibility: Add alt text to charts for screen readers, promoting inclusivity.
These tips, drawn from years of design expertise, help you create presentations that not only inform but inspire action.
As you integrate this template into your routine, you'll notice improved engagement - audiences leaning in, asking questions, and remembering your key messages long after. It's more than slides; it's a bridge between data and decision-making. Ready to revolutionize how you present? Download our Infographic Creator PowerPoint Charts template and start crafting visuals that truly resonate.
FAQ
How customizable are the matrix designs?
The matrix slides are fully editable, allowing you to adjust rows, columns, colors, and data inputs to fit any dataset precisely.
Can I use this template in Google Slides?
Yes, simply upload the .pptx file to Google Drive and open with Slides for seamless compatibility and editing.
What if I need more than 22 slides?
You can duplicate existing slides and modify them, or contact support for custom expansions tailored to your needs.
Are the 3D charts interactive?
While static in base form, you can add hyperlinks or animations in PowerPoint for interactive elements during presentations.
Is there a tutorial included?
Each download comes with a quick-start guide, plus online resources for advanced tips.
What's the file format?
The template is provided in .pptx format, compatible with Microsoft PowerPoint 2010 and later versions.