00% off everything!
SALE ENDS TODAY, Saturday November 0
Promo code "00LAYOUTS"
Time Left to Save
00:00:00

Professional Business PowerPoint Charts: Drive Decisions with Data

5
631 ratings
Professional Business PowerPoint Charts: Drive Decisions with Data - Slide #0
Professional Business PowerPoint Charts: Drive Decisions with Data - Slide #1
Professional Business PowerPoint Charts: Drive Decisions with Data - Slide #2
Professional Business PowerPoint Charts: Drive Decisions with Data - Slide #3
Professional Business PowerPoint Charts: Drive Decisions with Data - Slide #4
Professional Business PowerPoint Charts: Drive Decisions with Data - Slide #5
Professional Business PowerPoint Charts: Drive Decisions with Data - Slide #6
Professional Business PowerPoint Charts: Drive Decisions with Data - Slide #7
Professional Business PowerPoint Charts: Drive Decisions with Data - Slide #8
Professional Business PowerPoint Charts: Drive Decisions with Data - Slide #9
Professional Business PowerPoint Charts: Drive Decisions with Data - Slide #10
Professional Business PowerPoint Charts: Drive Decisions with Data - Slide #11
Professional Business PowerPoint Charts: Drive Decisions with Data - Slide #12
Professional Business PowerPoint Charts: Drive Decisions with Data - Slide #13
Professional Business PowerPoint Charts: Drive Decisions with Data - Slide #14
Professional Business PowerPoint Charts: Drive Decisions with Data - Slide #15
Professional Business PowerPoint Charts: Drive Decisions with Data - Slide #16
Professional Business PowerPoint Charts: Drive Decisions with Data - Slide #17
Professional Business PowerPoint Charts: Drive Decisions with Data - Slide #18
Professional Business PowerPoint Charts: Drive Decisions with Data - Slide #19
Professional Business PowerPoint Charts: Drive Decisions with Data - Slide #20
Professional Business PowerPoint Charts: Drive Decisions with Data - Slide #21
Professional Business PowerPoint Charts: Drive Decisions with Data - Slide #22
Professional Business PowerPoint Charts: Drive Decisions with Data - Slide #23
thumbnail slide #0
thumbnail slide #1
thumbnail slide #2
thumbnail slide #3
thumbnail slide #4
thumbnail slide #5
thumbnail slide #6
thumbnail slide #7
thumbnail slide #8
thumbnail slide #9
thumbnail slide #10
thumbnail slide #11
thumbnail slide #12
thumbnail slide #13
thumbnail slide #14
thumbnail slide #15
thumbnail slide #16
thumbnail slide #17
thumbnail slide #18
thumbnail slide #19
thumbnail slide #20
thumbnail slide #21
thumbnail slide #22
thumbnail slide #23

Type: PowerPoint Charts template

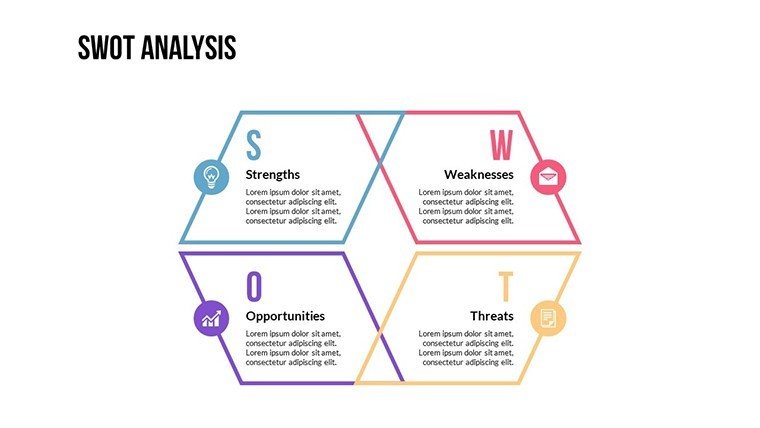
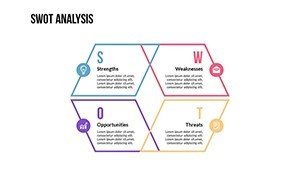
Category: Business Models

Sources Available: .pptx

Product ID: PC00487

Template incl.: 24 editable slides

Purchase this template
$ 24.00

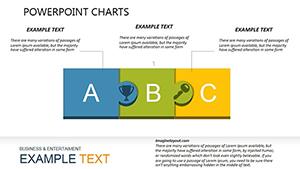
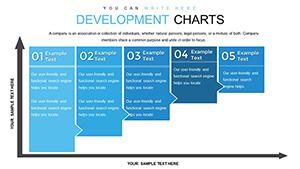
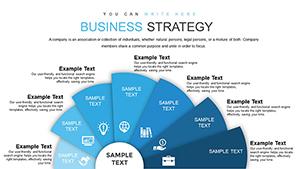
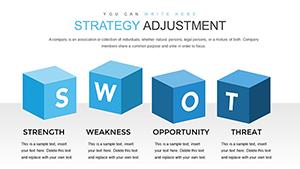
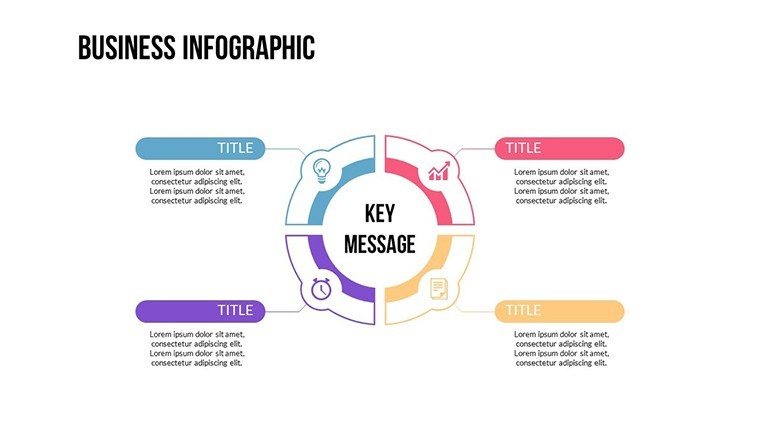
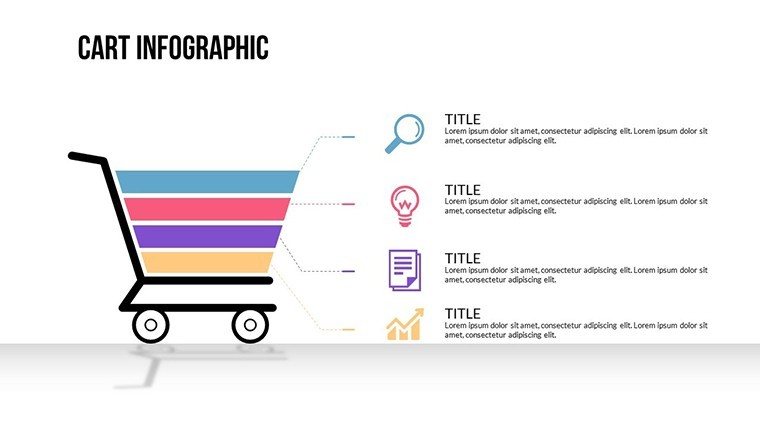
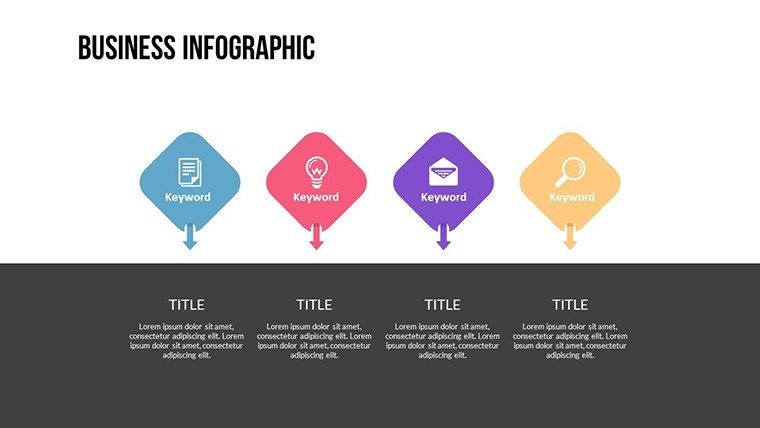
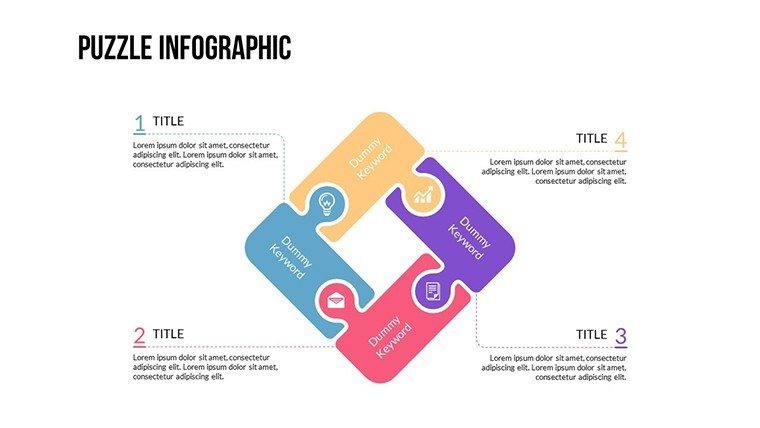
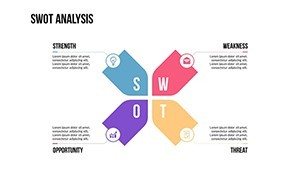
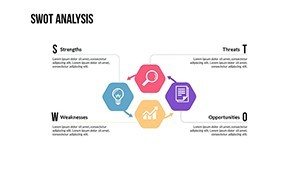
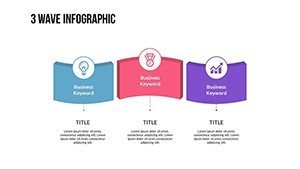
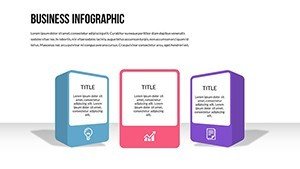
In the competitive business arena, clear communication of data can seal deals and inspire teams. Visualize transforming complex metrics into accessible visuals that command attention. Our TOP Business PowerPoint Charts Template provides 24 editable slides, focusing on business models with line graphs, pie charts, and more. Tailored for CEOs, marketers, and instructors, it simplifies presenting vital information professionally. Based on insights from Harvard Business Review on effective visuals, this template helps you convey strategies, sales data, or educational content with precision. It's more than charts; it's a pathway to persuasion, enhancing understanding and fostering informed decisions in high-stakes environments.

Core of Business Visualization

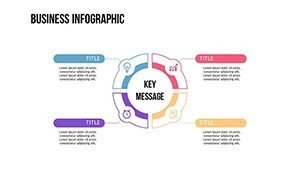
This template excels in turning data into stories, with customizable elements for any business narrative. Edit graphs to reflect real-time data, as seen in corporate reports from firms like McKinsey.

Key Features for Business Pros

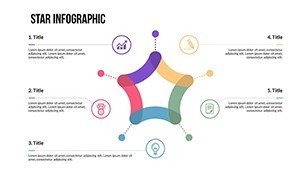
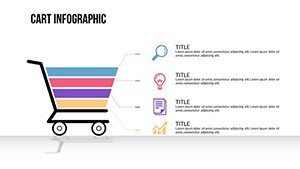
  • Varied Chart Types: Line, pie, bar for diverse needs.
  • Customization Ease: User-friendly for quick edits.
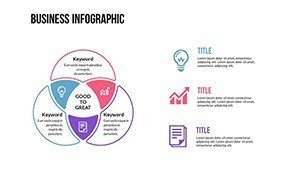
  • High-Quality Design: Professional aesthetics.
  • Integration: Seamless with PowerPoint.
  • Visual Enhancements: Graphics for impact.

Aligned with business communication standards.

Applications in Business and Beyond

For executives, present KPIs; marketers, campaign results; educators, concepts. A marketer case: Boosted engagement using pie charts.

Usage Guide

  1. Select chart type.
  2. Input data.
  3. Customize visuals.
  4. Add narratives.
  5. Present confidently.

Tips: Keep simple for clarity.

Why Choose This Template

Outperforms basics with quality, saving time. Versatile for industries.

Include "business graph models" naturally.

Empower Your Business Now

Download and transform your presentations.

Frequently Asked Questions

How customizable are the charts?

Fully, from data to design.

Ideal for which users?

Executives, marketers, educators.

Supports large data sets?

Yes, scalable.

Google Slides compatible?

Yes.

Includes templates for models?

Yes, business-specific.

Animation features?

Built-in for engagement.