Marketing PowerPoint Charts Template: Craft Compelling Data Stories


Type: PowerPoint Charts template
Category: Relationship
Sources Available: .pptx
Product ID: PC00484
Template incl.: 16 editable slides
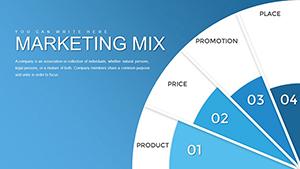
In the dynamic realm of marketing, where data drives decisions and visuals seal deals, our Marketing PowerPoint Charts Template emerges as an indispensable ally. Tailored for marketing experts, sales teams, and business analysts, this 16-slide powerhouse turns raw statistics into narrative gold. Picture effortlessly illustrating campaign ROI or customer segmentation without wrestling with design tools - that's the promise here. With a foundation in proven marketing frameworks like the 4Ps (Product, Price, Place, Promotion), this template helps you align presentations with strategic goals, much like how Coca-Cola uses data visuals to refine global strategies. It's not just slides; it's a time-saver that enhances your authority, ensuring every pitch or report leaves a mark. Dive in and discover how these charts can transform your workflow from chaotic to cohesive.
Essential Features for Seamless Customization
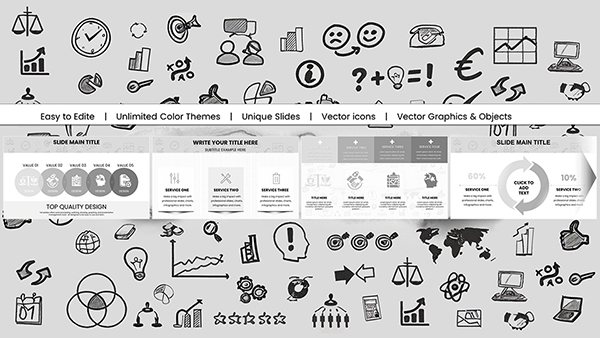
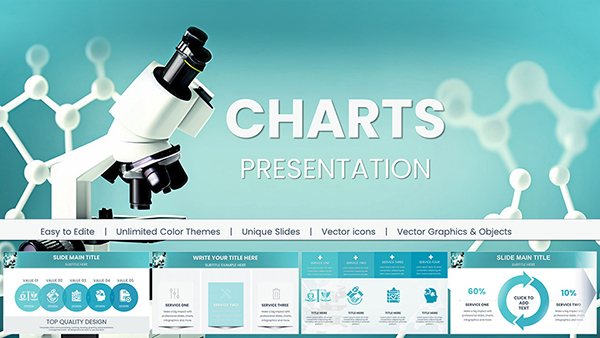
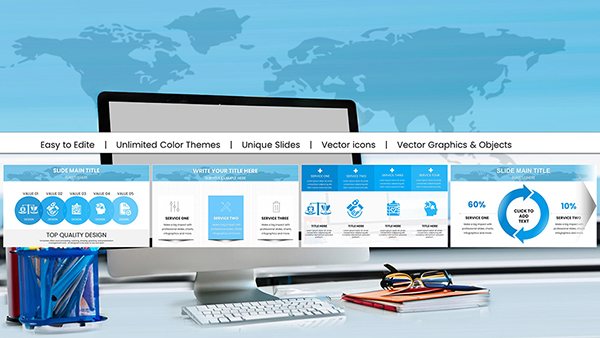
What makes this template a must-have? Its blend of versatility and simplicity. Boasting 16 editable slides, it includes a spectrum of chart formats - from classic bar graphs for sales comparisons to interactive pie charts for market share breakdowns. Each element is data-driven, allowing real-time updates via Excel-linked placeholders, a feature that outshines basic PowerPoint defaults. Customization extends to themes: choose from vibrant color schemes to evoke energy or muted tones for corporate sobriety. Add in audience engagement tools like hover effects and transitions, and you've got a presentation that feels alive. For marketing pros juggling tight deadlines, these features mean less time formatting and more strategizing - echoing efficiency tips from experts at HubSpot, where visual data reduces miscommunication by 40%.
In-Depth Look at Slide Components
- Slide 1: Overview Dashboard - A central hub with summary charts for quick campaign snapshots.
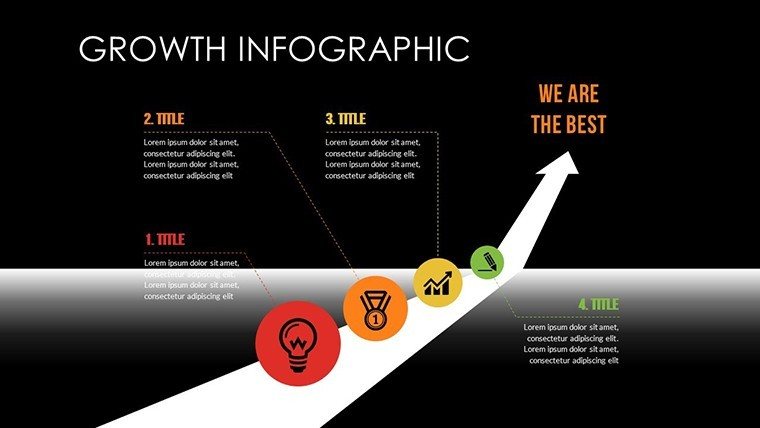
- Slides 2-4: Performance Metrics - Line and area graphs to track trends like website traffic over time.
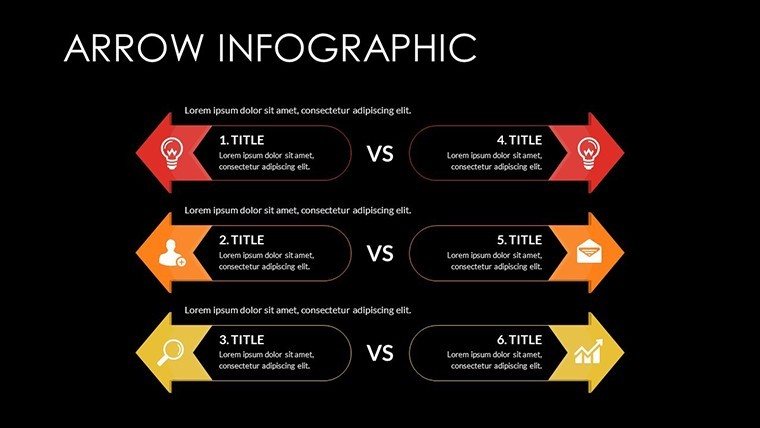
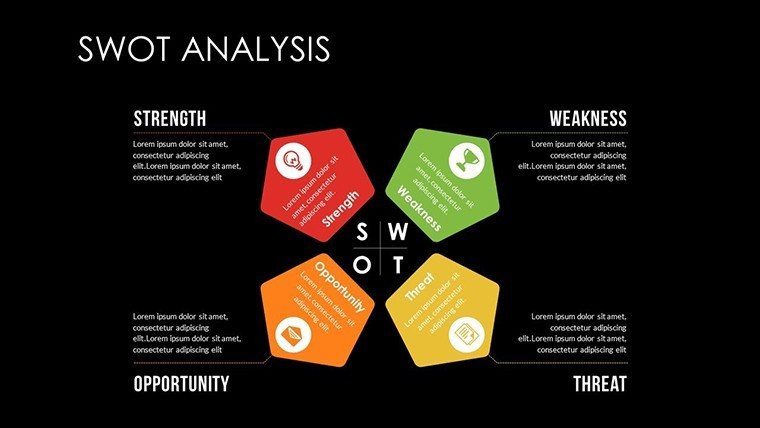
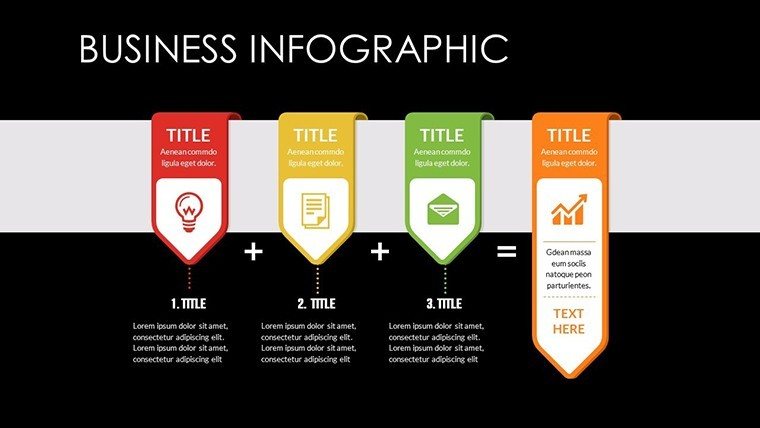
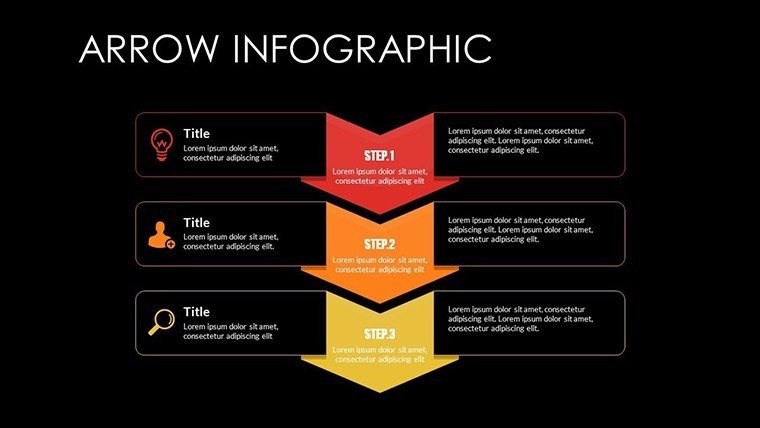
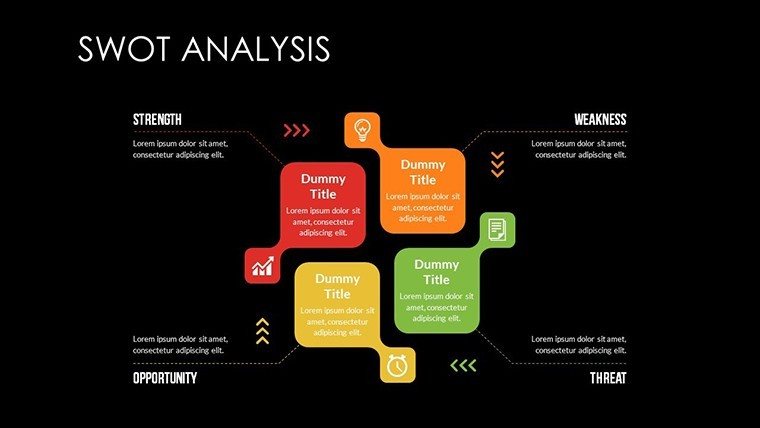
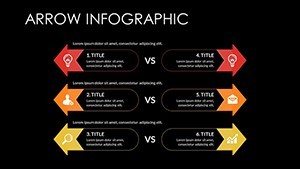
- Slides 5-8: Comparative Analysis - Stacked bars and radars for competitor benchmarking.
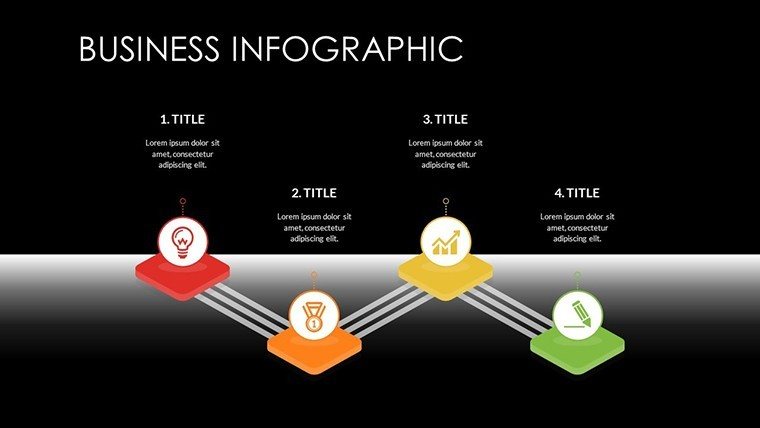
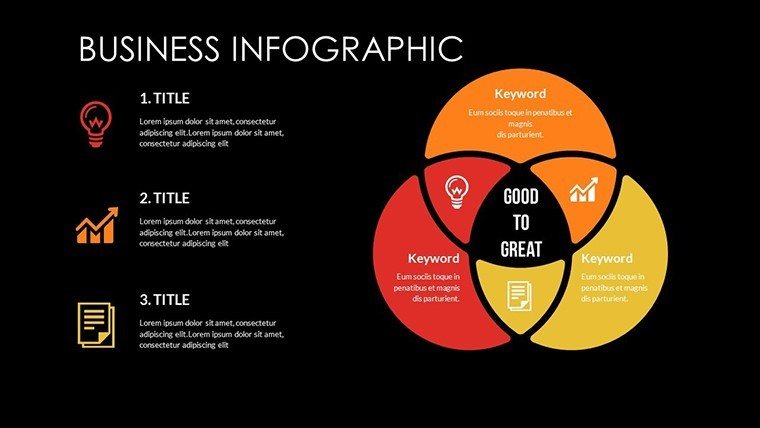
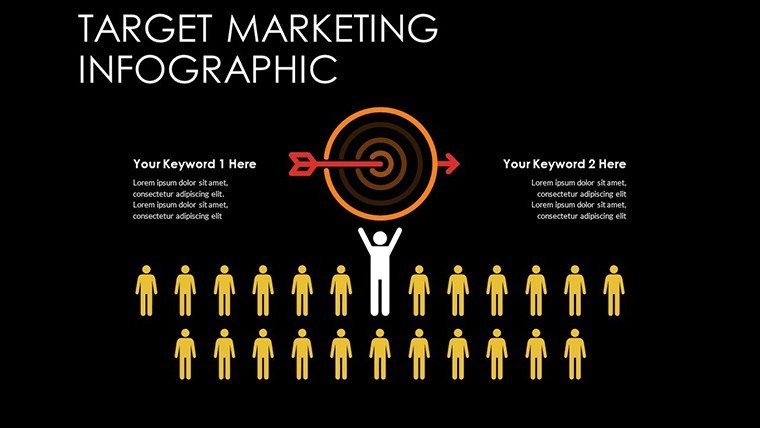
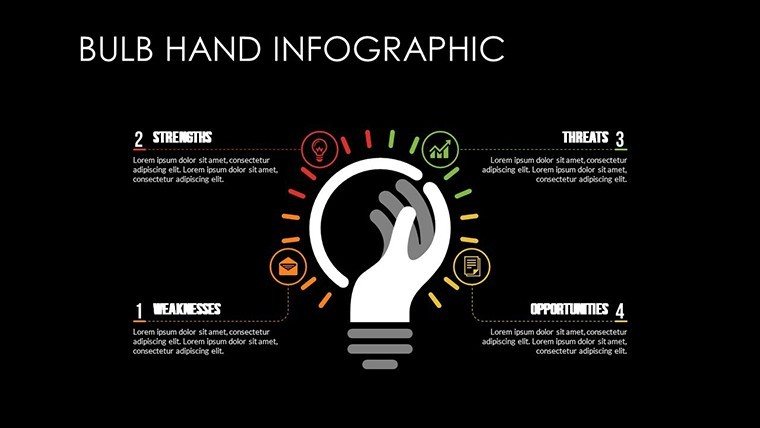
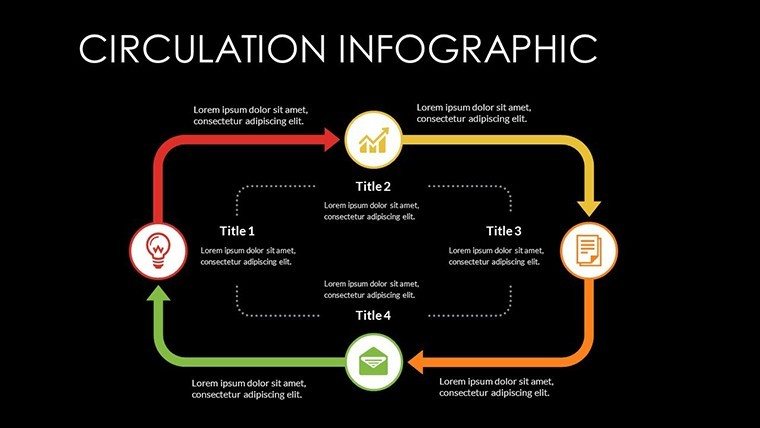
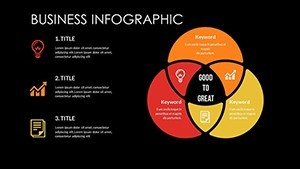
- Slides 9-12: Segmentation Visuals - Donut charts and heat maps for audience demographics.
- Slides 13-15: Forecasting Tools - Scatter plots and trend lines for predictive insights.
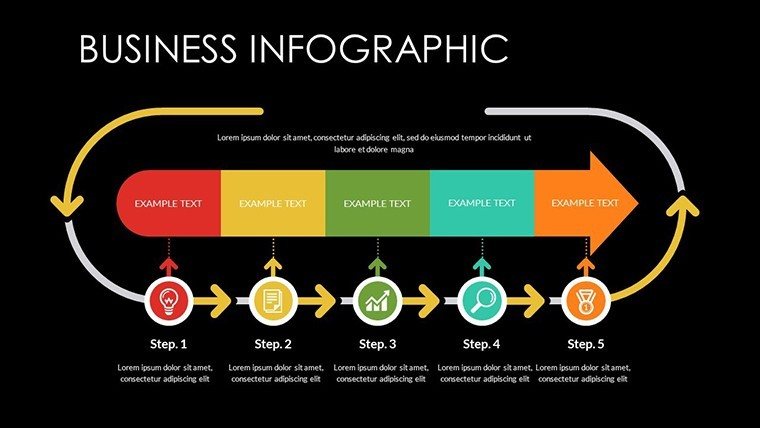
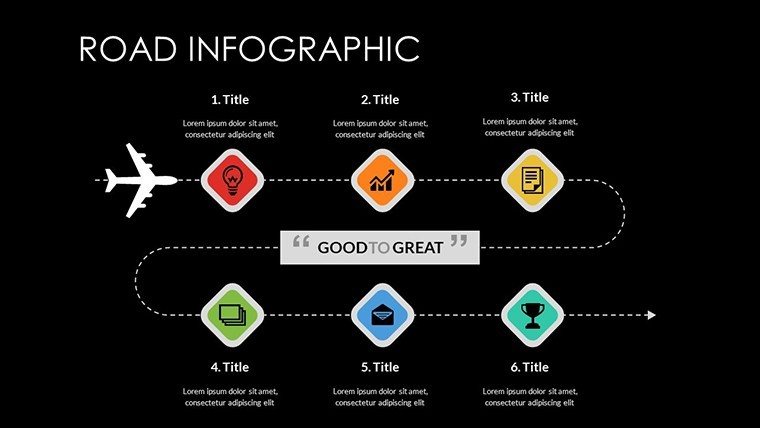
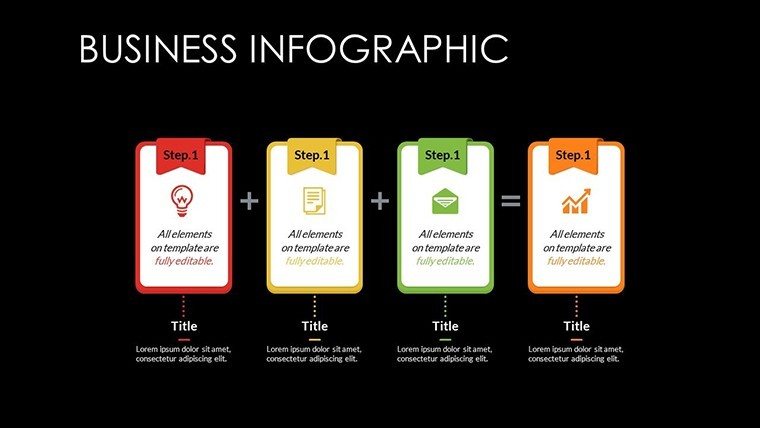
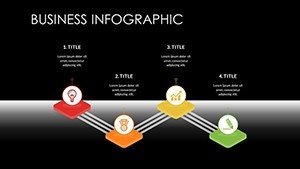
- Slide 16: Summary and Next Steps - Integrated infographics to recap and prompt actions.
These aren't static; embed videos of ad demos or audio clips for testimonials, expanding beyond traditional slides.
Practical Use Cases Tailored to Marketing Challenges
This template excels in real scenarios. For quarterly sales reports, use the performance metrics slides to highlight upsells, integrating data from CRM systems like Salesforce. In client pitches, leverage comparative charts to showcase strategy superiority, drawing on case studies like Pepsi's market trend analyses. Step-by-step: Import your dataset into Slide 2, customize axes for clarity, animate reveals for drama, and export for sharing. Consultants find it invaluable for workshops, where segmentation visuals facilitate discussions on targeting. Compared to stock templates, ours offers deeper LSI integration - like "marketing analytics dashboards" - boosting SEO if your deck goes viral on LinkedIn. It solves pain points like data silos by promoting unified visuals, fostering team alignment and client trust.
Pro Tips to Maximize Presentation Effectiveness
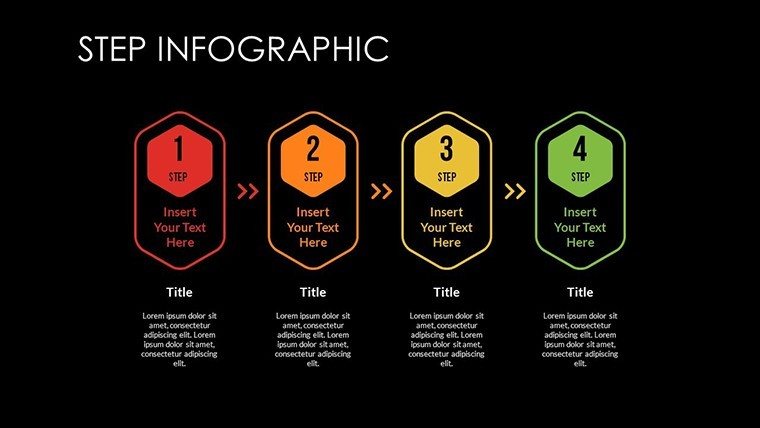
- Layer data progressively: Build charts step-by-step to guide audience understanding.
- Brand consistently: Use template tools to apply logos across all slides instantly.
- Engage interactively: Add hyperlinks to external reports for deeper dives.
- Avoid overload: Limit to 5-7 data points per chart, per Edward Tufte's data-ink ratio principle.
- Iterate based on feedback: Post-use, refine with A/B testing on chart styles.
These strategies position you as an expert, turning presentations into memorable experiences.
The Value Proposition: Why This Template Wins
Unlike rudimentary options, our template's professional-grade elements - like vector icons for quick swaps - ensure scalability and polish. Compatible with PowerPoint and Google Slides, it's trusted for its reliability, mirroring standards from marketing gurus at Gartner. With elements like "customizable marketing graphs," it naturally enhances discoverability. Invest in this, and watch your influence grow - download now to redefine your marketing narratives.
Frequently Asked Questions
- What chart types are included?
- A variety including bars, pies, lines, and more, all fully editable for your data.
- Does it support data import from Excel?
- Yes, link directly for automatic updates and accuracy.
- Is animation customizable?
- Absolutely - adjust timings and effects to fit your pacing.
- Can I use it on Mac or PC?
- Compatible across platforms with PowerPoint installed.
- How does it handle large datasets?
- Efficiently, with scalable vectors preventing quality loss.