Process Infographic PowerPoint Template - Fully Editable & Instant Download


Type: PowerPoint Charts template
Category: Process
Sources Available: .pptx
Product ID: PC00480
Template incl.: 21 editable slides
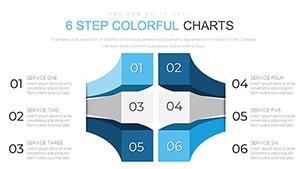
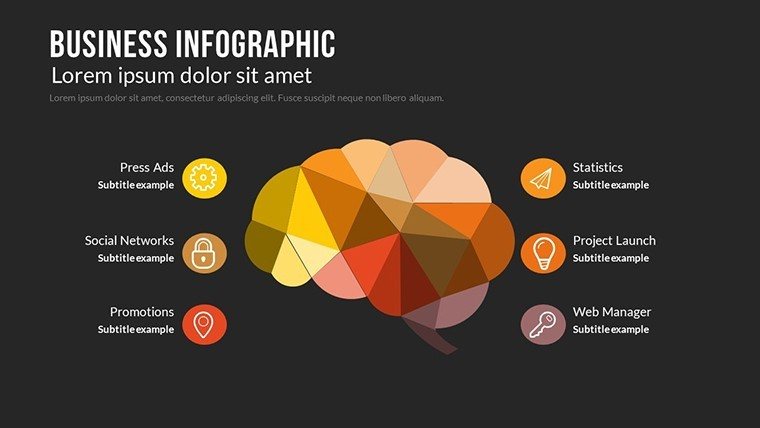
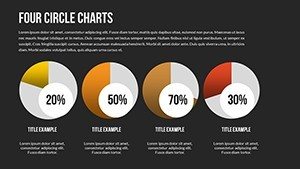
Present Complex Processes with Clarity and Confidence
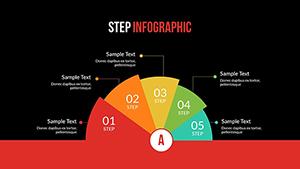
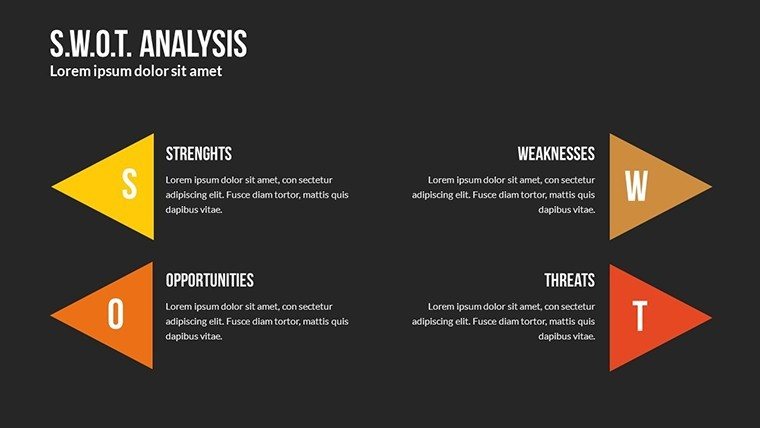
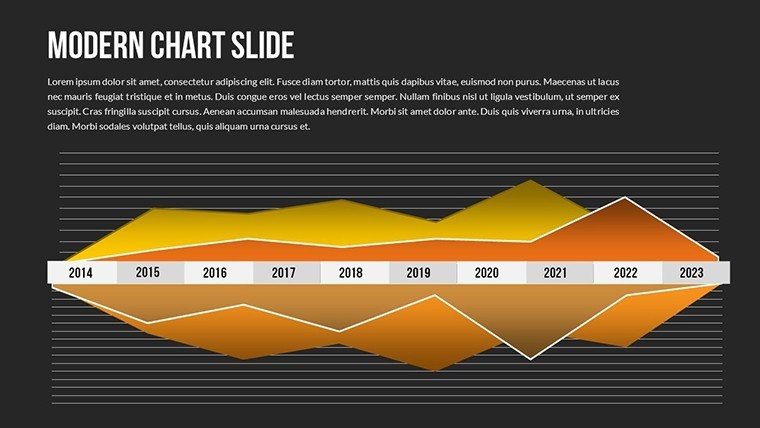
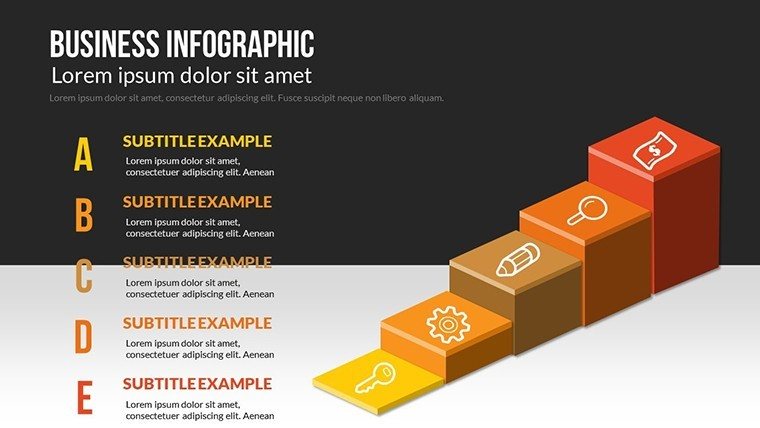
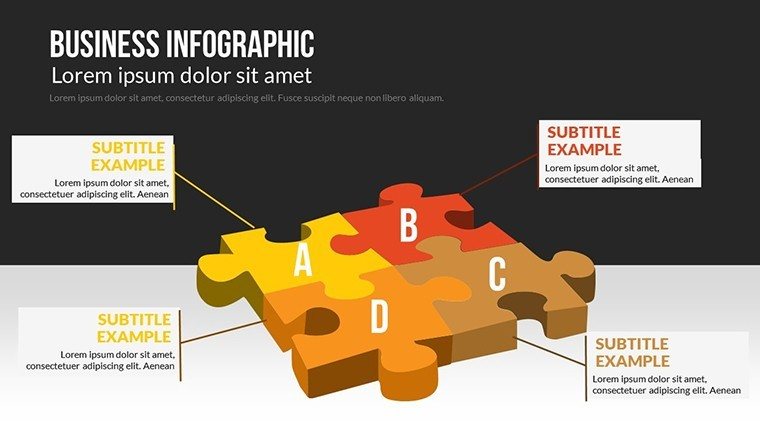
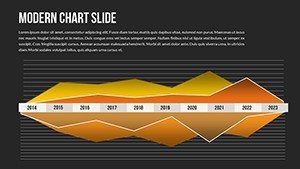
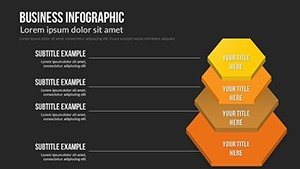
Communicating multi-step workflows or strategies effectively is critical in business settings where decisions depend on shared understanding. This process infographic PowerPoint template includes 21 carefully designed slides that transform detailed sequences into clear, engaging visuals. Professionals rely on these layouts to guide audiences through each phase without overwhelming them with text-heavy slides.
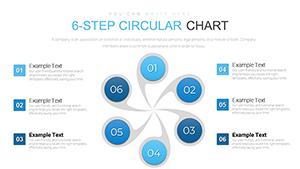
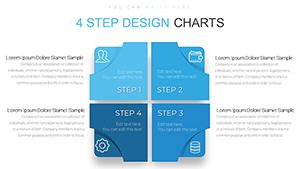
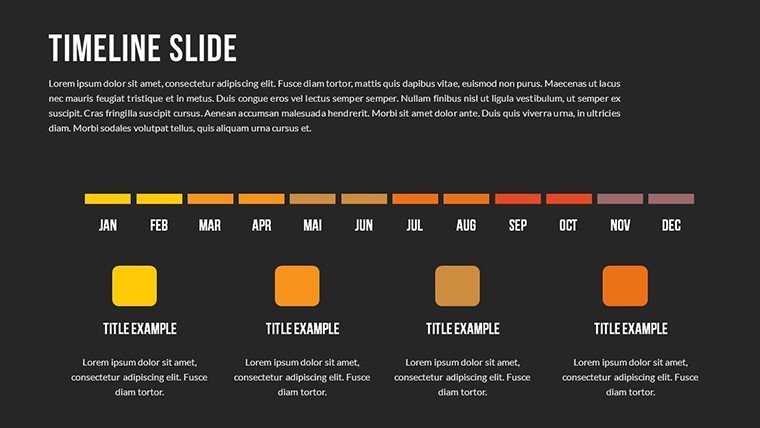
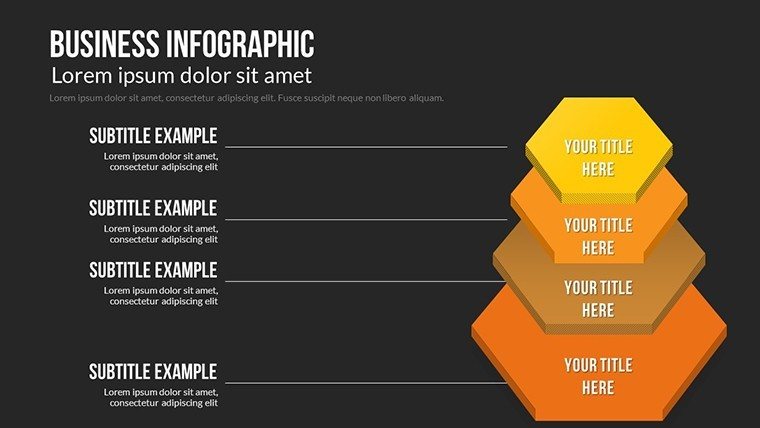
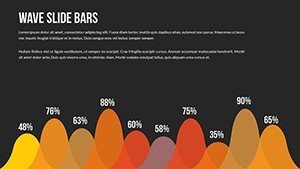
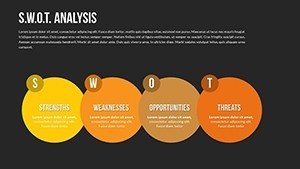
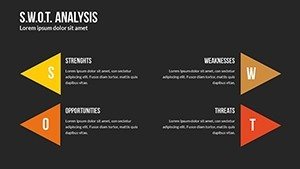
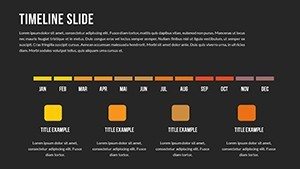
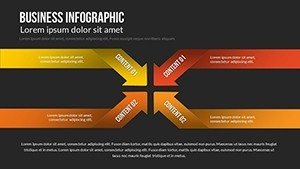
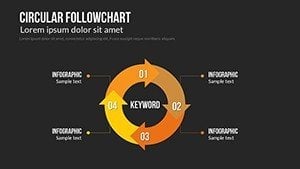
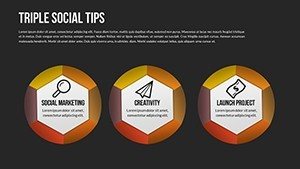
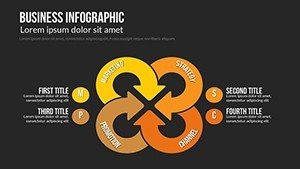
The template supports a range of process types, from linear timelines to cyclical flows, helping teams align on objectives faster. By using structured infographics, presenters maintain audience attention and improve information retention during important discussions.
Key Features
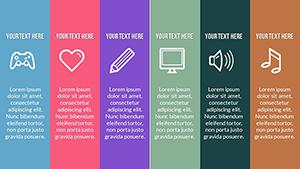
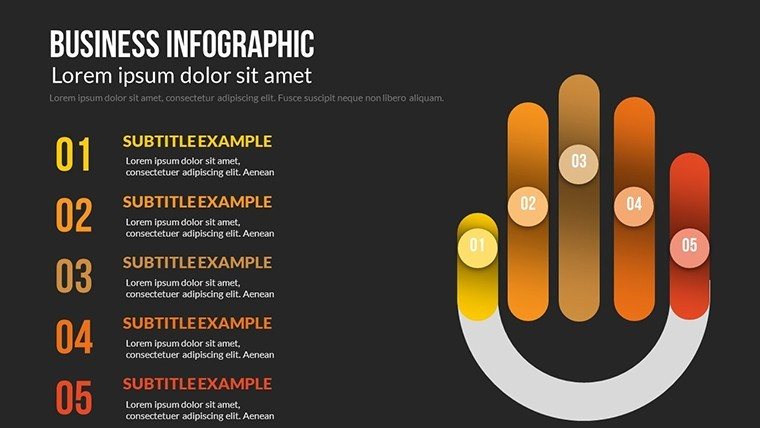
- 21 unique, fully editable slide layouts
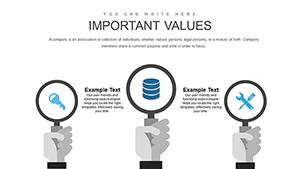
- Customizable colors, fonts, and icons to match your branding
- High-resolution elements suitable for screen and print
- Compatible with Microsoft PowerPoint and Google Slides
How to Customize and Use This Template
After instant download, open the file in PowerPoint or Google Slides and replace placeholder content with your own data. Adjust shapes, arrows, and text boxes to reflect your specific process steps. The intuitive structure allows quick modifications, even for users with limited design experience, so you can prepare professional slides in minutes.
Professional Applications
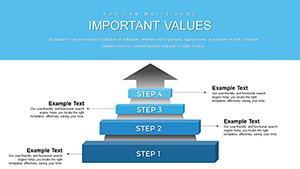
Consultants map client onboarding or change management processes during workshops. Operations teams visualize supply chain or production workflows in internal reviews. Executives outline strategic initiatives in board meetings, while trainers demonstrate procedures in employee development sessions.
Download this template today to streamline your next process presentation.
Frequently Asked Questions
What software do I need to edit this template?
This template is designed for Microsoft PowerPoint and also works seamlessly in Google Slides. No additional software is required.
How many slides are included?
The template contains 21 unique, fully editable slides focused on process infographics.
Is the template fully customizable?
Yes, every element—including colors, text, icons, and layouts—can be modified to fit your specific needs and branding.
Can I use this for commercial presentations?
Absolutely. The template is suitable for business, consulting, education, and any professional or commercial use.
Is the download instant?
Yes, you receive the file immediately after purchase for instant access and use.