Click to zoom
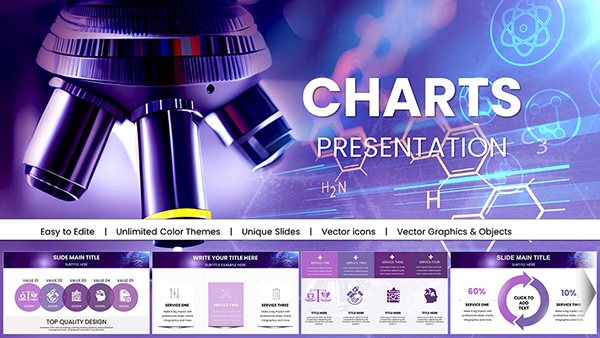
Marketing PowerPoint Charts - Fully Editable
| Format | .pptx |
| Slides | 12 unique layouts |
| Aspect ratio | 16:9 |
| Compatibility | PowerPoint |
| Animated | No |
| Language | English |
| License | Commercial |
| File size | — |
| Version | v1.0 |
| Last updated | March 2026 |
What's inside
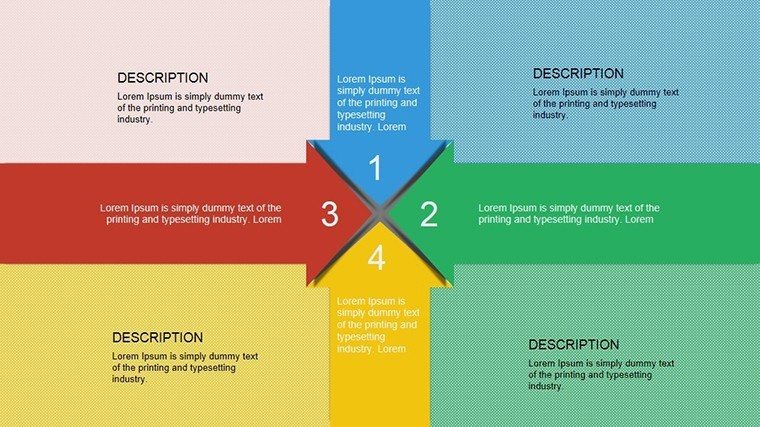
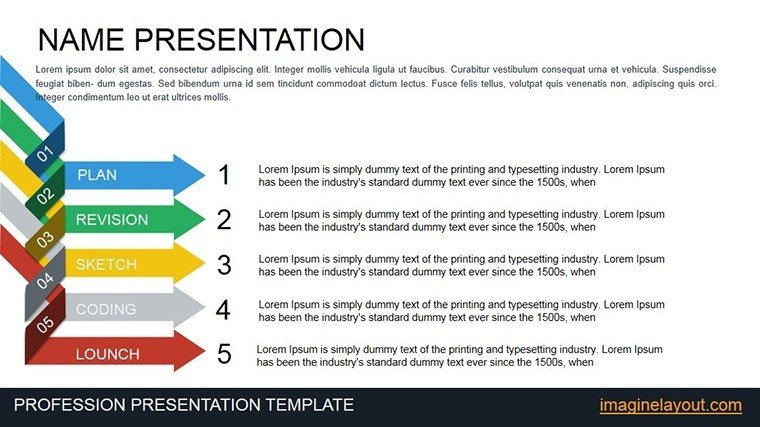
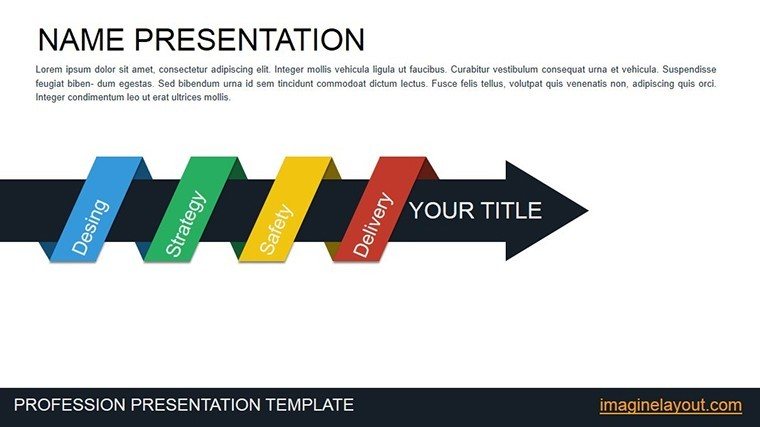
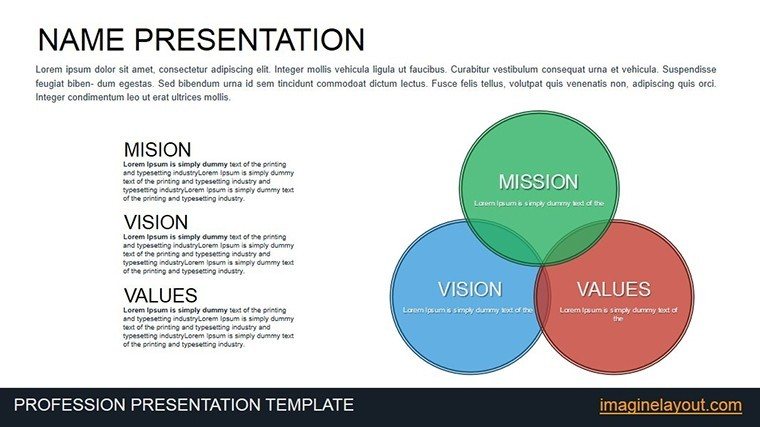
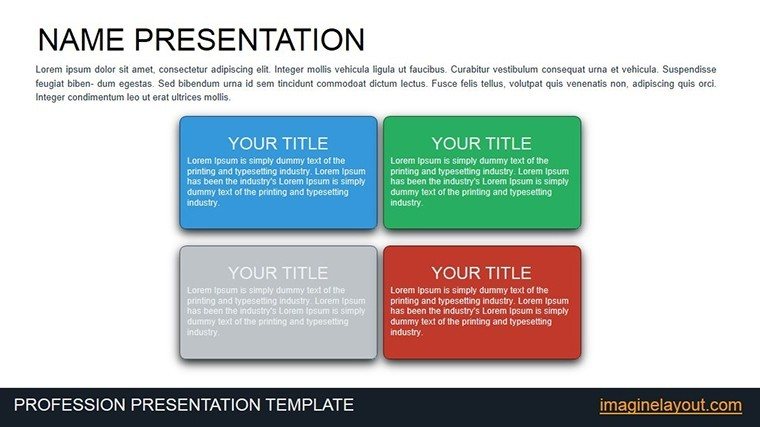
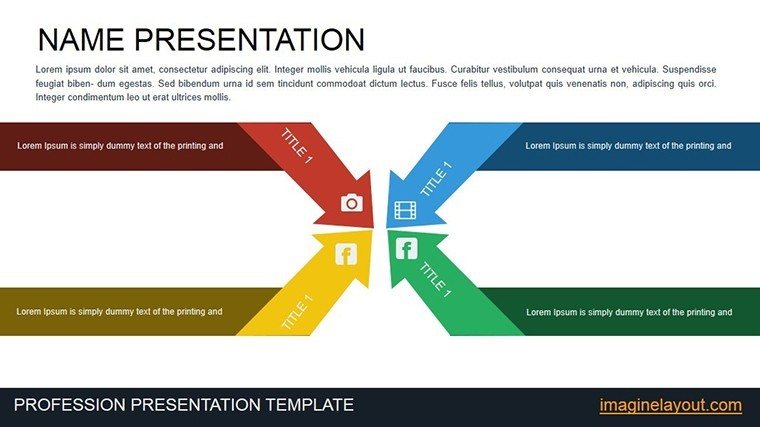
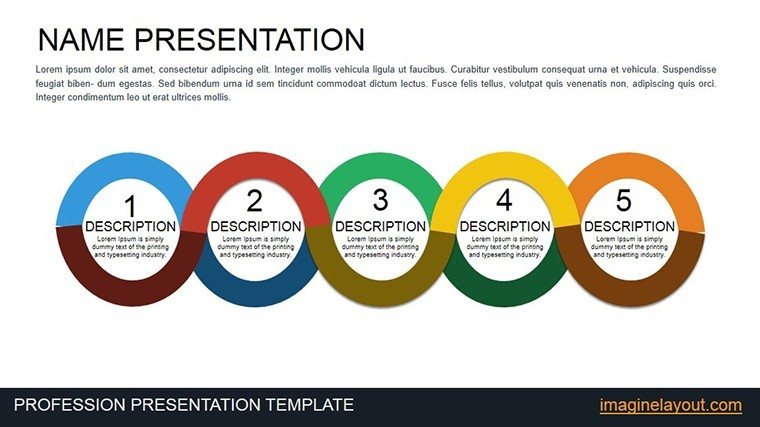
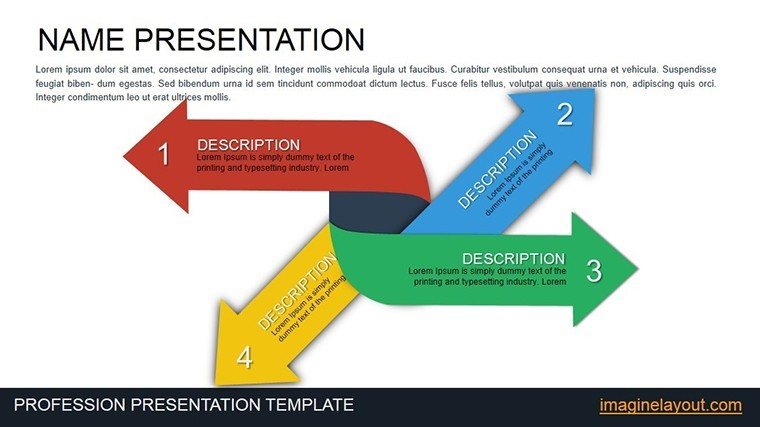
12 Editable Slides: Package Contents
12 diagrams arrive in the download.
The set includes bar charts for ad spend comparisons along with pie charts for market share visualization.
These elements combine to cover complete marketing campaigns from initial planning stages through final performance reviews in one cohesive deck.
Unlike broader strategy sets the design here uses animated transitions on graphs with distinct color contrast to segment phases. It suits best the task of analyzing campaign performance in marketing pitches since the animations reveal trends step by step without overwhelming viewers. The single purchase covers the full 12 slides with graphs and animations in PPTX.
Key Specifications
FeatureDetailsEditable shapesdiagram segments resize and recolor independentlyText placeholderslabels update without unlocking grouped elementsColor theme adjustmentscompatible with PowerPoint slide master paletteDiagram connectorsarrows and lines adjustable in direction and weightAnimation supportbuilt-in transitions editable per slideExport optionsPPTX for editing and PDF for sharingTypical Use Cases by Role
Marketing Manager in Advertising Agency
A marketing manager in an advertising agency prepares a client pitch on campaign results. These charts cut deck preparation from three hours to 45 minutes by swapping data in the existing bar and pie slides.
Consultant in Strategy Firm
A consultant in a strategy firm reviews quarterly performance for investors. The same file adapts across three reports by changing color schemes while keeping the animated flow intact.
Download to Begin Editing Your Marketing Data
Customization in 5 Steps
Moderate difficulty suits users familiar with basic PowerPoint tools.
- Open the .pptx file in PowerPoint 2016 or newer (1 minute)
- Replace placeholder text with your campaign details (3 minutes)
- Adjust brand colors through the slide master palette (2 minutes)
- Edit graph labels and animation timings (4 minutes)
- Export as PPTX or PDF for the meeting (1 minute)
Total time stays under 15 minutes for a branded version.
Why This Template, Not a Blank Slide
Building equivalent marketing graphs from scratch demands advanced design skills and three hours minimum. Many users struggle with consistent color contrast or animation sequencing when starting blank.
This approach requires only moderate skill and under 15 minutes. Labels sit outside graph shapes connected by thin lines to maintain readability on large screens during pitches.
Animations here reveal data in phases rather than all at once which helps audiences follow complex ROI stories without overload.
Get the Full Set of Marketing Charts Now
Which PowerPoint versions does this template support?PowerPoint 2016, 2019, 2021 and Microsoft 365 on Windows or Mac all open the PPTX file without issues. Earlier versions may lack some animation features but core charts remain editable. Test the file in your installed version before full commitment if using legacy software. The slide master ensures consistent layouts across versions.
How do I change the color scheme?Open the slide master view in PowerPoint. Select the theme colors section and update the palette to match your brand. Apply changes across all 12 slides automatically. Save the file to lock in the new scheme for future use.
What license applies to the purchase?Commercial use in client work and internal presentations is fully permitted. Resale of the template or any derivative as standalone product remains prohibited. Sublicensing to third parties is not allowed under the terms. Contact support for specific enterprise licensing questions.
Is there a free version available?The product page does not list a separate free tier. The single purchase includes the complete set of 12 editable slides with graphs and animations. All features shown in the description come with the paid file. No limitations apply after purchase.
What file formats are included and what opens them?The download contains only the PPTX format. Microsoft PowerPoint or compatible viewers such as Keynote with import open it directly. PDF export is available after editing for distribution. No additional JPG or other formats appear in the package.
What is the refund policy?Refunds are processed within 14 days of purchase if the file fails to open in supported PowerPoint versions. Provide proof of compatibility issue for approval. No refunds after successful download and editing. Support assists with any technical problems before refund requests.
Does the template include animation support?Yes built-in animations guide viewers through graph progressions. Remove or customize each transition directly in the animation pane. This feature works in PowerPoint 2016 and newer. Disable all animations globally if preferred for static presentations.
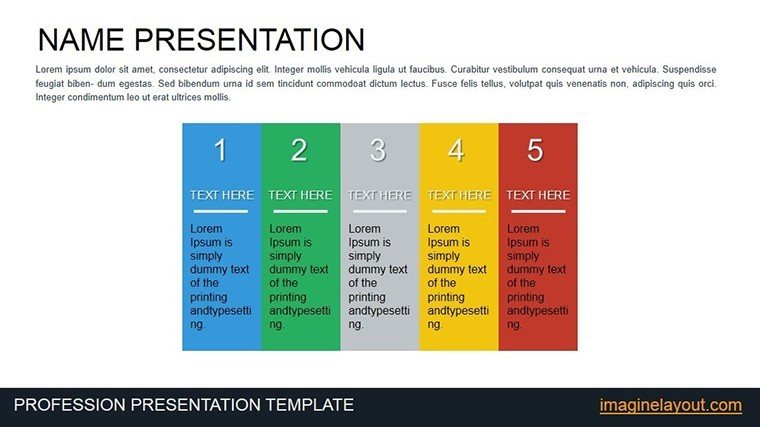
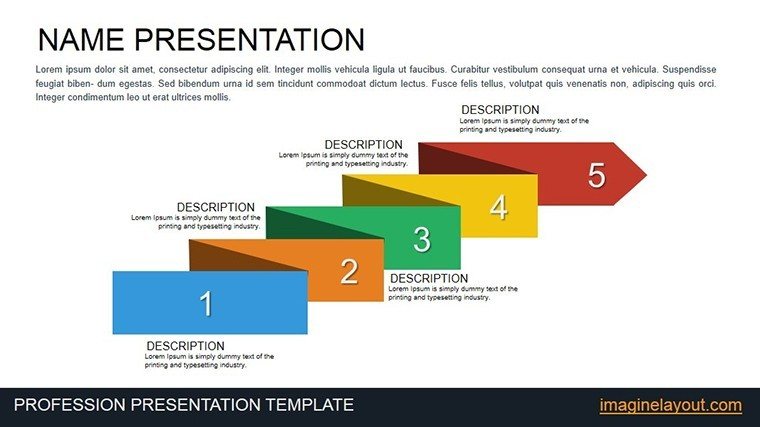
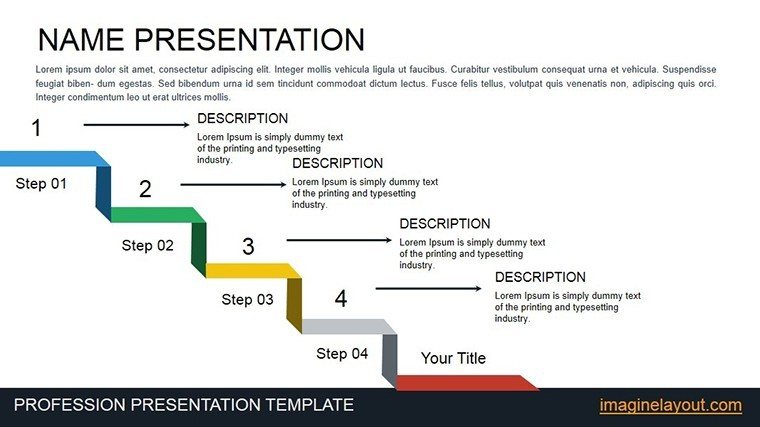
Good for
- Project roadmaps and sprint plans
- Product launch timelines
- Quarterly or annual review decks
- Company history and milestone summaries
Licence
reviews
I used maybe six slides from the whole pack but they worked well.
The arrow graphics were simple and readable.
Still useful for internal presentations.
FAQ
Will it work in Google Slides?
Are fonts embedded?
Can I use this for client work?
What's the refund policy?
Do you update the template after purchase?
Similar templates
See all PowerPoint Charts →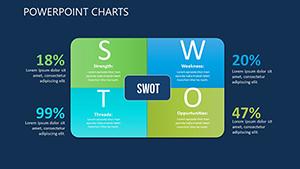
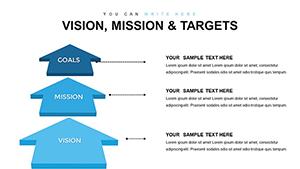

All 12 slides