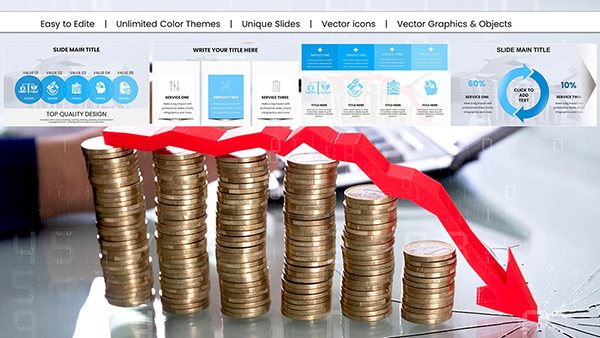
Professional Sales Charts - Fully Editable PPTX


Type: PowerPoint Charts template
Category: Analysis
Sources Available: .pptx
Product ID: PC00457
Template incl.: 17 editable slides
Files and Formats Included
17 editable slides arrive in PPTX format.
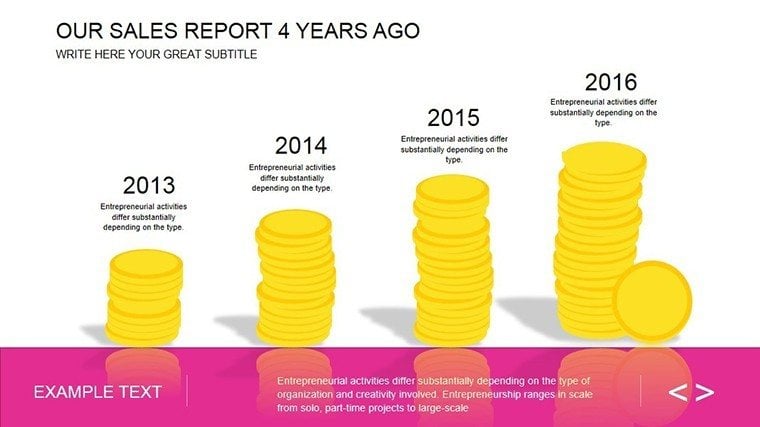
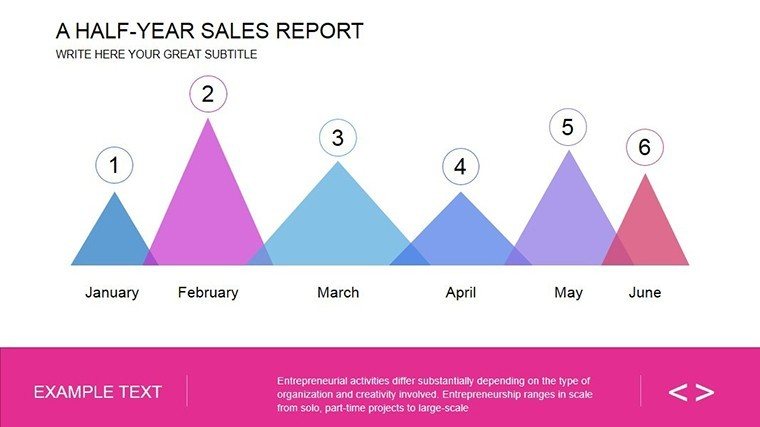
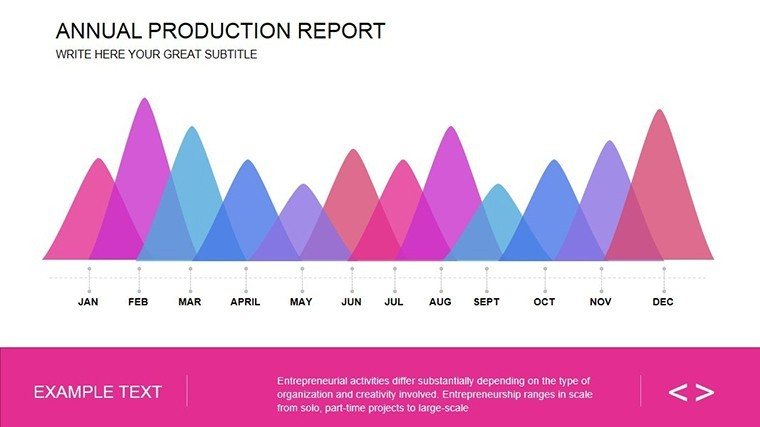
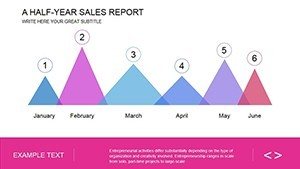
Each addresses sales achievement highlights and trend forecasts.
Layouts support data input for quarterly metrics.
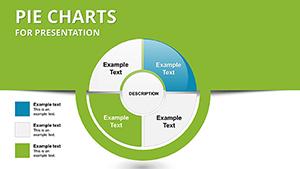
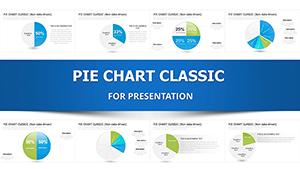
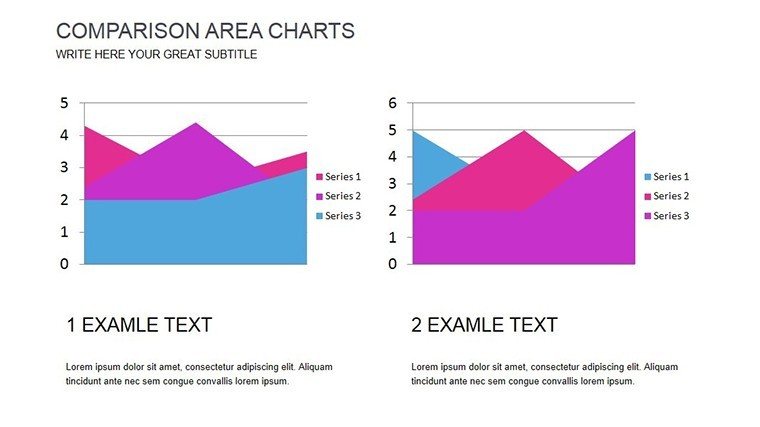
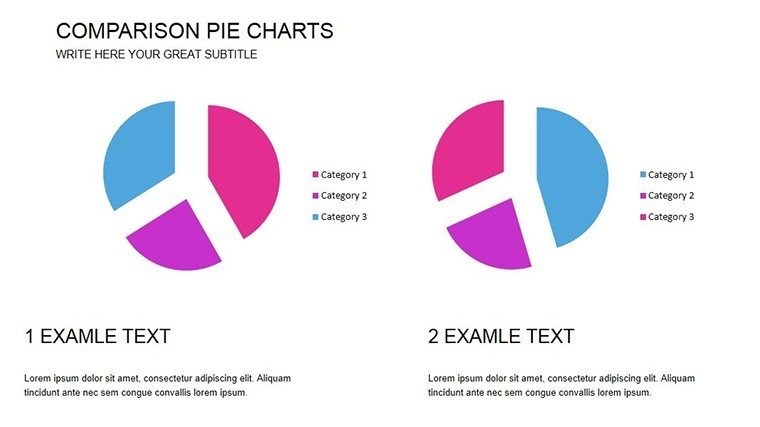
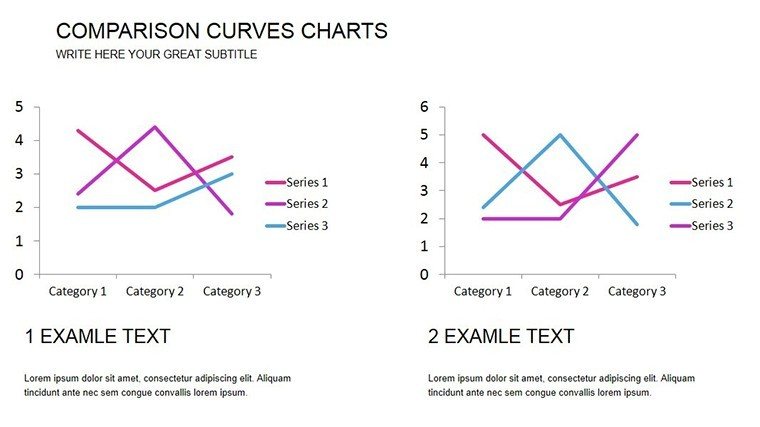
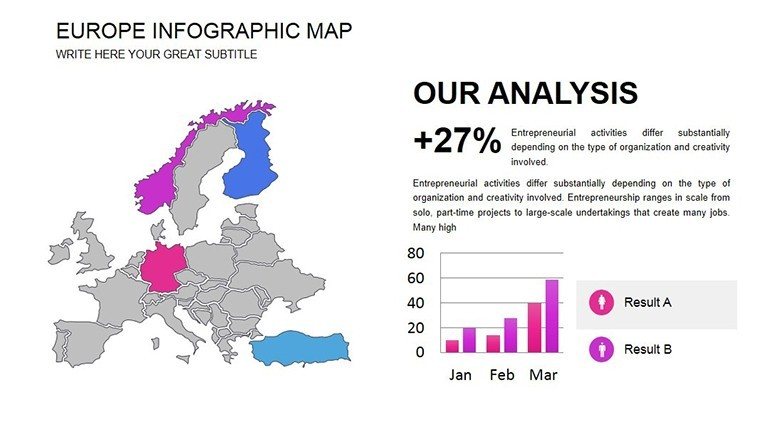
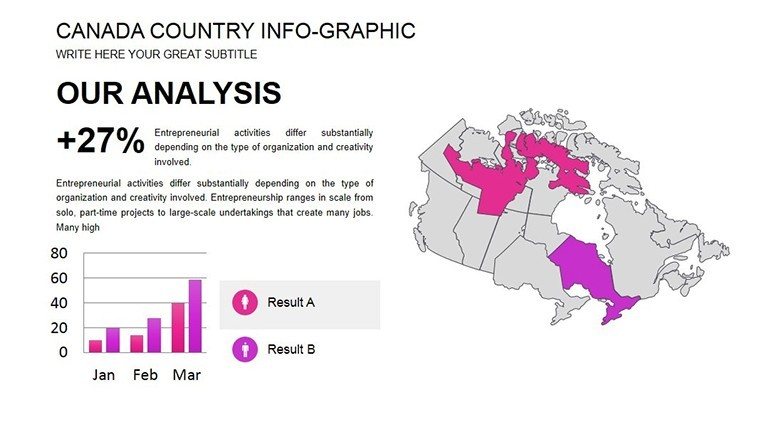
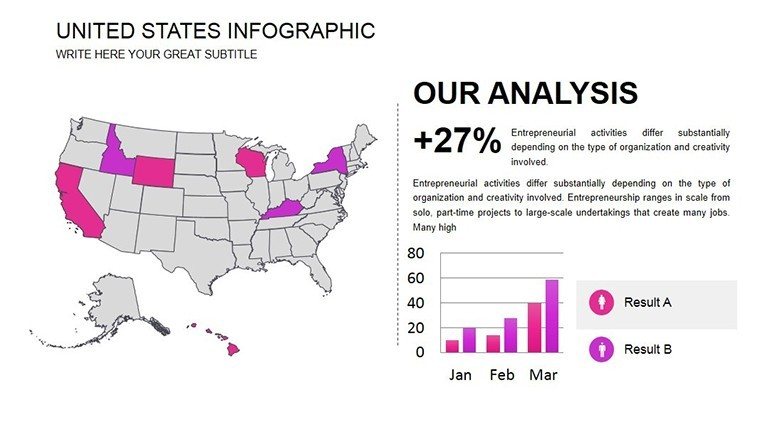
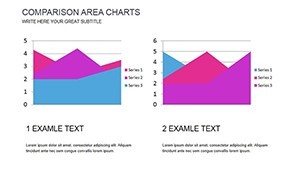
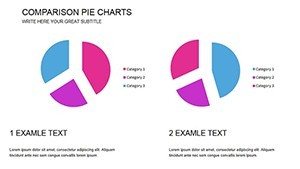
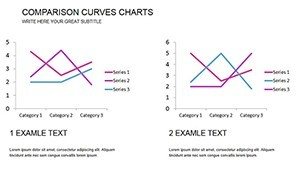
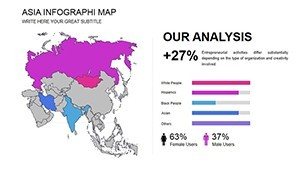
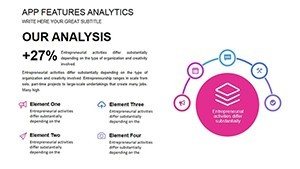
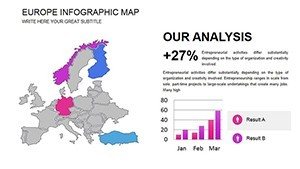
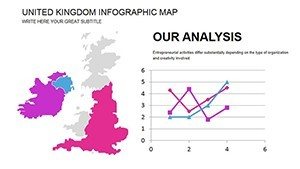
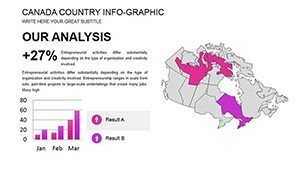
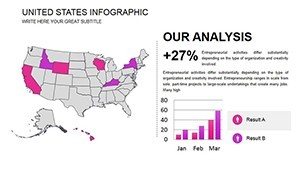
Diagram types integrate pie segments with line comparisons for narrative flow.
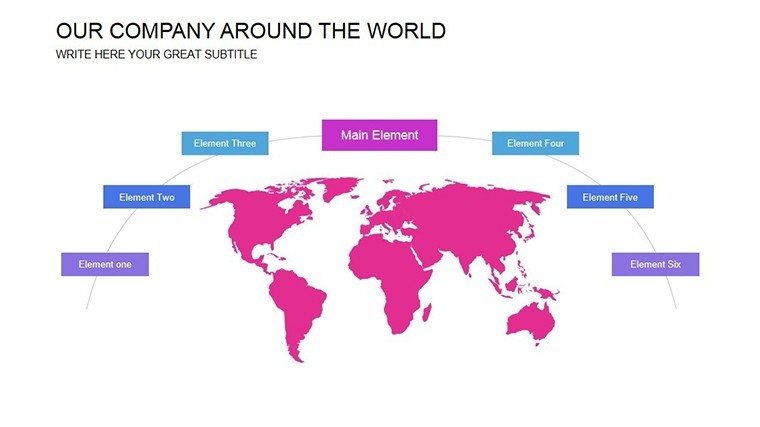
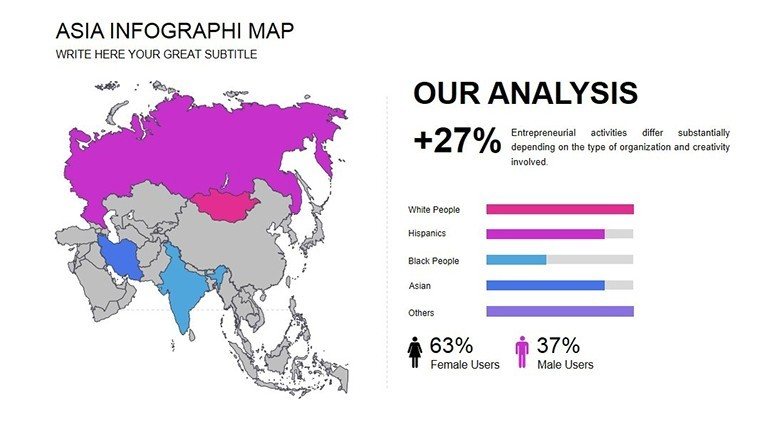
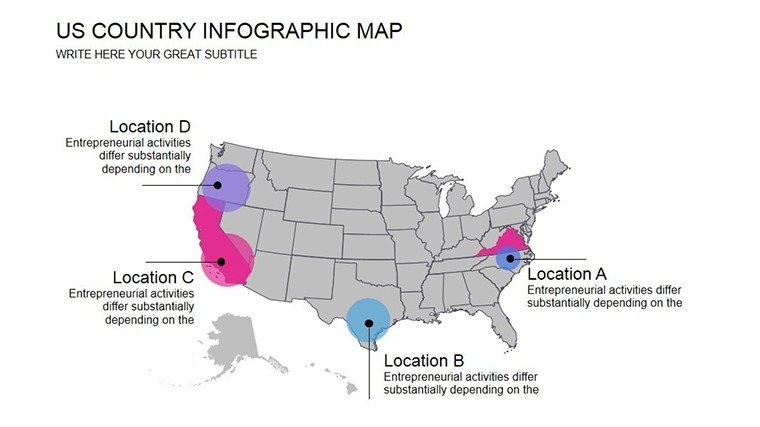
Zone segmentation clarifies challenges versus opportunities.
The layout composition distinguishes this set from single-chart layouts by enabling full report storytelling in one deck.
Technical Specs
| Feature | Details |
|---|---|
| Slides included | 17 sales report diagrams |
| Editable elements | shapes resize and recolor independently |
| Text placeholders | labels update without unlocking groups |
| Color theme adjustments | slide master palette compatible |
| Diagram connectors | arrows adjustable in direction and weight |
| File formats | PPTX for editing |
How Consultants Use This in Client Work
Financial analysts in consulting cut deck preparation from 3 hours to 45 minutes by adapting the sales diagrams for client proposals.
The same file served three consecutive performance reviews after color swaps.
Sales director in corporate briefings
A sales director in manufacturing reused the forecast slides across five investor decks by editing placeholders only.
Project managers pair these with analysis chart collections for broader options.
Download now to master your metrics.
From Download to Final Deck
1. Open the PPTX file in PowerPoint 2016 or later (1 minute).
2. Replace placeholder text with your metrics (3 minutes).
3. Adjust brand colors via the slide master (2 minutes).
4. Edit diagram labels and connectors (4 minutes).
5. Export as PPTX or PDF (1 minute).
Editing difficulty remains moderate for users with basic PowerPoint knowledge.
Building From Scratch vs. Starting Here
Building equivalent sales report diagrams from scratch requires 3 hours and intermediate design skills.
Here the process takes 15 minutes with no prior expertise needed.
Common issues in manual builds include misaligned labels and weak flow direction on projection screens.
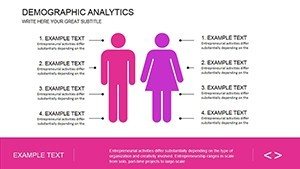
Labels sit outside shapes connected by thin lines because this layout maintains readability during live meetings without adding editing complexity.
Consultants pair these with sales analysis visuals for multi-tier strategy decks.
Get the template and start your next board briefing prepared.
Which PowerPoint versions support this template?
PowerPoint 2016, 2019 and Microsoft 365 on both Windows and Mac open the PPTX file without issues.
Earlier versions may lack full animation support so test first.
The slide master ensures compatibility across updates.
No additional plugins required.
How do I change the color scheme?
Open the slide master view in PowerPoint.
Select the color palette and replace the theme colors.
All diagrams update automatically.
Save the file and the changes apply to every slide.
What does the license permit?
The license allows use in client work and internal presentations.
Resale or sublicensing of the file itself remains prohibited.
You may modify and deliver as part of paid consulting.
Full terms appear in the downloaded package.
What is the difference between free and paid versions?
The paid version at $20 includes the full 17 editable slides.
Free access at $0 provides no additional content details on the page.
Paid unlocks complete diagram layers.
No further differences listed.
What file formats are included?
The download contains only the PPTX format.
This opens directly in PowerPoint for editing.
Export to PDF occurs after customization.
No other formats appear in the package.