Innovative Perspective Meaning PowerPoint Charts Template


Type: PowerPoint Charts template
Category: Analysis
Sources Available: .pptx
Product ID: PC00451
Template incl.: 17 editable slides
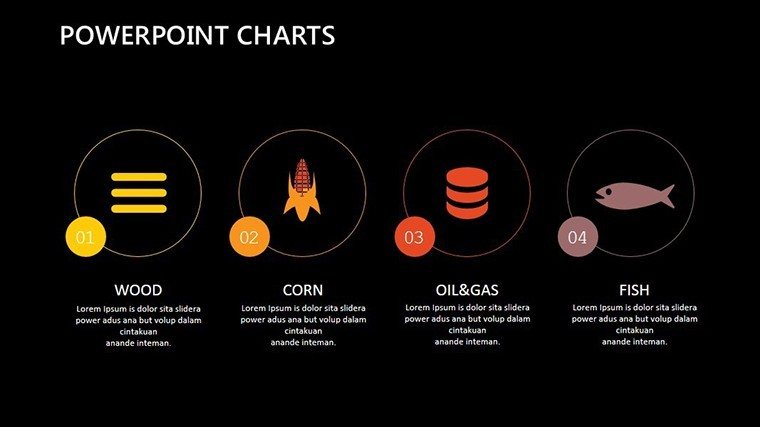
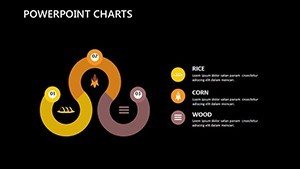
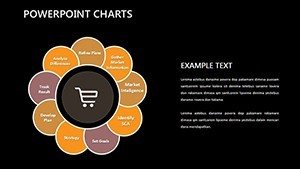
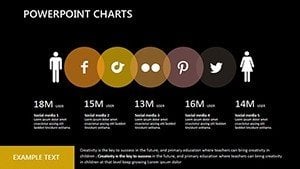
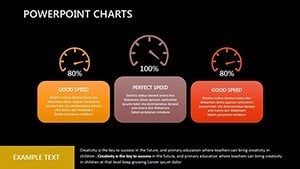
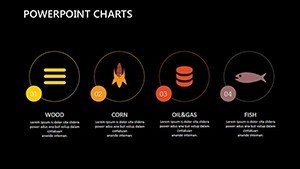
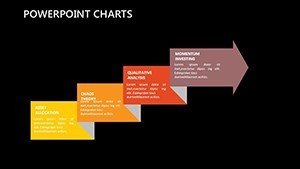
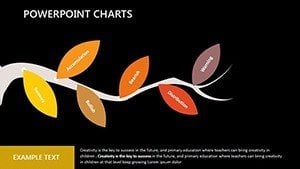
In the realm of project management and data analysis, clarity in visualizing interactions is paramount. Our Perspective Meaning PowerPoint Charts template, with 17 editable slides, excels in representing sequence diagrams, spatial relationships, and multifaceted plans. Suited for engineers plotting workflows, marketers analyzing consumer paths, or managers coordinating teams, this .pptx tool simplifies complexity. Envision charting a software development cycle where object interactions unfold clearly, aiding in resource allocation amid shifting deadlines.
Visualizing Complex Interactions
Inspired by UML standards from the Object Management Group, this template aids in diagramming message sequences between entities. For an engineering team, it means mapping system architectures, drawing from case studies like NASA's project visualizations that enhanced efficiency.
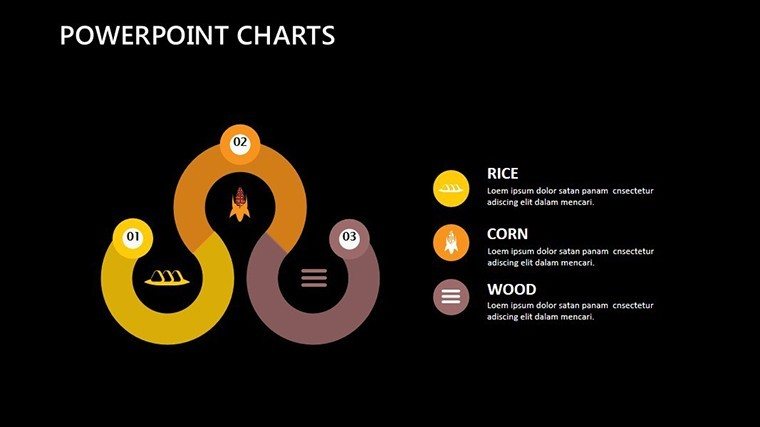
Key Features for Analytical Precision
Editable objects allow dynamic adjustments, ideal for evolving projects.
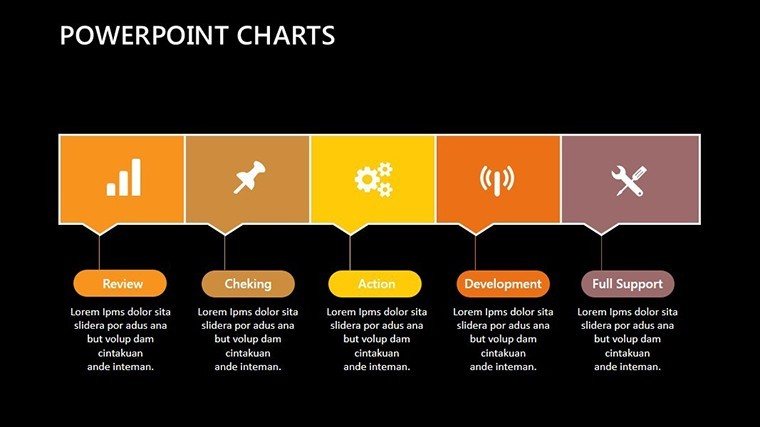
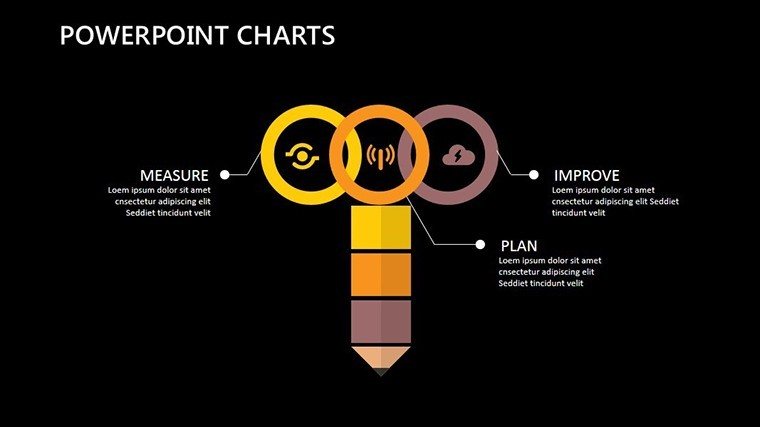
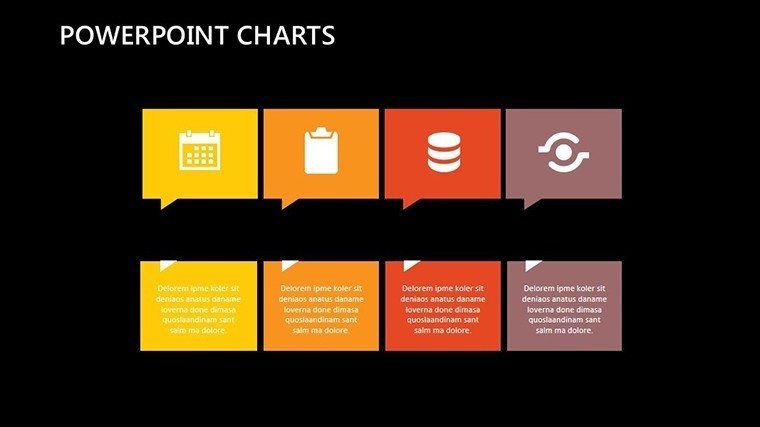
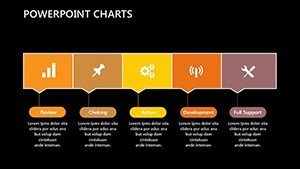
- Interaction Diagrams: Sequence messages with timelines.
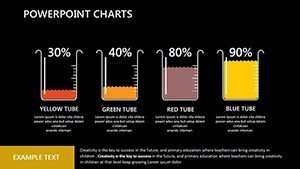
- Spatial Mapping: Represent data in multi-dimensional views.
- Customization Depth: Adapt for specific industries.
- Resource Tools: Built-in for scheduling.
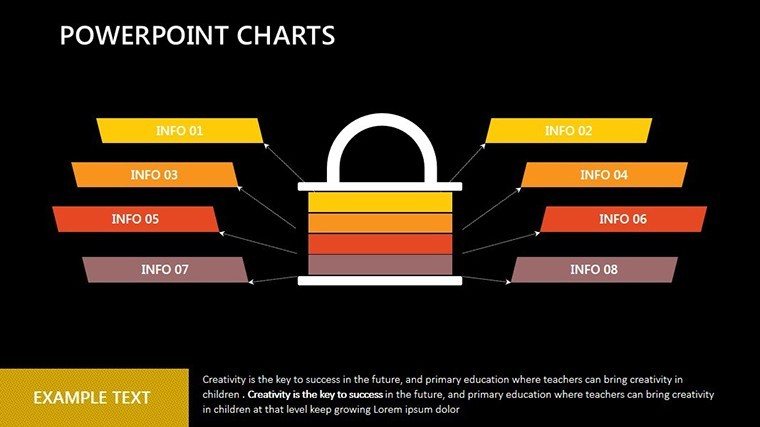
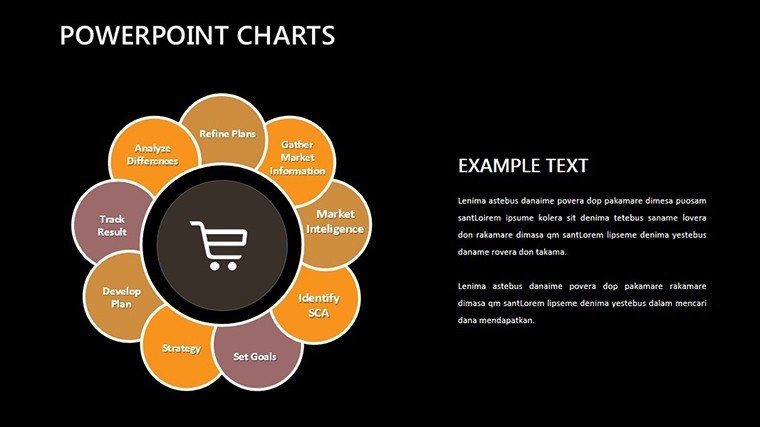
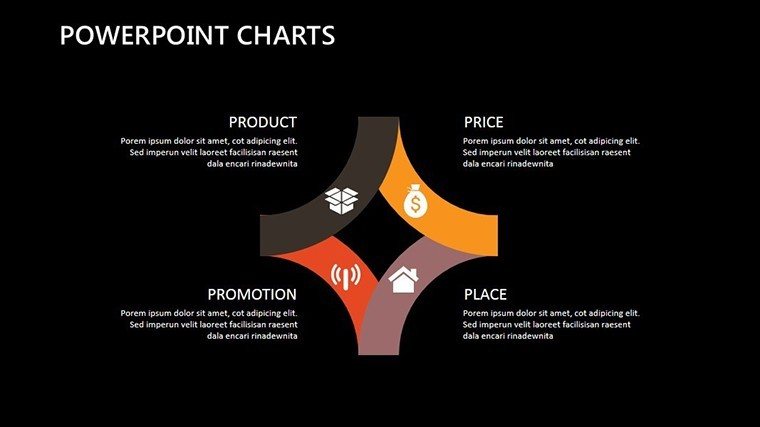
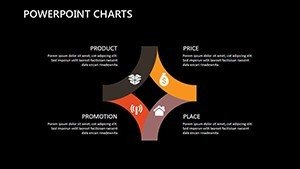
Diverse Applications in Practice
Marketers use it for customer journey maps, while managers tackle cross-team dependencies. Outperforms basic charts by offering perspective views for better foresight.
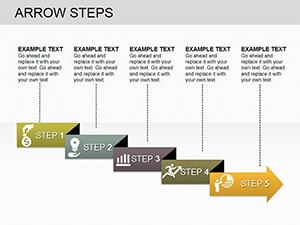
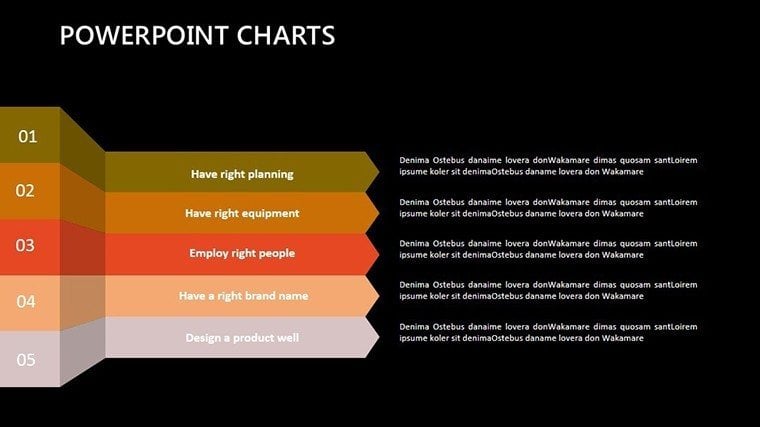
Implementation Steps
- Download and edit in PowerPoint.
- Define objects and sequences.
- Tailor visuals to data.
- Integrate with project tools.
- Review and refine.
Facilitates efficient planning.
Demonstrating Domain Expertise
Aligns with PMI methodologies, as seen in successful implementations at firms like Boeing.
Versatile for analytics in various fields.
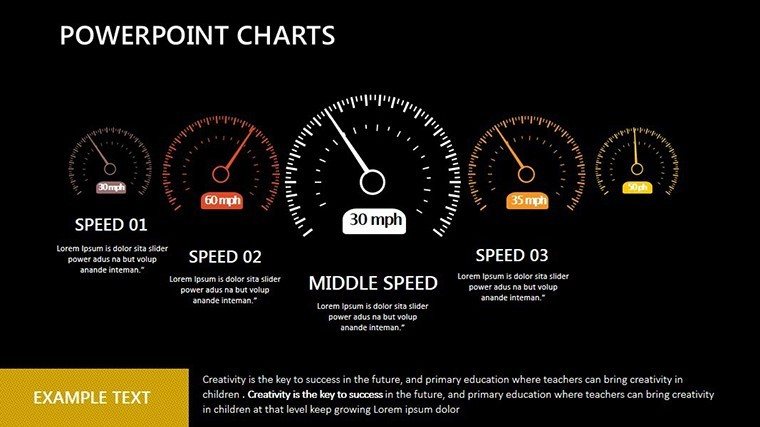
Optimization Techniques
- Layer sequences for depth.
- Use colors for phases.
- Embed metrics.
- Test scalability.
- Collaborate iteratively.
Boosts utility.
Empower Your Projects - Get Started
Harness this template to navigate complexities with ease. Customize today for transformative results.
Frequently Asked Questions
- How adaptable for different fields?
- Highly, with edits for engineering to marketing.
- Supports large datasets?
- Yes, scalable diagrams.
- Integration with other software?
- Exportable formats available.
- Tutorials provided?
- Basic guides included.
- License details?
- Commercial and personal use.