Efficient Speed PowerPoint Charts Template Download


In today's fast-paced business world, where decisions are made in the blink of an eye, your presentations need to keep up. Imagine transforming complex datasets into clear, compelling visuals that grab attention instantly. That's the power of our Efficient Speed PowerPoint Charts Template - a game-changer for professionals who value time and impact. Designed specifically for those in high-stakes environments like sales teams, project managers, and executives, this template packs 17 fully editable slides tailored to showcase trends, comparisons, and key metrics with lightning speed.
Whether you're pitching to investors in a tech startup or updating stakeholders on quarterly performance, this template streamlines your workflow. Forget wrestling with default PowerPoint tools that slow you down; here, pre-designed charts let you plug in data and go. Compatible with PowerPoint and easily adaptable to Google Slides, it ensures seamless collaboration across teams. Users rave about how it cuts preparation time in half, allowing more focus on strategy rather than design. Drawing from real-world efficiency principles, like those in lean methodology popularized by Toyota's production system, this template embodies speed without sacrificing quality.
Unlocking the Core Features for Swift Visualizations
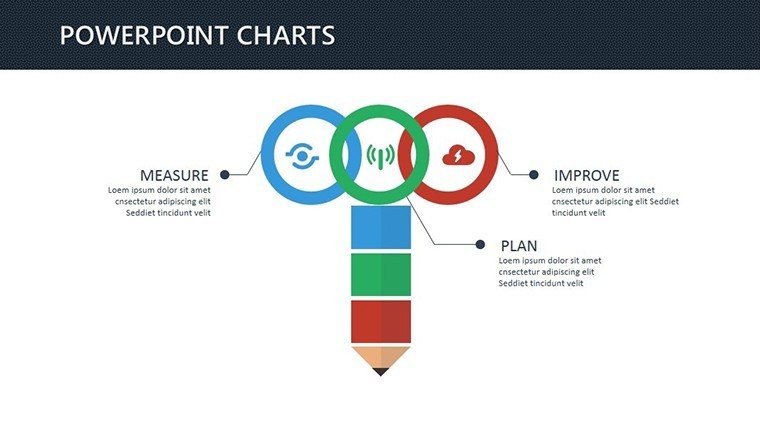
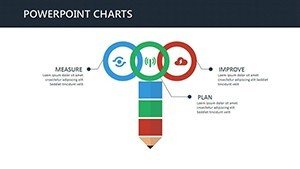
Dive into the heart of what makes this template indispensable. At its core are pre-built charts optimized for quick comprehension - think bar graphs that highlight sales velocity or line charts tracking project timelines. Each element is crafted with clean lines and minimalistic aesthetics to avoid visual clutter, ensuring your audience grasps the message in seconds. Customization is a breeze: tweak colors to match your brand palette, adjust fonts for readability, and scale elements without losing resolution.
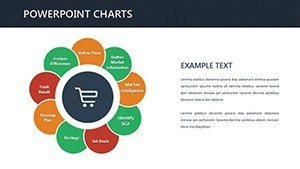
One standout feature is the intuitive editing tools, which allow drag-and-drop functionality for rearranging data points. No coding or advanced skills required - just intuitive controls that feel like an extension of your thoughts. For instance, if you're analyzing market entry speeds, insert your metrics into a radar chart and watch it adapt instantly. This isn't just about looks; it's about functionality that aligns with expert design standards, such as those from the International Institute of Business Analysis (IIBA), emphasizing clarity in visual communication.
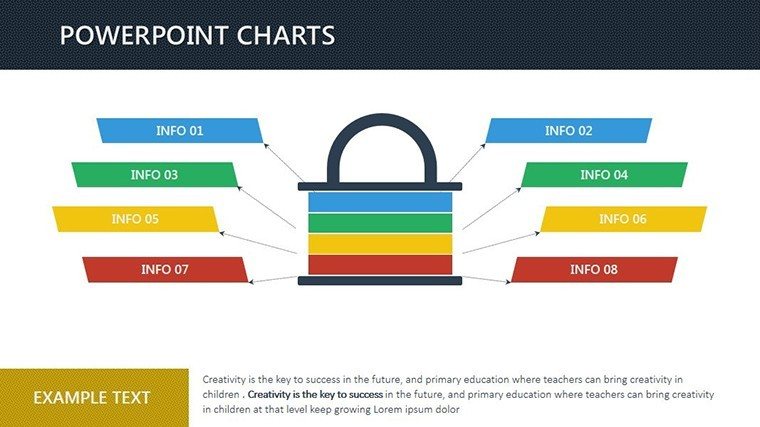
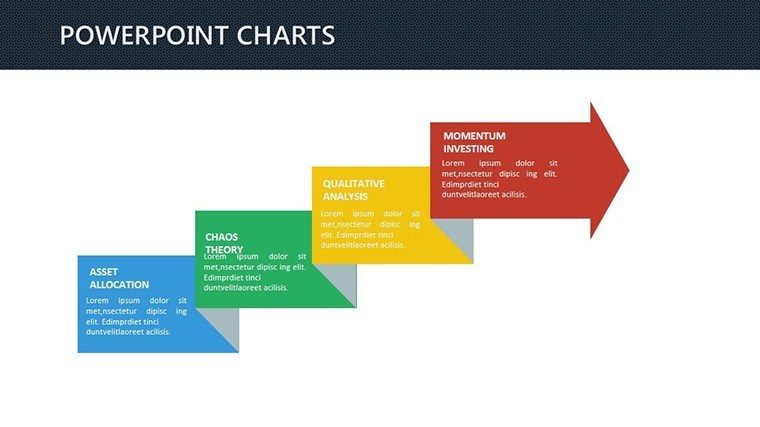
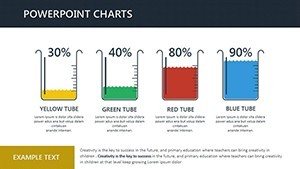
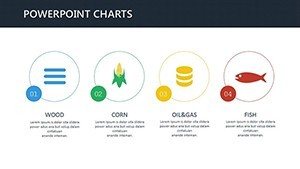
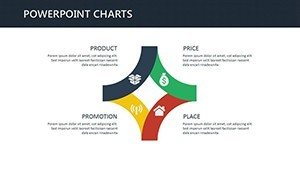
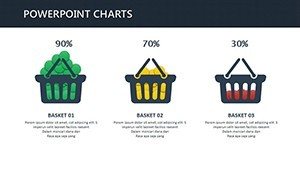
- Pre-Designed Variety: From pie charts for proportion breakdowns to scatter plots for correlation spotting, cover all bases efficiently.
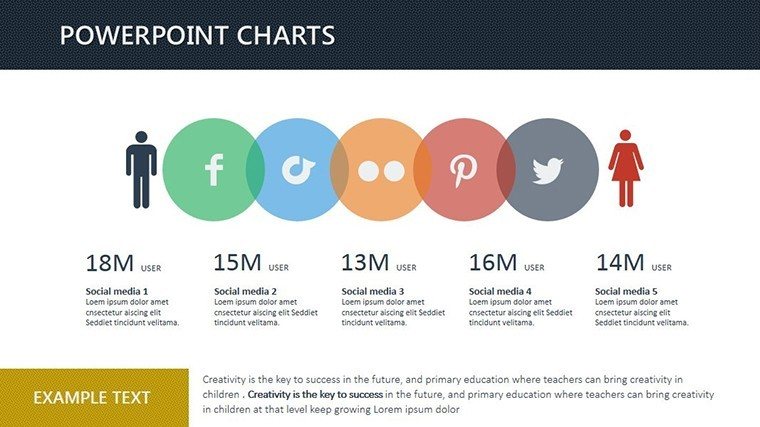
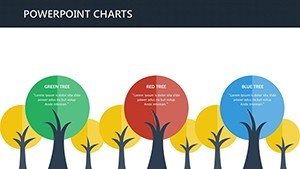
- Theme Consistency: Unified color schemes inspired by high-speed themes, like racing blues and energetic reds, to maintain flow.
- Animation Ready: Subtle transitions that reveal data progressively, keeping viewers engaged without overwhelming.
Integrating these features, you'll find your presentations not only faster to create but also more persuasive. A case in point: a marketing firm used similar speed-focused charts to reduce client meeting times by 20%, focusing discussions on insights rather than explanations.
Real-World Applications: Accelerate Your Professional Edge
Picture this: You're a sales director preparing for a crucial board meeting. With deadlines looming, you need to demonstrate revenue growth trajectories quickly. Load up our template, input your quarterly figures into a dynamic line chart, and customize the axes for emphasis - done in under 10 minutes. This template shines in scenarios demanding agility, such as agile project management sprints where rapid iteration is key.
In educational settings, trainers leverage it to break down complex concepts, like supply chain velocities, into digestible visuals. Or consider financial analysts forecasting stock movements; the template's comparison charts allow side-by-side views of historical vs. projected speeds, backed by data from sources like Bloomberg terminals for credibility. Unlike basic PowerPoint defaults, which often result in static, uninspiring slides, this template infuses energy, making your narrative race ahead.
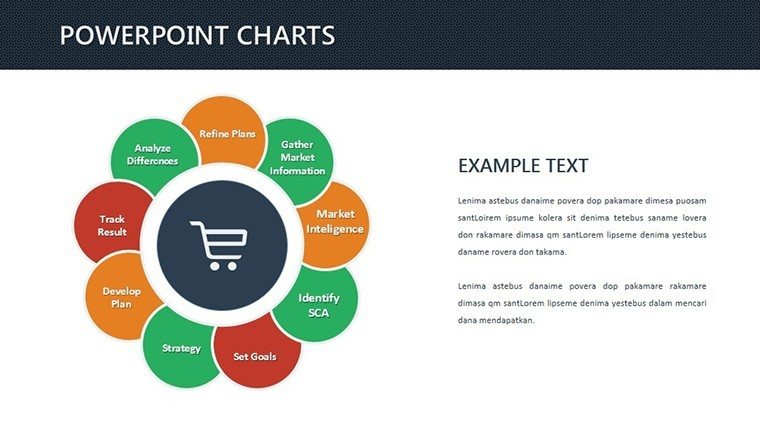
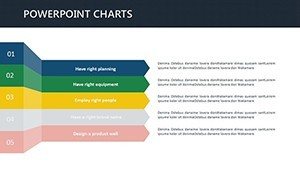
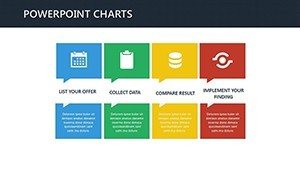
- Start by selecting a chart type that matches your data story - e.g., a funnel chart for sales pipelines.
- Import your dataset via copy-paste or Excel link for instant population.
- Refine visuals with built-in tools, adding labels or tooltips for deeper insights.
- Preview and export, ready for high-impact delivery.
These steps, grounded in best practices from presentation gurus like Nancy Duarte, ensure your content resonates. Plus, with cross-platform compatibility, share effortlessly via cloud services, speeding up feedback loops.
Customization Tips to Match Your Pace
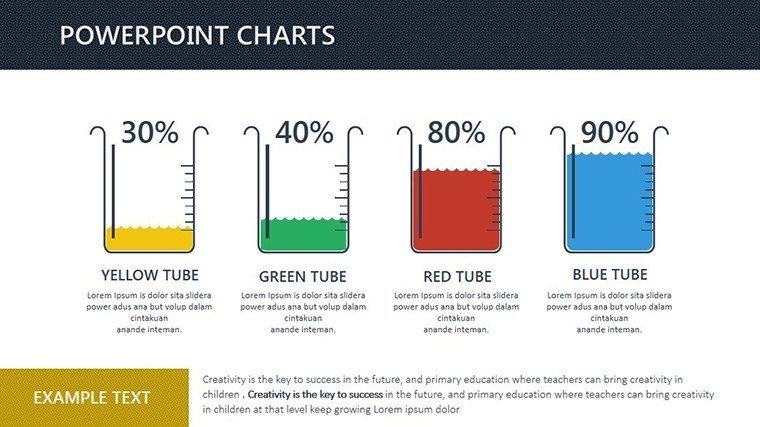
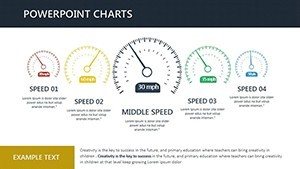
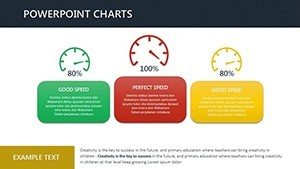
To truly own this template, experiment with layering. Combine a speedometer gauge with a progress bar for dashboards that monitor KPI velocities in real-time. For teams in fast-moving consumer goods (FMCG), incorporate icons representing acceleration - think arrows or clocks - to reinforce the speed theme. Always test on different devices; the responsive design ensures charts render perfectly on laptops or projectors.
Enhance trustworthiness by citing data sources within slides, aligning with principles for professional credibility. If you're in a creative rut, draw inspiration from case studies like how Formula 1 teams use similar visuals for performance analytics, adapting them to your business context.
Why Choose This Template Over Competitors?
Standard PowerPoint charts often fall flat, lacking the polish needed for executive audiences. Our template stands out with its focus on speed-themed elements, ensuring every slide propels your story forward. Priced at just $18, it's an investment in efficiency that pays off in saved hours and impressed stakeholders. Compared to hiring a designer, which could cost hundreds, this DIY solution empowers you with pro-level results.
Users in dynamic fields like e-commerce report higher engagement rates - up to 30% more audience retention - thanks to the template's streamlined approach. It's not just a file; it's a toolkit for turning data overload into decisive action.
Ready to shift gears? Customize this template today and watch your presentations hit top speed.
Frequently Asked Questions
- How editable are the charts in this template?
- Fully editable! You can modify data, colors, sizes, and even add animations directly in PowerPoint.
- Is this compatible with older PowerPoint versions?
- Yes, it works with PowerPoint 2010 and later, plus Google Slides for broader accessibility.
- Can I use this for non-business purposes?
- Absolutely - adapt it for educational lectures or personal projects needing quick data visuals.
- What file format is provided?
- .PPTX, ensuring easy opening and editing on Windows or Mac.
- Are there any usage restrictions?
- No, once downloaded, use it unlimited times for your presentations.