Animated Market Development Charts - Editable PPTX | ImagineLayout


Type: PowerPoint Charts template
Category: Analysis
Sources Available: .pptx
Product ID: PC00449
Template incl.: 12 editable slides
Package Contents
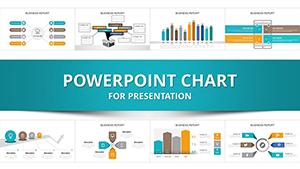
12 animated slides arrive in the PPTX file.
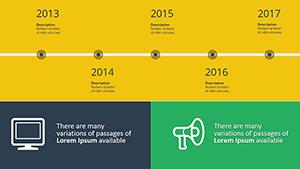
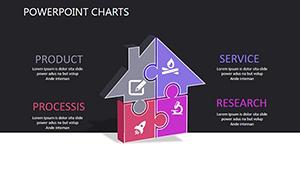
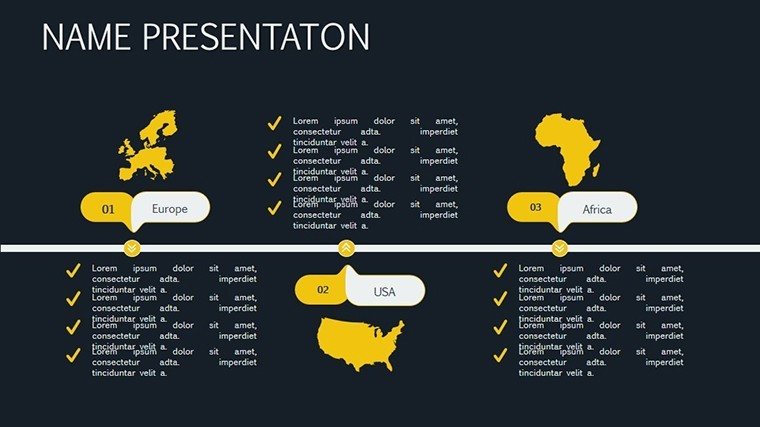
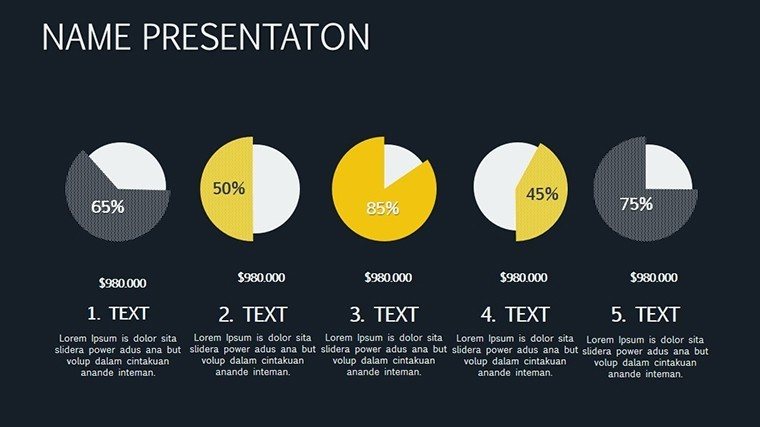
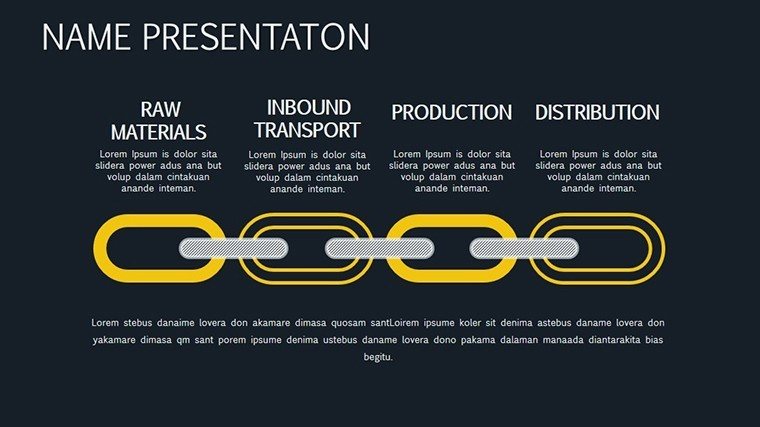
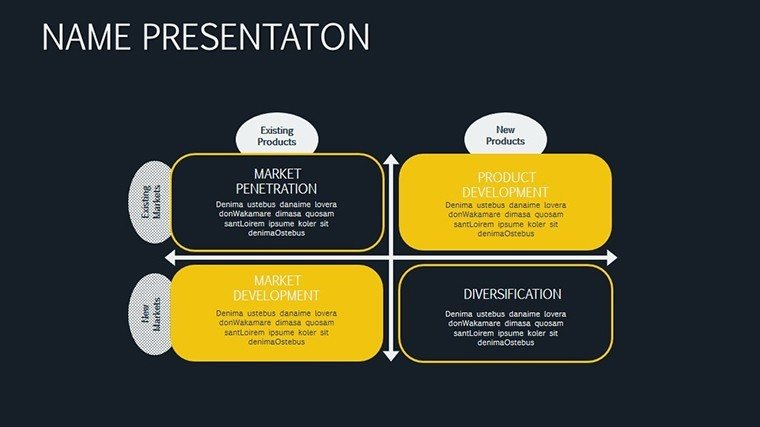
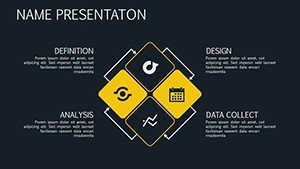
Radar charts and timelines sequence market growth stages into one deck.
Unlike static analysis packs, this version keeps connectors editable after animations are triggered.
Format and Compatibility Details
| Feature | Details |
|---|---|
| Slides included | 12 editable animated charts |
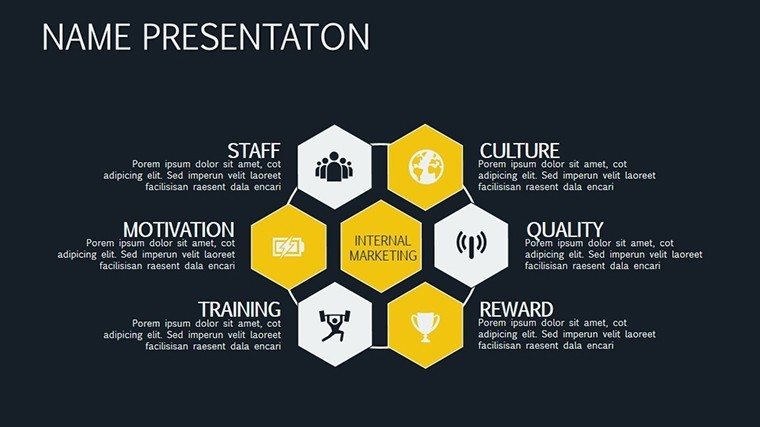
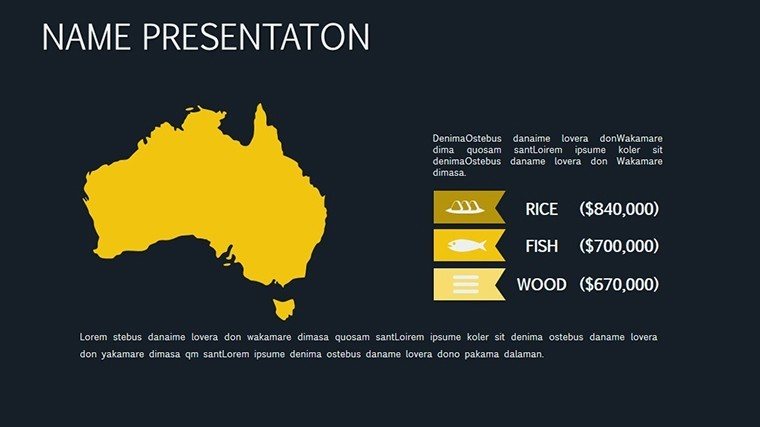
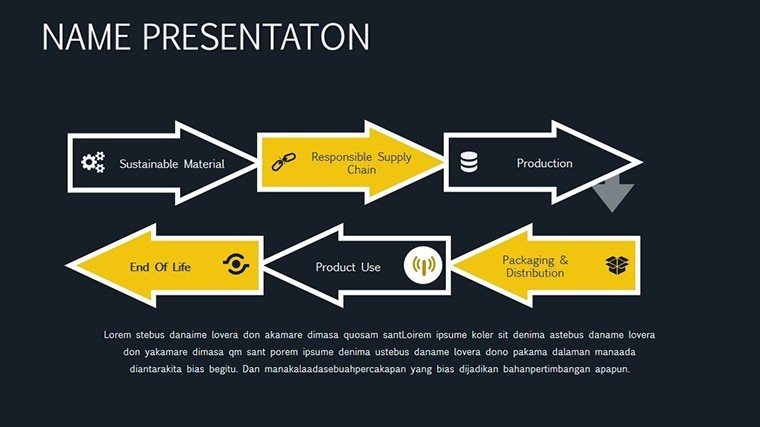
| Diagram categories | radar, timelines, phased rollouts |
| Animation support | fade-ins, zooms, paths |
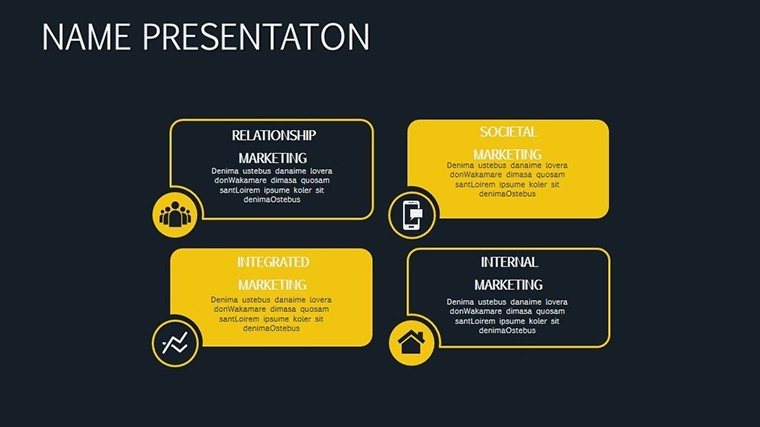
| Editable elements | shapes, text, palettes |
| Compatibility | PowerPoint 2016+, Google Slides |
| Export options | PPTX or PDF |
From Download to Final Deck
1. Open the .pptx file in PowerPoint (1 minute).
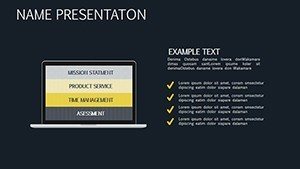
2. Replace placeholder text (3 minutes).
3. Apply brand colors through the master (2 minutes).
4. Adjust chart data or diagram labels (4 minutes).
5. Export as PPTX or PDF (1 minute).
Editing difficulty: Moderate.
How Consultants Use This in Client Work
Business development consultant
A consultant reused the animated radar charts across three client proposals by swapping color schemes and shortened preparation from three hours to 45 minutes.
Marketing strategist
A strategist adapted the timeline slides for five consecutive strategy workshops without redesign.
Download this template now and start editing in minutes.
Compared to Starting From Zero
Manual creation of 12 animated market slides takes 11 hours and expert skill.
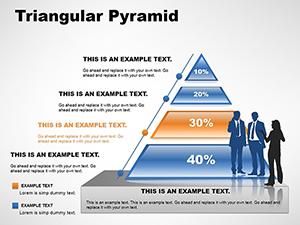
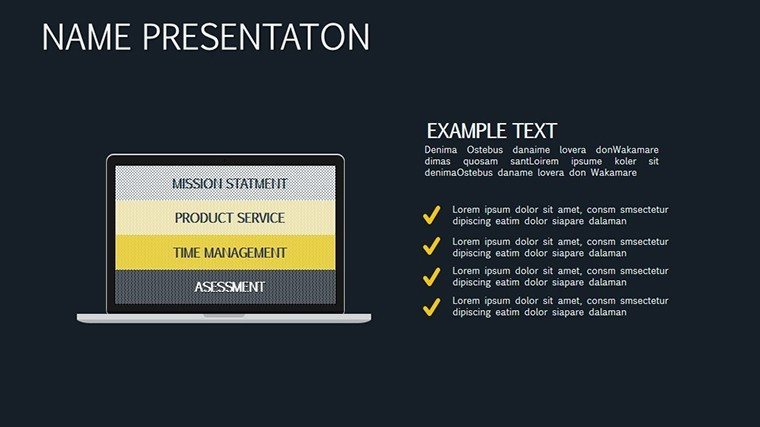
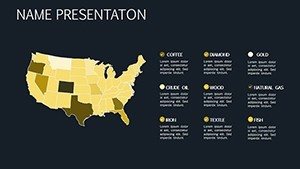
Labels inside radar shapes disappear during projection in live sales meetings.
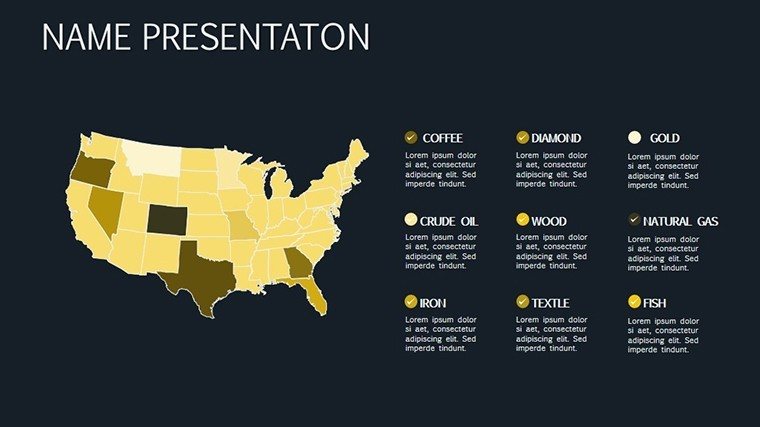
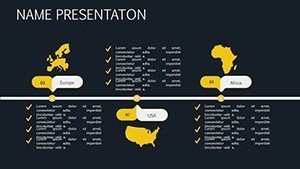
This layout keeps labels external with thin lines, ensuring visibility while animations emphasize growth phases.
Zone segmentation and color contrast guide the audience without extra work.
Secure the file today and present with confidence tomorrow.
FAQ
Which PowerPoint versions support this template?
The PPTX file opens in PowerPoint 2016 and newer plus Google Slides. Animations play natively. Mac compatibility is full. Test immediately after download.
How do I change the color scheme?
Access the slide master, update theme colors and all 12 slides update automatically. Save once. Animations retain the new palette in under two minutes.
What does the license permit?
Internal presentations and client work are allowed. Modify freely. Resale or redistribution is not permitted. One license covers all projects.
Is there a free version?
No free version is offered. The paid purchase supplies all 12 animated slides at once.
What file formats are included?
Only PPTX is included. It opens directly in PowerPoint and exports to PDF. No other formats ship.
Do I receive a refund if it does not fit?
A 30-day refund policy applies. Return the file if expectations are unmet. Full refund is processed after verification.
Strategists connect these charts to analysis chart templates for expansion planning. Consultants also reference customer loyalty charts for retention follow-ups.