Strategic Market Development PowerPoint Charts Download


Type: PowerPoint Charts template
Category: Analysis
Sources Available: .pptx
Product ID: PC00448
Template incl.: 12 editable slides
Expanding into new territories isn't just about ambition; it's about armed intelligence. Our Strategic Market Development PowerPoint Charts Template equips you with the visuals to map out conquests confidently. Boasting 12 versatile, editable slides, this resource is engineered for analysts, consultants, and executives tackling market growth. It solves the riddle of presenting multifaceted data - think segmentation, forecasts, and competitive edges - without losing your audience in the weeds.
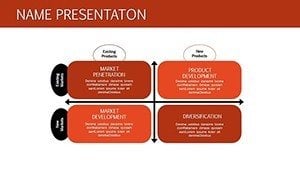
From visualizing entry strategies to projecting revenue streams, each chart is a stepping stone to informed decisions. Fully compatible with PowerPoint and Google Slides, it draws from proven frameworks like Porter's Five Forces, ensuring your slides carry authoritative weight. In real scenarios, such as a retail chain's regional rollout, users have harnessed these charts to secure funding by clearly delineating opportunities and risks.
Essential Features for Market Mastery
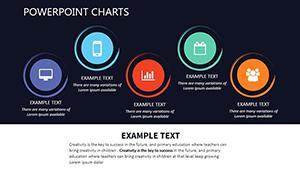
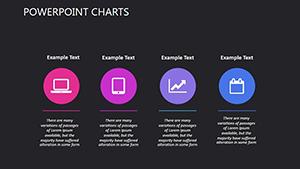
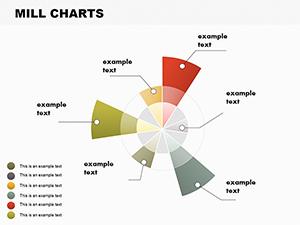
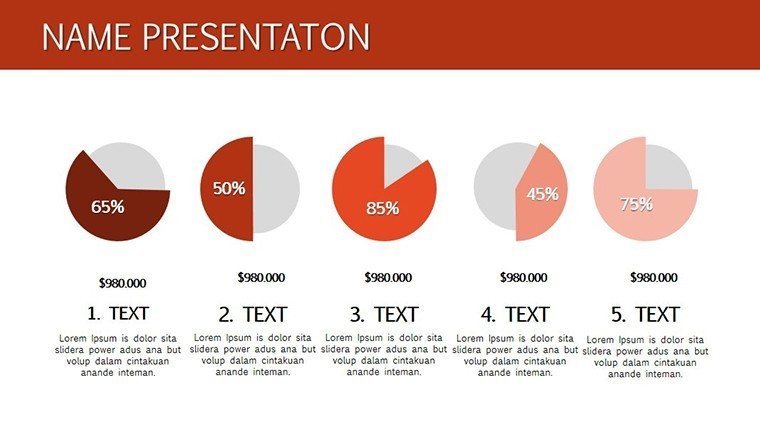
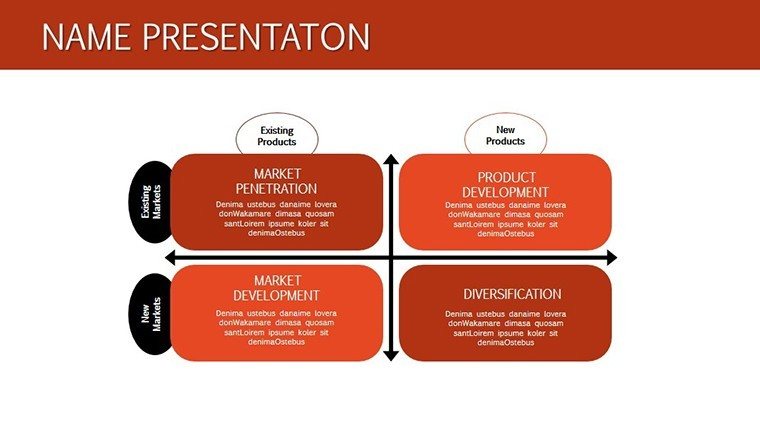
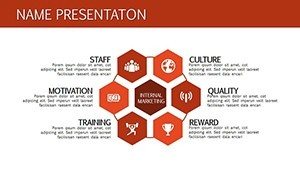
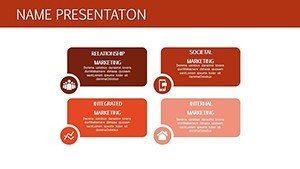
At the foundation are sleek, modern charts that prioritize visual appeal and data integrity. Bar graphs for sales comparisons, line plots for trend tracking, and matrices for competitive positioning - all customizable to your narrative. Alter layouts, fonts, and colors effortlessly, aligning with your brand's voice.
Efficiency is baked in: Pre-formatted elements save hours, letting you focus on insights. Incorporate terms like "market segmentation diagrams" or "growth projection visuals" seamlessly through diverse options. This design ethos mirrors strategies from Bain & Company, where clear visuals underpin high-stakes advisories.
- Visual Sophistication: Modern elements that engage without distraction.
- Customization Depth: Tailor every aspect for precise storytelling.
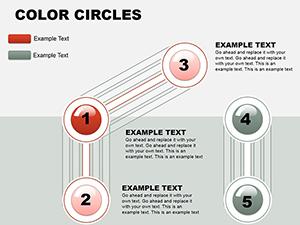
- Data-Driven Tools: Built-in grids for accurate scaling and labeling.
A consulting firm, for example, customized these for a client's diversification plan, yielding a 15% uptick in strategy adoption.
Practical Applications in Growth Scenarios
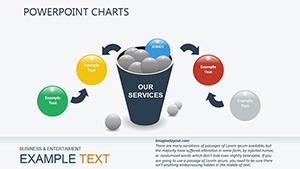
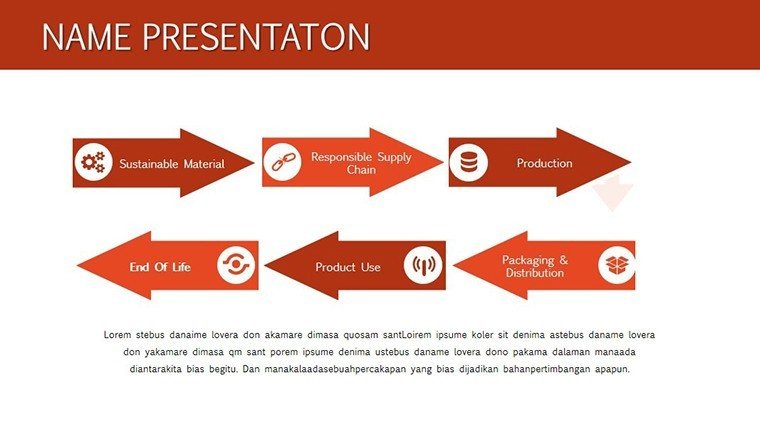
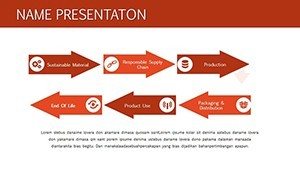
Envision charting a product's lifecycle extension into adjacent markets: Use a waterfall chart to break down incremental gains. This template thrives in stakeholder briefings, where static visuals must convey dynamic potentials.
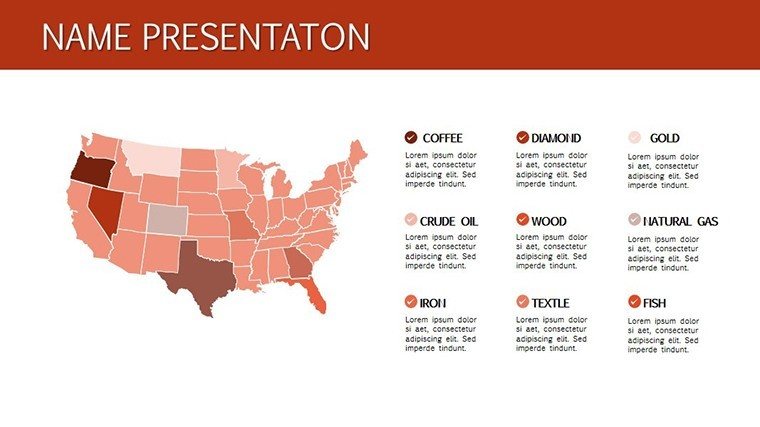
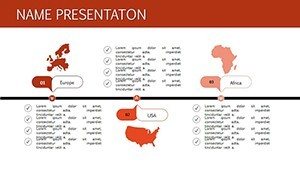
For marketing teams, it illuminates research findings, like consumer demographics via heatmaps. Consultants integrate it with data from Gartner reports for robust analyses. Surpassing generic slides, it offers strategic depth, fostering discussions over monologues.
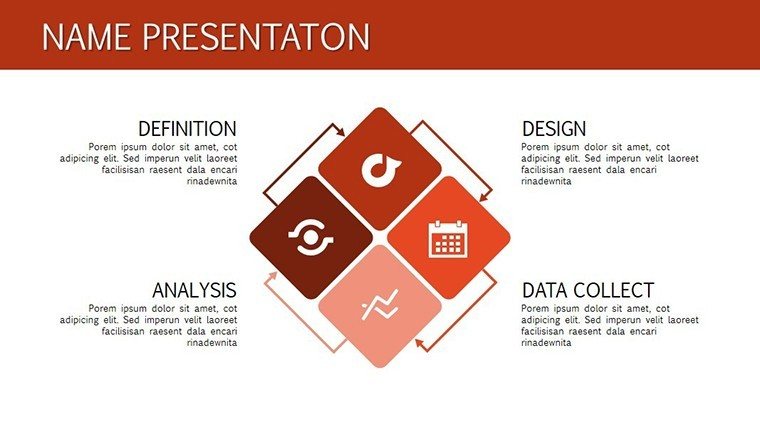
- Define your objective, e.g., highlighting untapped segments.
- Choose a chart, such as a bubble for size vs. potential.
- Populate with data, refining for clarity.
- Integrate into your deck for cohesive impact.
These methods, inspired by Harvard Business Review tactics, enhance your professional stature.
Tips for Strategic Visual Refinement
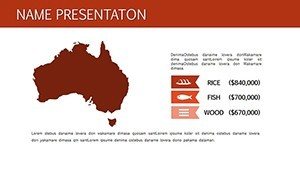
Layer data thoughtfully - combine charts for hybrid views, like overlaying trends on maps. For international expansions, use neutral palettes to appeal cross-culturally. Always validate on projectors; the scalable design ensures fidelity.
Build trust with embedded citations, echoing by referencing credible sources like World Bank market data.
Superior Value in Competitive Arenas
Outpace plain PowerPoint with charts that command attention. For $18, gain a strategic ally versus costly custom work. Businesses note enhanced clarity leading to quicker alignments.
Seize market momentum - download and strategize today.
Frequently Asked Questions
- Are the charts fully customizable?
- Yes, edit data, designs, and layouts freely.
- Compatible with Google Slides?
- Seamlessly, for collaborative edits.
- Suitable for large datasets?
- Yes, handles complex info with ease.
- What categories of charts?
- From trends to comparisons, all market-focused.
- Any tutorials included?
- Basic guides in the file for quick starts.