Professional Goods Concept PowerPoint Charts - Visualize Product Ideas


Type: PowerPoint Charts template
Category: Process, Illustrations
Sources Available: .ait, .dotx, .indt
Product ID: PC00441
Template incl.: 14 editable slides
Bringing a new product concept to life requires more than words; it demands visuals that capture essence and potential. Our Professional Goods Concept PowerPoint Charts Template steps in as your creative ally, featuring 14 meticulously designed editable slides. Tailored for product managers, retailers, and innovators, this template turns abstract ideas into tangible, persuasive presentations. Picture illustrating supply chain flows or consumer preference breakdowns with charts that pop, helping stakeholders grasp your vision instantly.
With a focus on goods-related concepts - like inventory tracking or market positioning - this tool offers flexible layouts that adapt to your narrative. Customize colors to reflect brand identity, fonts for emphasis, and elements to highlight key metrics. It's not merely about displaying data; it's about weaving a story that resonates, whether in a retail strategy session or a product launch brainstorm. Compatible across PowerPoint platforms, it facilitates easy sharing and edits, ensuring your concepts shine without technical glitches.
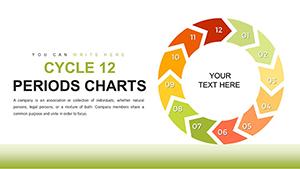
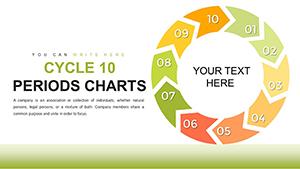
Stand out from rudimentary slides by incorporating themed visuals that align with industry trends, such as sustainable goods representations or e-commerce analytics. For example, use radial charts to depict product lifecycle stages, making complex processes accessible and engaging. This template empowers you to deliver value-driven content that accelerates decision-making and fosters innovation in competitive markets.
Essential Features for Concept Mastery
Delve into what makes this template indispensable for goods-focused professionals.
- Concept-Specific Charts: Radial, funnel, and pyramid designs ideal for illustrating hierarchies in product lines.
- Effortless Personalization: User-friendly tools to modify layouts, integrating your data seamlessly.
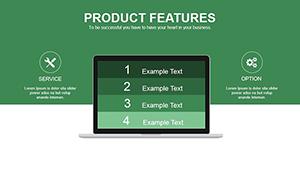
- Visual Enhancements: Icons representing goods categories, from consumer electronics to fashion items.
- Responsive Design: Adapts to various screen sizes for virtual or in-person pitches.
- Integration Tips: Link with Excel for real-time data updates.
These elements address common challenges, like vague concept depictions, by providing clear, actionable visuals.
In-Depth Slide Exploration
Navigate through the slides to see their practical power:
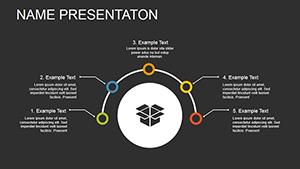
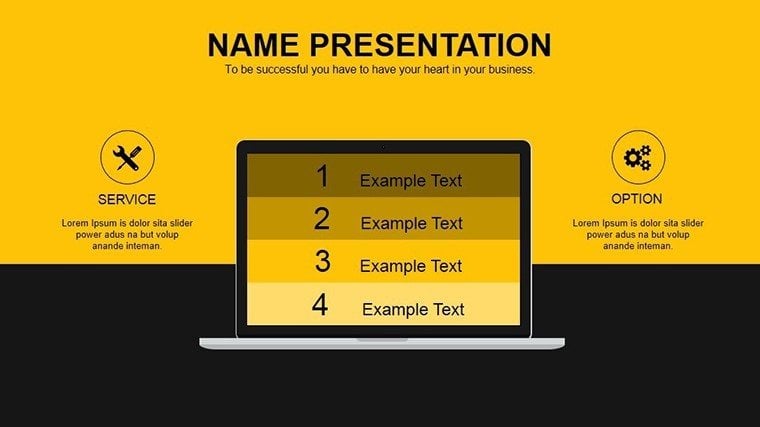
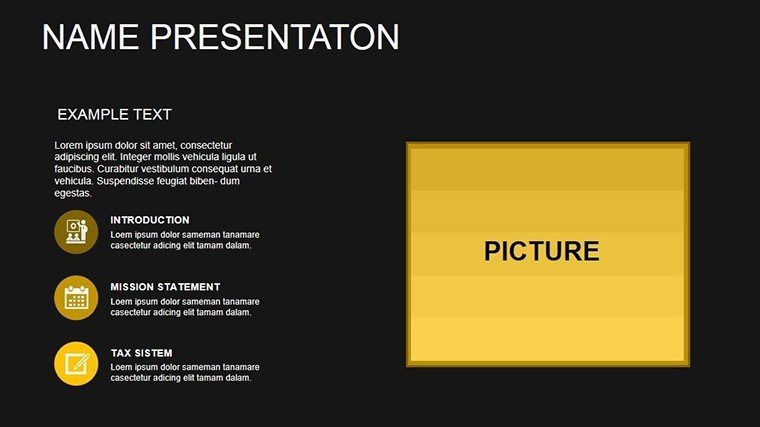
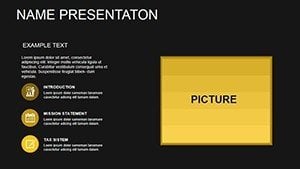
- Slide 1: Concept Overview: A central chart summarizing goods attributes for quick introductions.
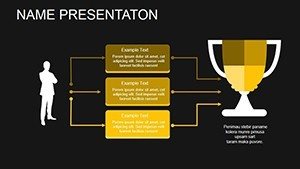
- Slides 2-4: Funnel Charts: Map customer journeys in retail scenarios.
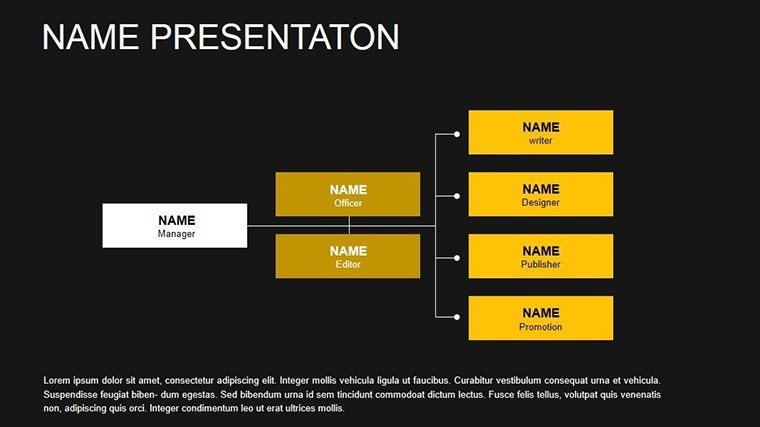
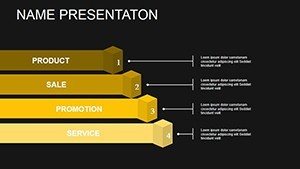
- Slides 5-7: Pyramid Structures: Hierarchize product features or pricing tiers.
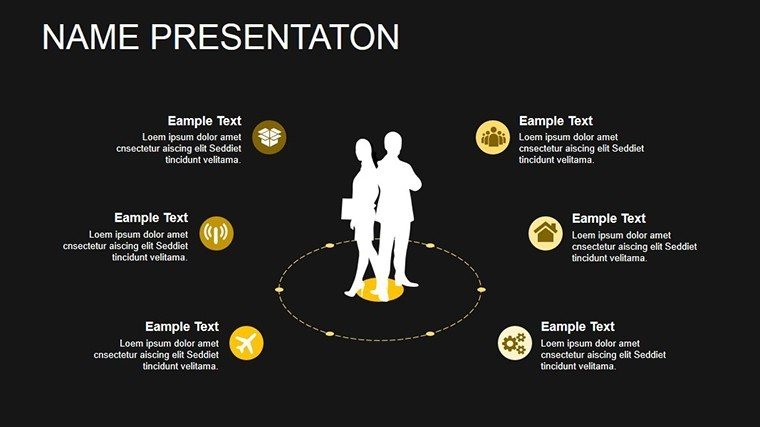
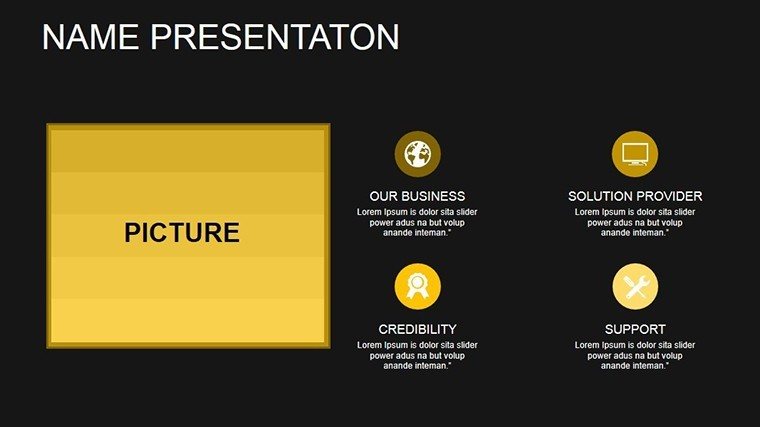
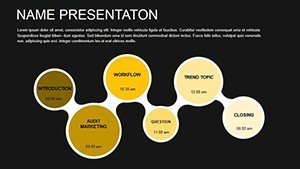
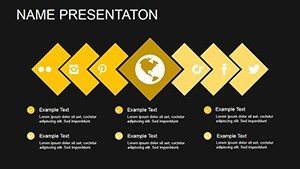
- Slides 8-10: Radial Diagrams: Explore market segments radiating from core concepts.
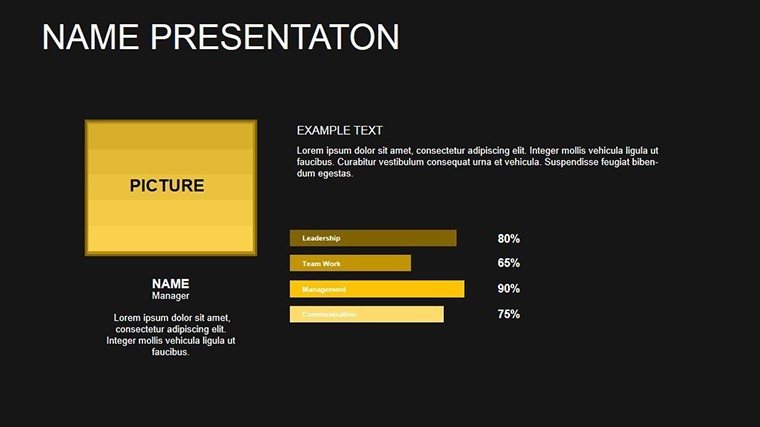
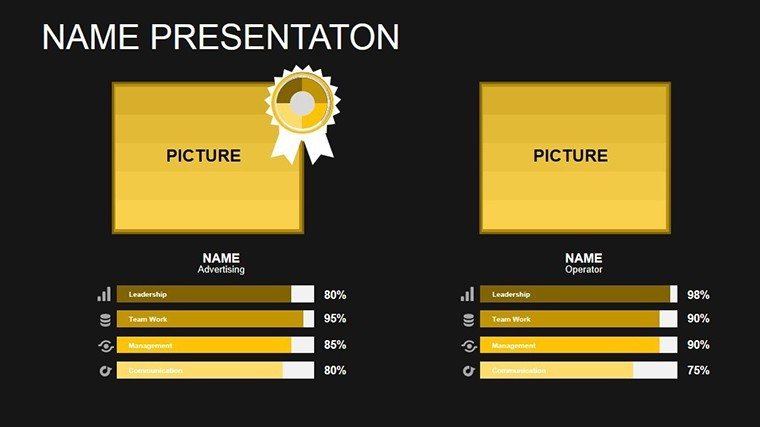
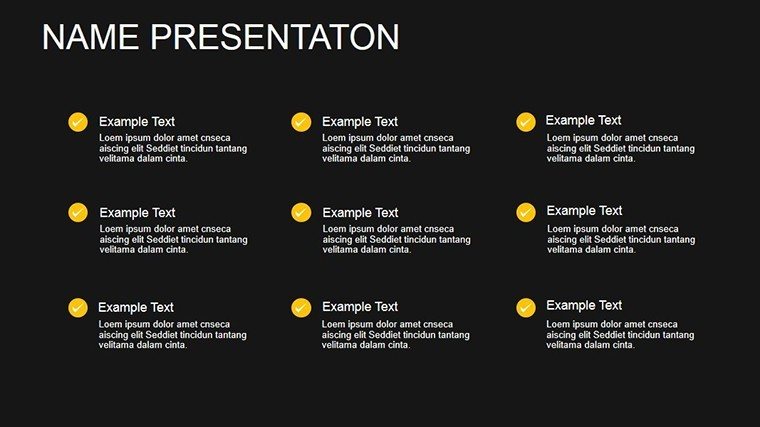
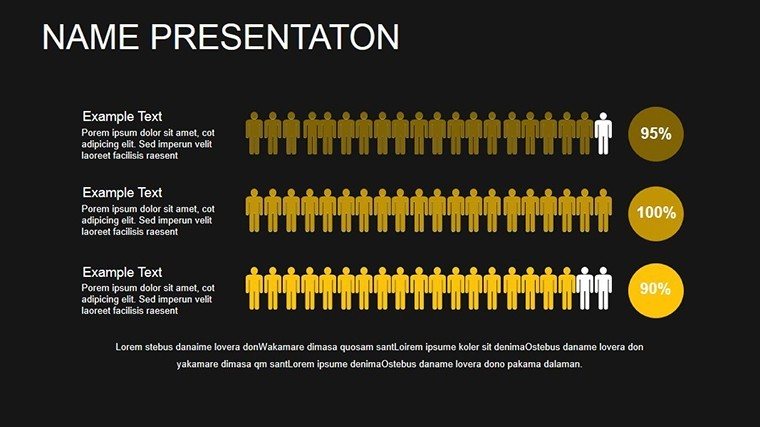
- Slides 11-14: Custom Infographics: Blend text and visuals for detailed explanations.
Pre-filled with placeholder data, these slides accelerate your preparation, allowing focus on refinement.
Practical Use Cases in Goods Management
Apply this template in real scenarios: For a retail chain, use funnel charts to analyze sales pipelines, identifying bottlenecks early. In product development meetings, pyramid charts can prioritize features based on consumer feedback, streamlining iterations. Unlike standard PowerPoint defaults, which lack thematic depth, this offers goods-oriented icons, cutting design time by half.
Incorporate best practices from bodies like the Consumer Goods Forum, ensuring your visuals support sustainable strategies. A retail case study revealed improved team alignment when using conceptualized charts, leading to faster market entries. Tips: Layer animations sparingly to guide viewer focus, and pair with storytelling for memorable impacts.
Workflow Guide for Seamless Adoption
Integrate effortlessly:
- Open in your preferred software and select a base slide.
- Input concept data, adjusting for accuracy.
- Tweak visuals to align with your goods theme.
- Rehearse transitions for smooth delivery.
- Share and gather feedback for iterations.
This method transforms ideas into polished presentations, enhancing collaboration.
Seize the Opportunity to Innovate
Elevate your goods concepts from ordinary to extraordinary with this template. It's more than slides - it's a catalyst for breakthrough thinking. Download and begin conceptualizing success now.
Frequently Asked Questions
How do I customize the charts for my brand?
Simply select elements and use the built-in tools to change colors, fonts, and add logos.
Does it support data import from spreadsheets?
Yes, easily link or copy from Excel for dynamic updates.
Is animation included in the slides?
Basic transitions are pre-set, with options to add more.
What file formats are available?
Primarily PPTX, with compatibility for other formats.