Product Development Charts - Editable PPTX


Type: PowerPoint Charts template
Category: Process, Illustrations
Sources Available: .pptx
Product ID: PC00440
Template incl.: 14 editable slides
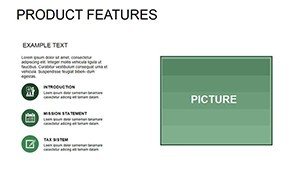
Files and Formats Included in the Product Development Set
14 editable slides come in the download.
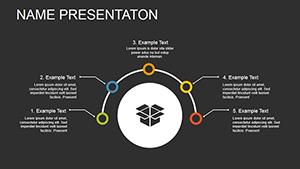
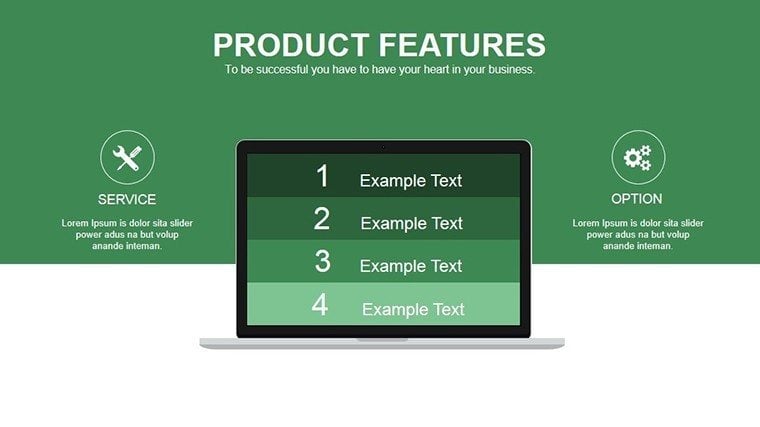
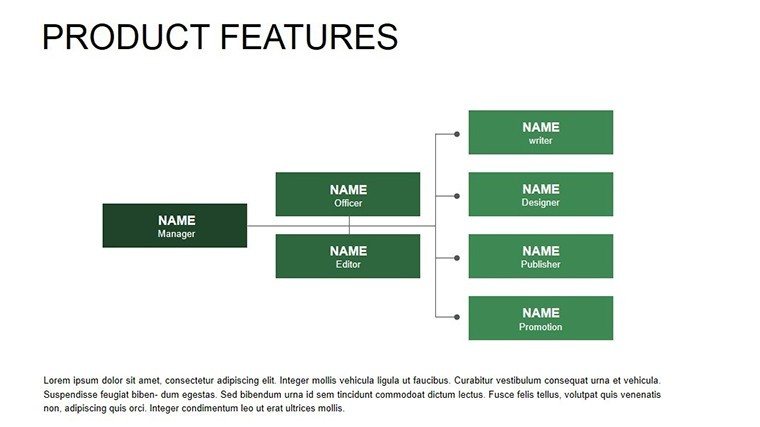
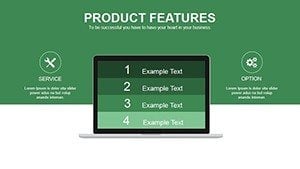
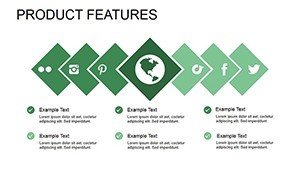
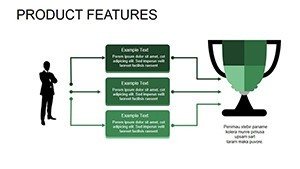
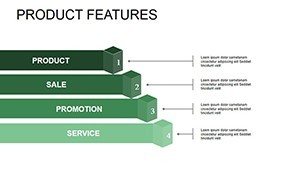
Milestone charts work together with risk layouts to support full product narratives.
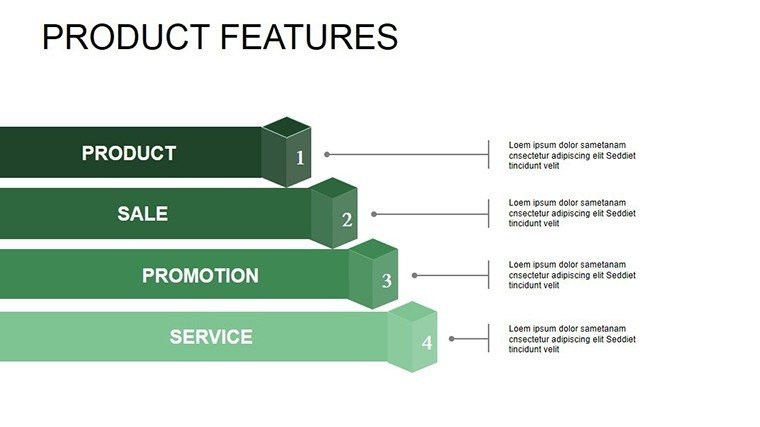
One specific visual characteristic is 3D perspective on phase diagrams unlike flat single layouts in related sets.
At a Glance
| Feature | Details |
|---|---|
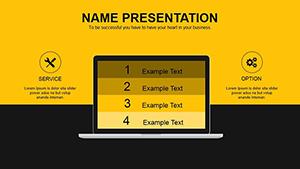
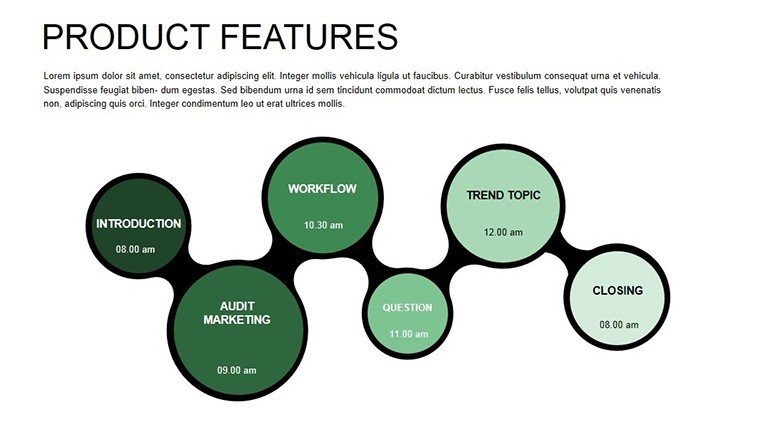
| Slides / diagrams included | 14 milestone and risk charts |
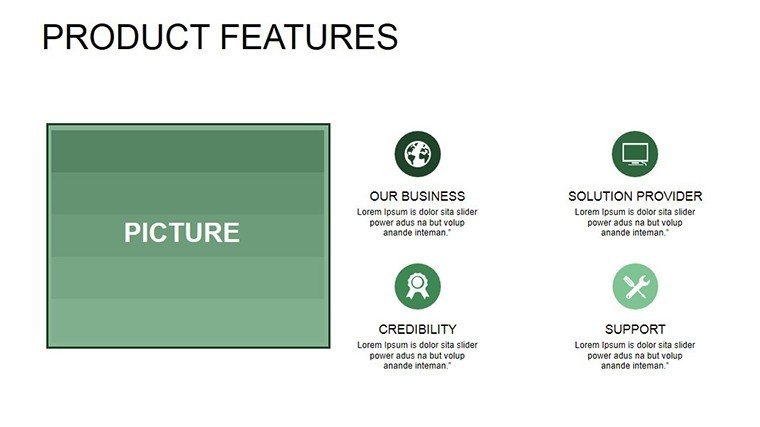
| Editable shapes | recolor and resize independently |
| Icon layers | replace without affecting structure |
| Color theme adjustments | slide master compatible |
| Aspect ratio | 16:9 |
| File formats | PPTX |
From Strategy Decks to Boardroom Pitches
Product managers in engineering adapt the slides for performance reviews by swapping color schemes across five briefings.
Innovators in tech cut preparation from 3 hours to 40 minutes.
Download and drive innovation visuals.
Customization in 5 Steps
Moderate difficulty.
- Step 1 - Open the .pptx (1 minute)
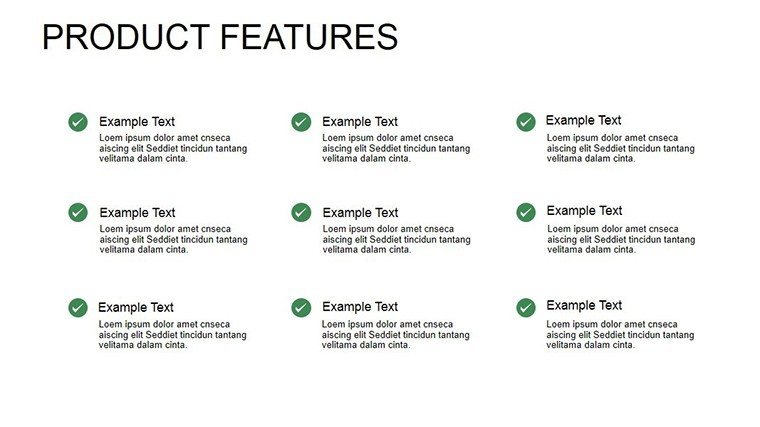
- Step 2 - Replace text (3 minutes)
- Step 3 - Update master colors (2 minutes)
- Step 4 - Edit icons and connectors (4 minutes)
- Step 5 - Export (1 minute)
Why This Template, Not a Blank Slide
Manual replication needs 4 hours and advanced skill.
3D perspective aids hierarchy perception on large screens.
This fits data structure better than flat alternatives.
Get the file now.
PowerPoint Version Compatibility
Which PowerPoint versions open this file?
PowerPoint 2016 and later including 365.
How do I change the color scheme?
Slide master view, update palette once.
What does the license allow?
Client work allowed, no resale.
What is included in the paid version?
14 editable slides.
What software opens the file?
PowerPoint 2016+.
What is the refund policy?
14 days if file does not open.
Engineers pair these with process charts.
Teams adapt for workshops.
Innovators check animation process sets.