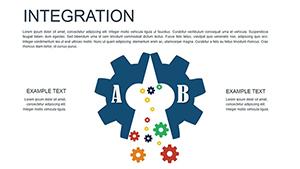
Integration Animation PowerPoint Charts - Dynamic Data Flows


Type: PowerPoint Charts template
Category: Cycle
Sources Available: .pptx
Product ID: PC00438
Template incl.: 16 editable slides
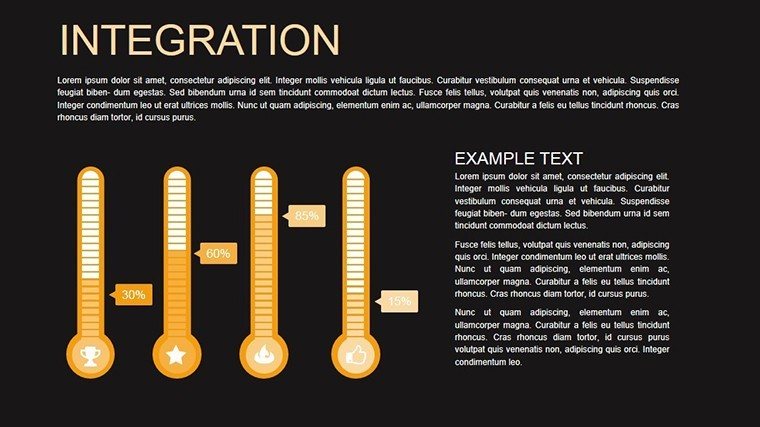
Data integration is pivotal in today's interconnected world, yet explaining it can feel abstract. Our Integration Animation PowerPoint Charts Template brings clarity with 16 editable slides, perfect for data analysts, IT pros, and educators. Animate data merges, system links, and workflows to make concepts tangible, captivating your audience from start to finish.
Customization shines: adjust animations, colors, and fonts to fit your scenario. Variety in charts - like line for trends, pie for compositions - ensures versatility. Fully compatible with PowerPoint versions, it integrates into your toolkit effortlessly, inspired by tech standards like API designs for authentic visuals.
For tech pitches, animate API integrations; in classes, show database merges. This surpasses static slides by adding motion, enhancing understanding without overload.
Standout Features for Integration Mastery
Features designed for animated excellence.
- Animation Variety: Fades, zooms for emphasis.
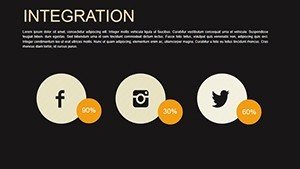
- Chart Diversity: Line, pie, bar, scatter.
- Easy Edits: User interface for quick changes.
- Brand Matching: Custom styles.
- Guide Included: Startup instructions.
Solves issues like dull data displays.
Slide Details Unveiled
Peruse the collection:
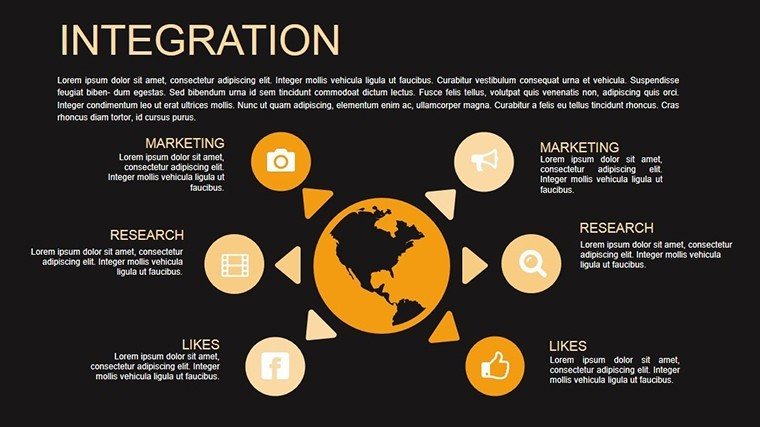
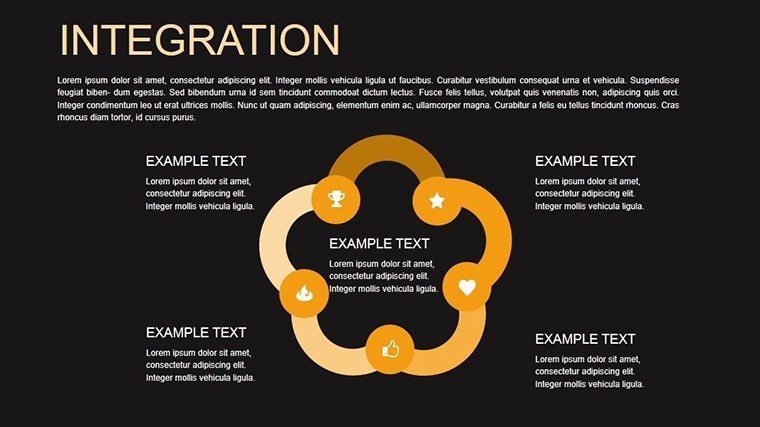
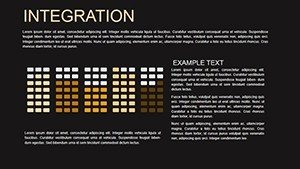
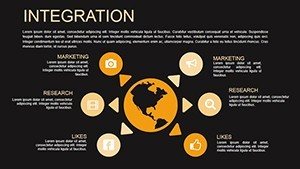
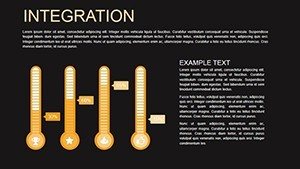
- Slide 1: Integration Hub: Central overview.
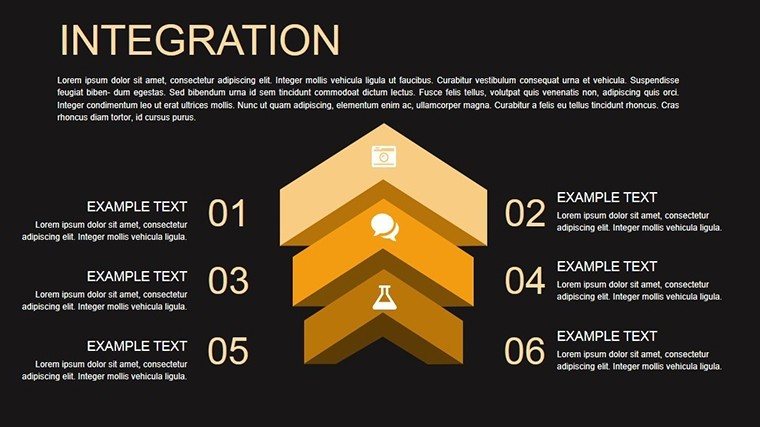
- Slides 2-5: Flow Animations: Data paths.
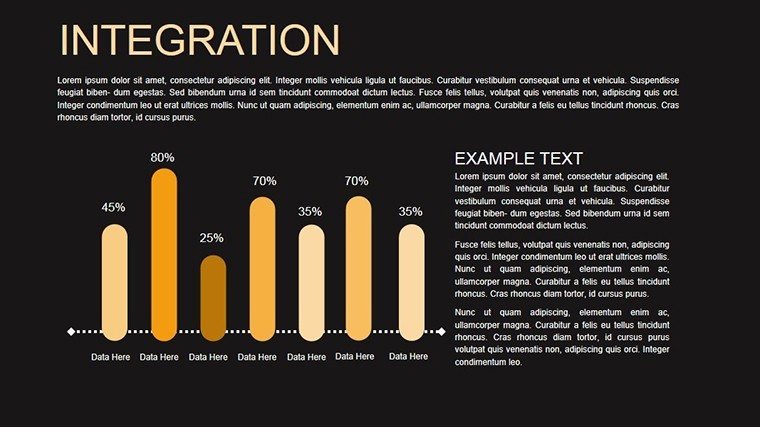
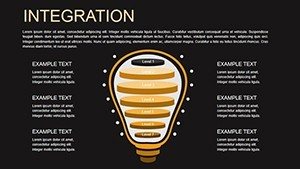
- Slides 6-9: Trend Lines: Time-based integrations.
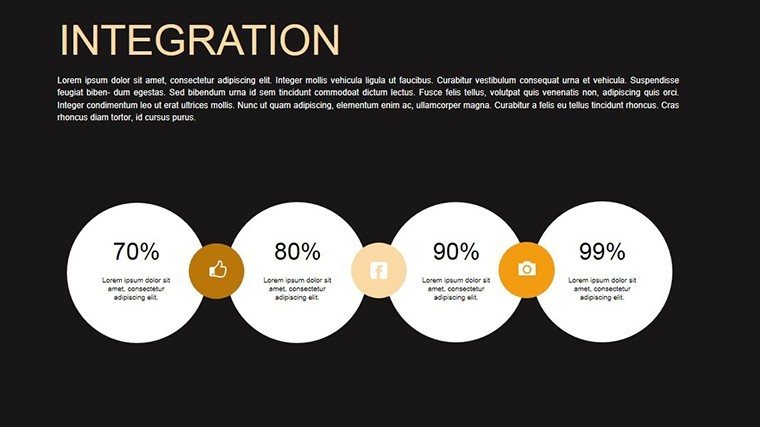
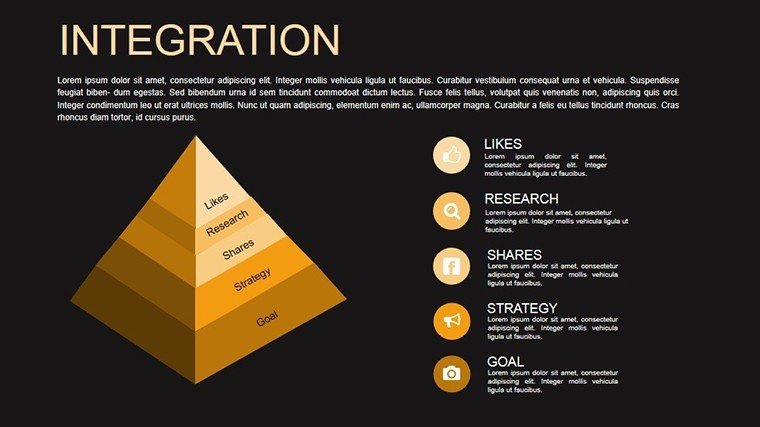
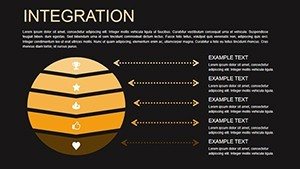
- Slides 10-12: Composition Pies: Part-whole views.
- Slides 13-16: Advanced Scatters: Correlations.
Ready for immediate use.
Integration in Action
Scenarios: Animate cloud migrations for IT teams; teach ETL processes in courses. Beats basics with animations, boosting engagement per edtech research. Case: Analyst firm saw better stakeholder buy-in.
Tips: Time animations to narrative, use for virtual demos.
Setup Process
Simple steps:
- Open file.
- Add data.
- Set animations.
- Preview.
- Deploy.
Accelerates creation.
Animate Your Integrations Now
Unlock dynamic presentations. Get this template for integrated success.
Frequently Asked Questions
Can I control animation speeds?
Yes, fully adjustable.
Works on all PowerPoint?
Compatible across versions.
Expand slide count?
Duplicate as needed.
Includes tutorials?
Yes, comprehensive guide.
Business license?
Included for pro use.