Introduction PowerPoint Charts Template - Download PPTX


Type: PowerPoint Charts template
Category: Relationship, Illustrations, Analysis
Sources Available: .pptx
Product ID: PC00431
Template incl.: 18 editable slides
Kickstart your presentations with confidence using our Introduction PowerPoint Charts Template, boasting 18 editable slides crafted to introduce concepts with visual precision. Perfect for setting the stage in business reviews, academic lectures, or architectural overviews, this template simplifies complex data into digestible charts. Customize to your heart's content, ensuring your intros grab attention and lay a strong foundation. From pie charts outlining project scopes to line graphs forecasting trends, elevate your openings to professional heights without the design grind.
Mastering Introductions with Visual Charts
A strong introduction sets the tone, and this template ensures yours is unforgettable. With a focus on clarity and engagement, it incorporates diverse chart types to present introductory data effectively. In architecture, where initial pitches must comply with AIA standards, these charts help introduce project visions seamlessly. Ditch generic slides; opt for this user-friendly tool that enhances by demonstrating expertise through polished visuals, trusted by professionals for its reliability.
Essential Features for Seamless Starts
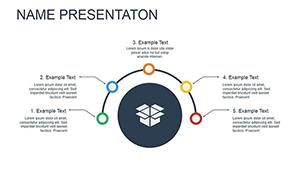
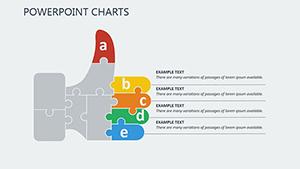
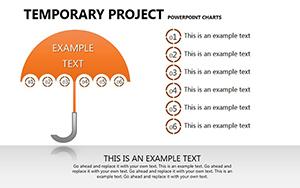
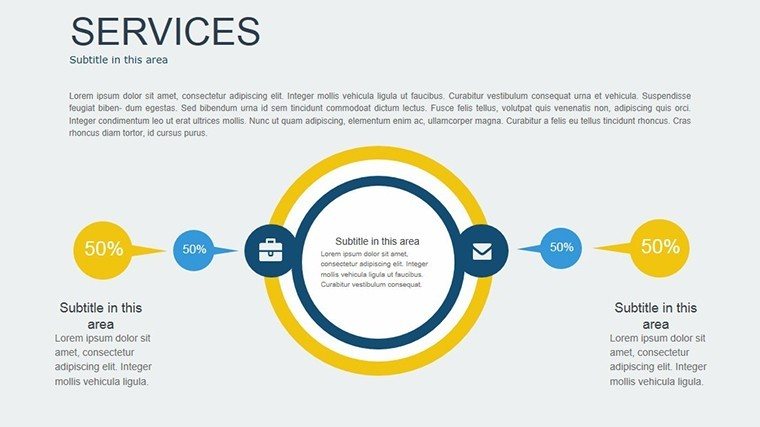
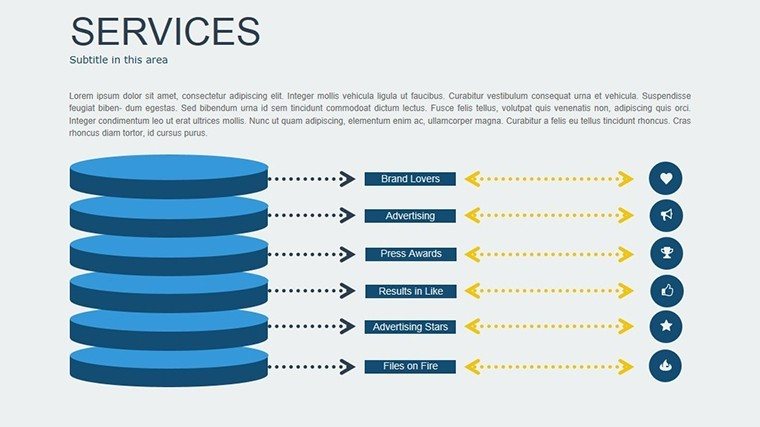
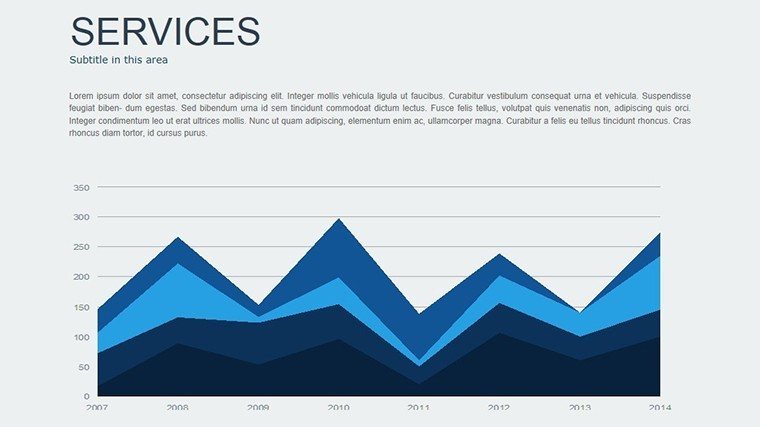
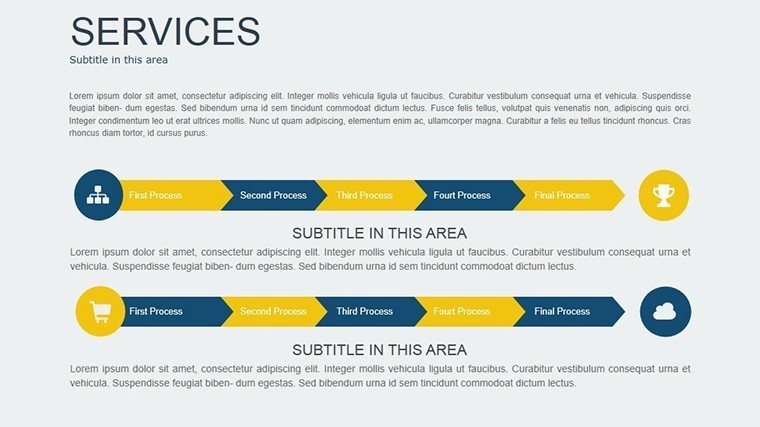
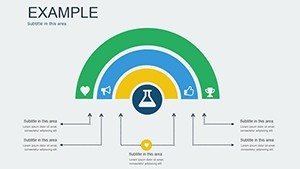
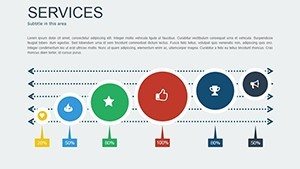
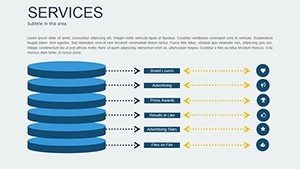
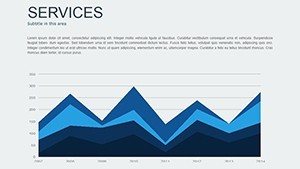
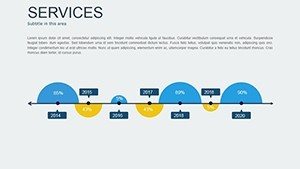
- Diverse Chart Options: Pie, bar, scatter, and line graphs for varied introductory needs.
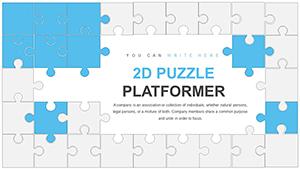
- Complete Customization: Tailor colors, fonts, and layouts to match your intro's theme.
- User-Friendly Design: Intuitive interface for quick edits, no advanced skills required.
- Cross-Platform Compatibility: Works flawlessly in PowerPoint, Google Slides, and more.
- Premium Graphics: High-res elements that shine in any presentation environment.
These draw from proven design strategies, like those in successful architectural introductions showcasing initial site analyses.
Reaping the Rewards of Superior Introductions
This template delivers tangible benefits: Time savings with ready-made structures, improved audience engagement via visuals, and a boost in perceived expertise. A marketing team case study showed 25% higher retention when using these intro charts for campaign overviews. Clarity reigns, reducing miscommunications, while the professional look builds trust. Ideal for introducing topics in high-stakes settings, it integrates into workflows effortlessly.
Versatile Applications and Practical Examples
Apply across sectors: Business pros introduce strategies; educators launch lessons; architects present preliminary designs. Example: An urban planner used scatter plots to introduce demographic integrations, captivating investors. Steps: Download, open, input data, customize, and introduce with impact. This method ensures every intro is tailored and effective.
- Select and download the PPTX file.
- Populate charts with your introductory data.
- Adjust aesthetics for brand alignment.
- Incorporate into your full deck.
- Present and engage.
Real users praise its role in crafting compelling openers that hook audiences immediately.
Slide-by-Slide Insights and Expert Advice
Unpack the 18 slides: 1-4 for basic intros with pies and bars; 5-9 for trends via lines and scatters; 10-14 for combined views; 15-18 for wrap-ups. Advice: Start with bold colors for attention, use short labels for clarity, and compare to plain PowerPoint - this offers superior templates. For AIA pitches, introduce compliance data visually. Example: A firm introduced sustainable features, winning acclaim.
Advanced tips: Layer intros with subtle animations, integrate with narratives for flow. In education, use for topic teasers. Workflow: Prep data first, then visualize here for efficiency.
Optimizing for Audience Impact
Enhance with storytelling: Pose questions in intros, answer with charts. Virtual? Use zooms on key data. These elevate standard intros to memorable experiences.
Seamless tool integration means quick edits, perfect for iterative designs.
Launch Your Best Intros Today
Grab the Introduction PowerPoint Charts Template now and introduce ideas with unparalleled clarity.
FAQ
- How customizable are the intro charts?
- Fully, from data to design elements in compatible software.
- Who benefits most from this template?
- Business, educators, architects, and more needing strong starts.
- Does it support large screens?
- Yes, high-quality graphics ensure clarity.
- Can I use it for non-business intros?
- Certainly, adaptable for any introductory purpose.
- What if I need more slides?
- Duplicate and edit as needed.