00% off everything!
SALE ENDS TODAY, Saturday November 0
Promo code "00LAYOUTS"
Time Left to Save
00:00:00

3D Cubes PowerPoint Charts: Add Dimension to Your Data Narratives

3
399 ratings
3D Cubes PowerPoint Charts: Add Dimension to Your Data Narratives - Slide #0
3D Cubes PowerPoint Charts: Add Dimension to Your Data Narratives - Slide #1
3D Cubes PowerPoint Charts: Add Dimension to Your Data Narratives - Slide #2
3D Cubes PowerPoint Charts: Add Dimension to Your Data Narratives - Slide #3
3D Cubes PowerPoint Charts: Add Dimension to Your Data Narratives - Slide #4
3D Cubes PowerPoint Charts: Add Dimension to Your Data Narratives - Slide #5
3D Cubes PowerPoint Charts: Add Dimension to Your Data Narratives - Slide #6
3D Cubes PowerPoint Charts: Add Dimension to Your Data Narratives - Slide #7
3D Cubes PowerPoint Charts: Add Dimension to Your Data Narratives - Slide #8
3D Cubes PowerPoint Charts: Add Dimension to Your Data Narratives - Slide #9
3D Cubes PowerPoint Charts: Add Dimension to Your Data Narratives - Slide #10
3D Cubes PowerPoint Charts: Add Dimension to Your Data Narratives - Slide #11
3D Cubes PowerPoint Charts: Add Dimension to Your Data Narratives - Slide #12
3D Cubes PowerPoint Charts: Add Dimension to Your Data Narratives - Slide #13
3D Cubes PowerPoint Charts: Add Dimension to Your Data Narratives - Slide #14
3D Cubes PowerPoint Charts: Add Dimension to Your Data Narratives - Slide #15
3D Cubes PowerPoint Charts: Add Dimension to Your Data Narratives - Slide #16
3D Cubes PowerPoint Charts: Add Dimension to Your Data Narratives - Slide #17
3D Cubes PowerPoint Charts: Add Dimension to Your Data Narratives - Slide #18
3D Cubes PowerPoint Charts: Add Dimension to Your Data Narratives - Slide #19
3D Cubes PowerPoint Charts: Add Dimension to Your Data Narratives - Slide #20
3D Cubes PowerPoint Charts: Add Dimension to Your Data Narratives - Slide #21
3D Cubes PowerPoint Charts: Add Dimension to Your Data Narratives - Slide #22
3D Cubes PowerPoint Charts: Add Dimension to Your Data Narratives - Slide #23
3D Cubes PowerPoint Charts: Add Dimension to Your Data Narratives - Slide #24
3D Cubes PowerPoint Charts: Add Dimension to Your Data Narratives - Slide #25
3D Cubes PowerPoint Charts: Add Dimension to Your Data Narratives - Slide #26
3D Cubes PowerPoint Charts: Add Dimension to Your Data Narratives - Slide #27
3D Cubes PowerPoint Charts: Add Dimension to Your Data Narratives - Slide #28
3D Cubes PowerPoint Charts: Add Dimension to Your Data Narratives - Slide #29
3D Cubes PowerPoint Charts: Add Dimension to Your Data Narratives - Slide #30
3D Cubes PowerPoint Charts: Add Dimension to Your Data Narratives - Slide #31
3D Cubes PowerPoint Charts: Add Dimension to Your Data Narratives - Slide #32
3D Cubes PowerPoint Charts: Add Dimension to Your Data Narratives - Slide #33
3D Cubes PowerPoint Charts: Add Dimension to Your Data Narratives - Slide #34
3D Cubes PowerPoint Charts: Add Dimension to Your Data Narratives - Slide #35
3D Cubes PowerPoint Charts: Add Dimension to Your Data Narratives - Slide #36
3D Cubes PowerPoint Charts: Add Dimension to Your Data Narratives - Slide #37
3D Cubes PowerPoint Charts: Add Dimension to Your Data Narratives - Slide #38
3D Cubes PowerPoint Charts: Add Dimension to Your Data Narratives - Slide #39
3D Cubes PowerPoint Charts: Add Dimension to Your Data Narratives - Slide #40
3D Cubes PowerPoint Charts: Add Dimension to Your Data Narratives - Slide #41
thumbnail slide #0
thumbnail slide #1
thumbnail slide #2
thumbnail slide #3
thumbnail slide #4
thumbnail slide #5
thumbnail slide #6
thumbnail slide #7
thumbnail slide #8
thumbnail slide #9
thumbnail slide #10
thumbnail slide #11
thumbnail slide #12
thumbnail slide #13
thumbnail slide #14
thumbnail slide #15
thumbnail slide #16
thumbnail slide #17
thumbnail slide #18
thumbnail slide #19
thumbnail slide #20
thumbnail slide #21
thumbnail slide #22
thumbnail slide #23
thumbnail slide #24
thumbnail slide #25
thumbnail slide #26
thumbnail slide #27
thumbnail slide #28
thumbnail slide #29
thumbnail slide #30
thumbnail slide #31
thumbnail slide #32
thumbnail slide #33
thumbnail slide #34
thumbnail slide #35
thumbnail slide #36
thumbnail slide #37
thumbnail slide #38
thumbnail slide #39
thumbnail slide #40
thumbnail slide #41

Type: PowerPoint Charts template

Category: 3D, Cubes

Sources Available: .pot, .potx

Product ID: PC00005

Template incl.: 42 editable slides

Purchase this template
$ 26.00

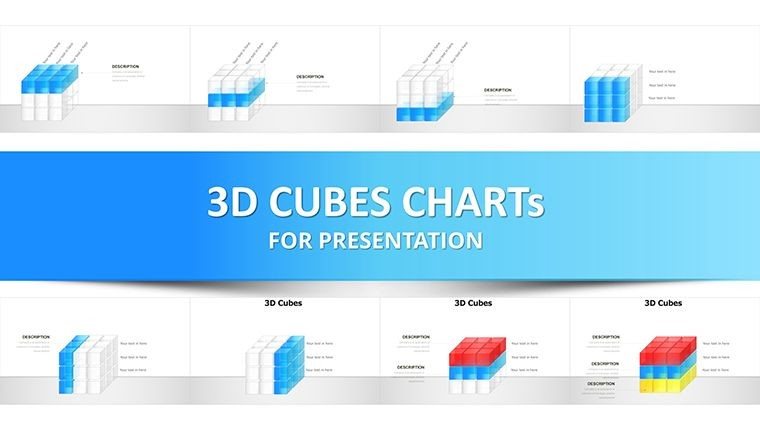
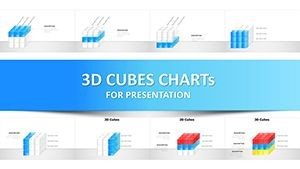
When presentations need to rise above the flat and forgettable, our 3D Cubes PowerPoint Charts template steps in with 42 editable slides that infuse depth and dynamism. Crafted for business leaders, educators, and creatives, it uses cubic structures to represent multifaceted data - like organizational hierarchies or product feature matrices - in a visually immersive way. Rooted in design principles from the AIGA, these cubes turn abstract info into tangible blocks, making complex ideas accessible. Perfect for remote collaborations via Google Slides compatibility, it's your tool for building presentations that stack up against the competition. From illustrating sales funnels in marketing meetings to stacking knowledge layers in lectures, these cubes encourage audiences to 'build' understanding mentally. Let's cube your content and elevate engagement - start stacking success today.

Harnessing Cubic Power for Visual Depth

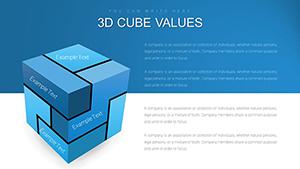
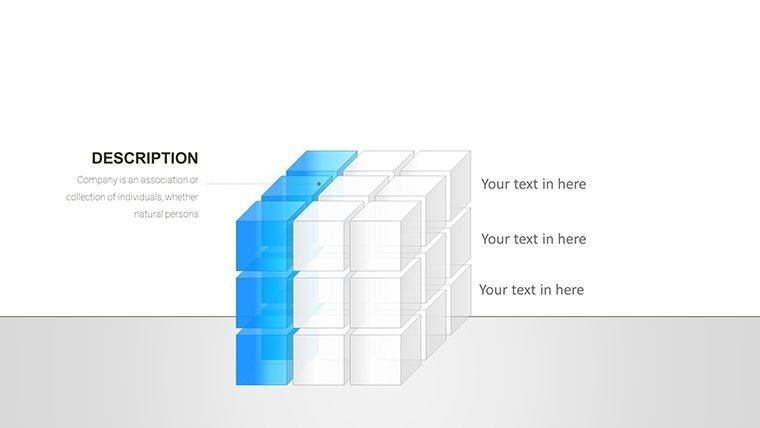
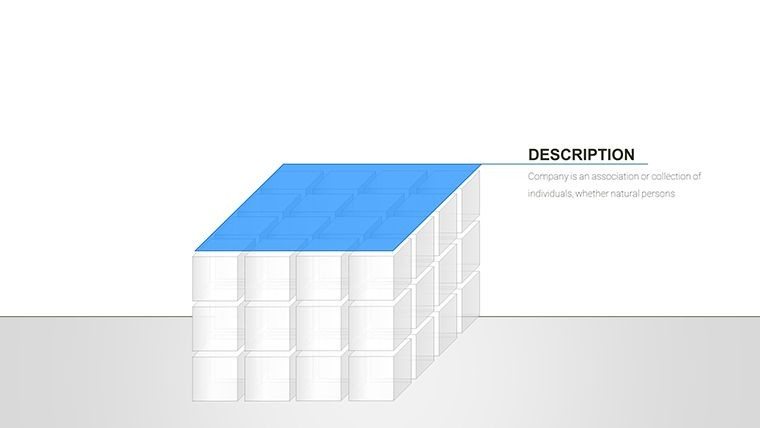
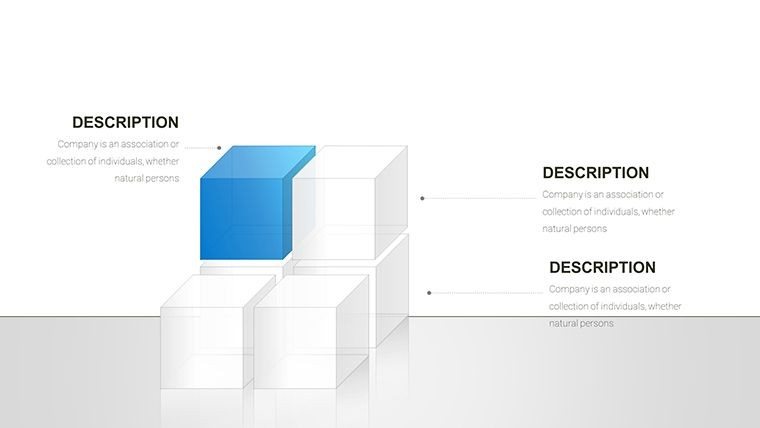
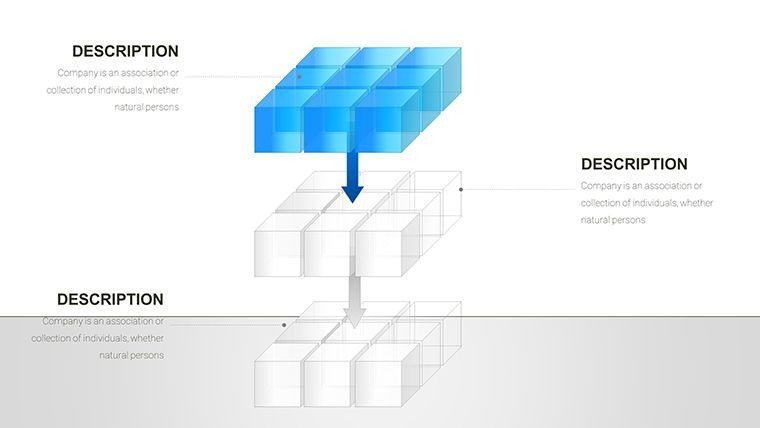
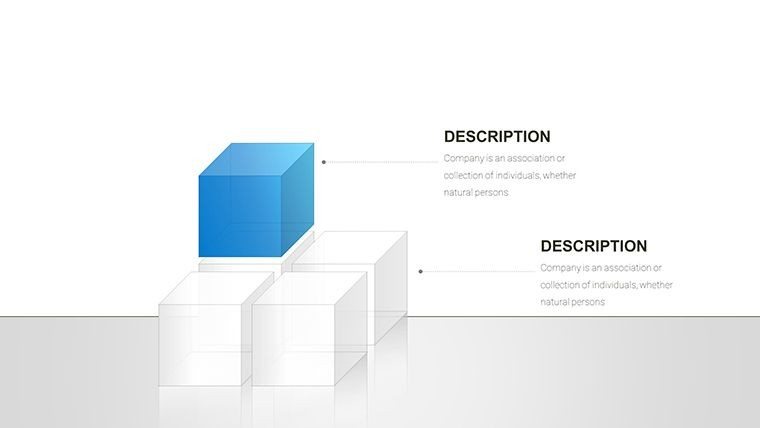
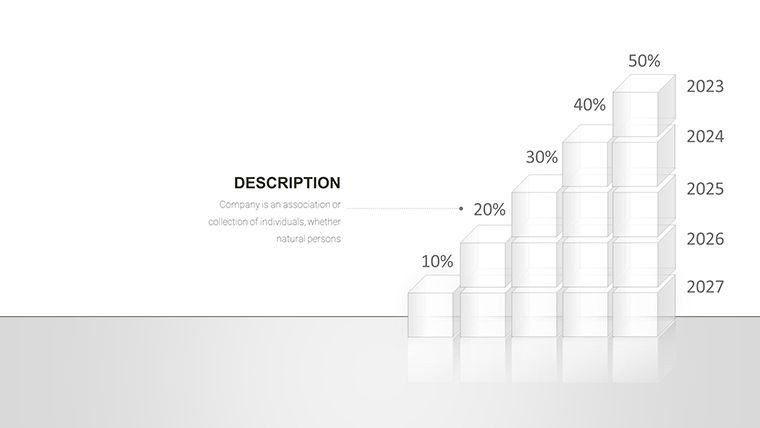
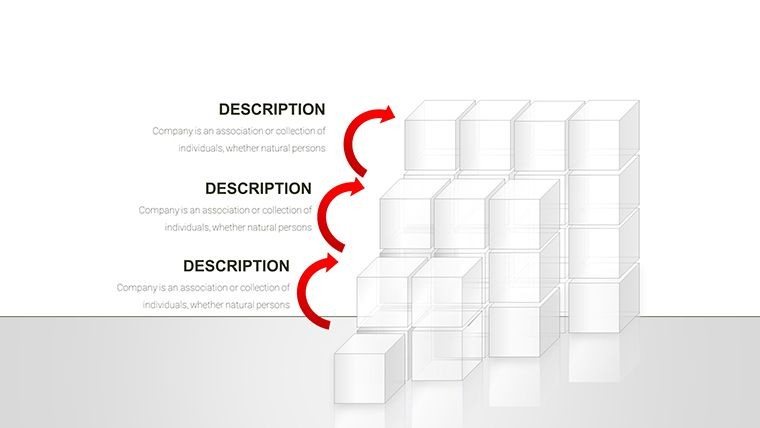
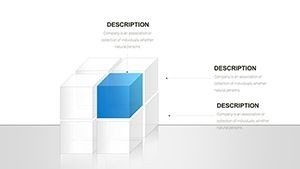
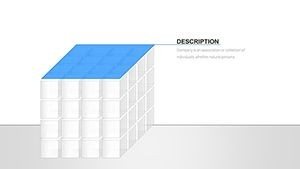
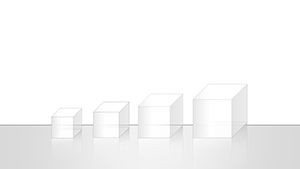
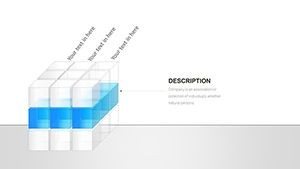
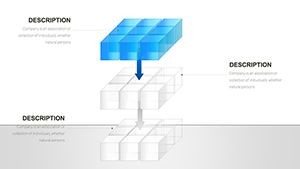
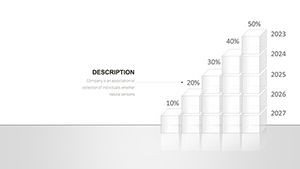
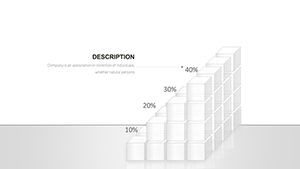
The template's core is its stacked, floating, and interconnected cubes, each face a canvas for data. Slide #6's tower chart, for example, builds project timelines vertically, with adjustable heights for emphasis - ideal for Gantt-like overviews without the complexity.

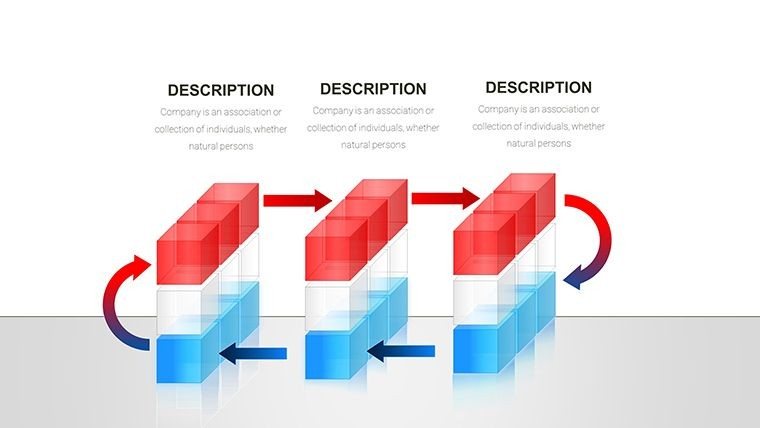
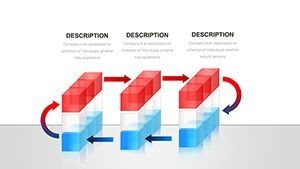
In educational realms, slide #14 cubes dissect scientific processes, like chemical reactions, allowing labels on multiple sides for comprehensive views. Marketers can stack consumer journey stages on slide #22, integrating icons for vivid storytelling.

Core Features That Build Strong Foundations

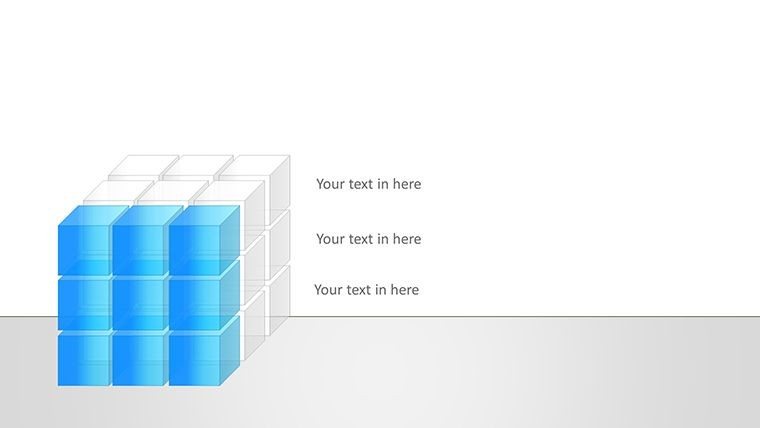
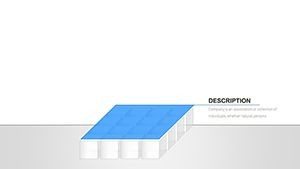
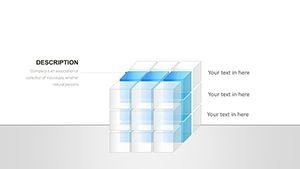
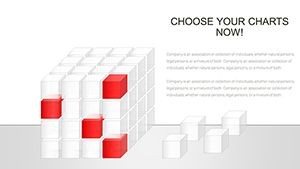
  • Textural Variety: Choose glossy, matte, or patterned cubes for thematic matching.
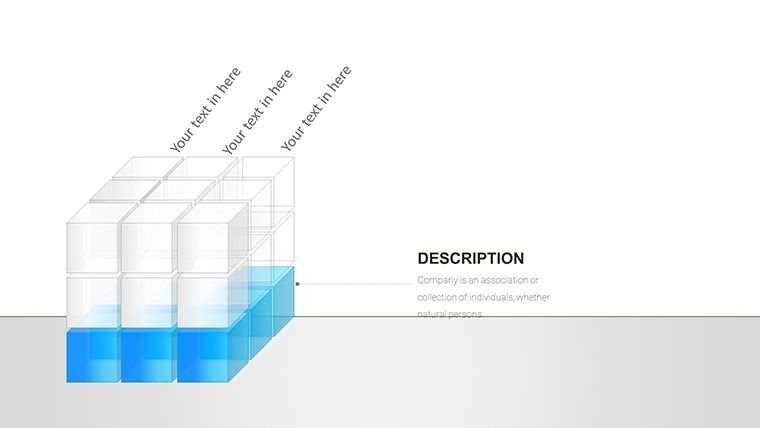
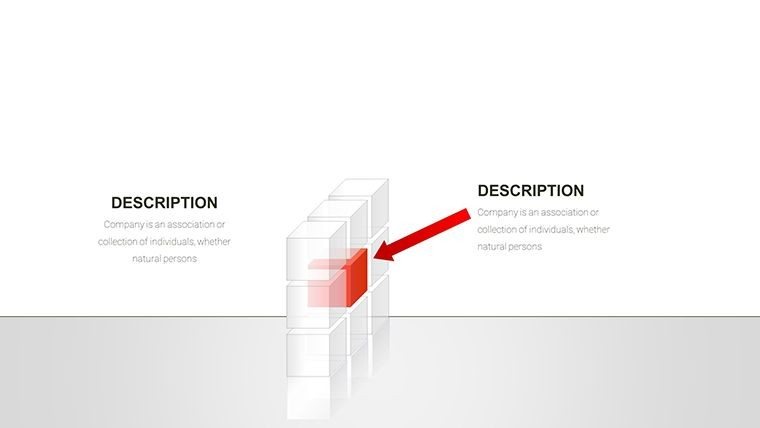
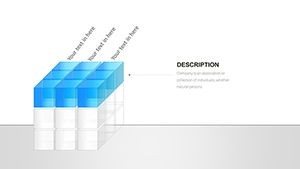
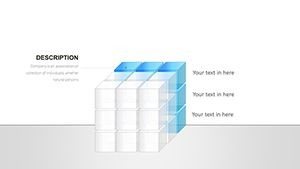
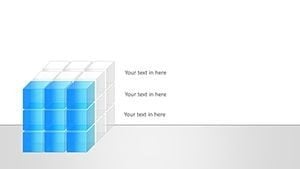
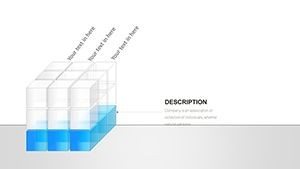
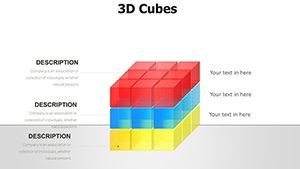
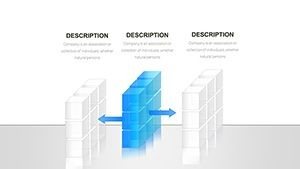
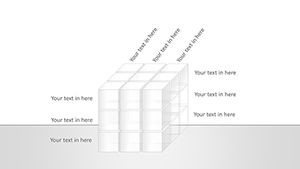
  • Multi-Face Labeling: Add data to all sides, rotating for interactive reveals.
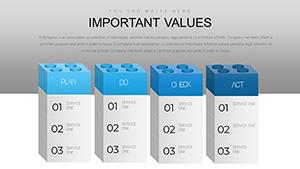
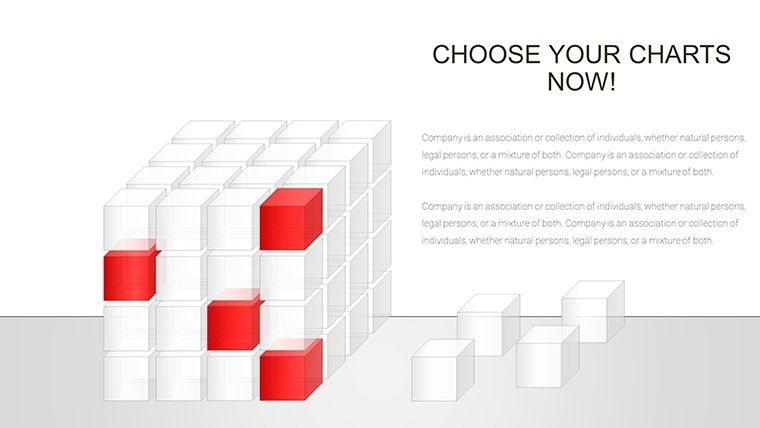
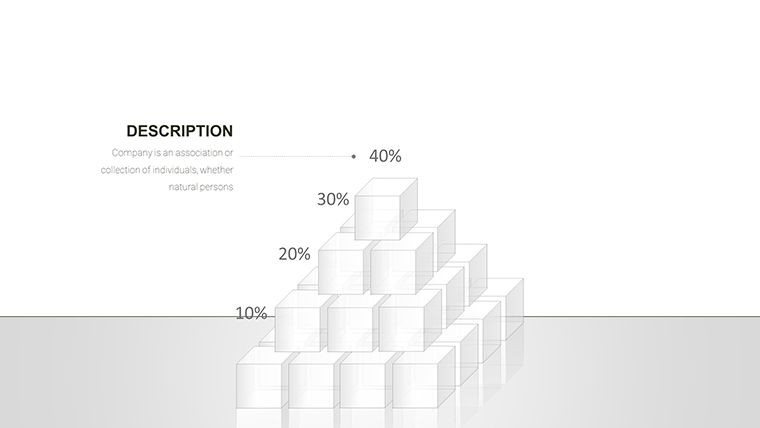
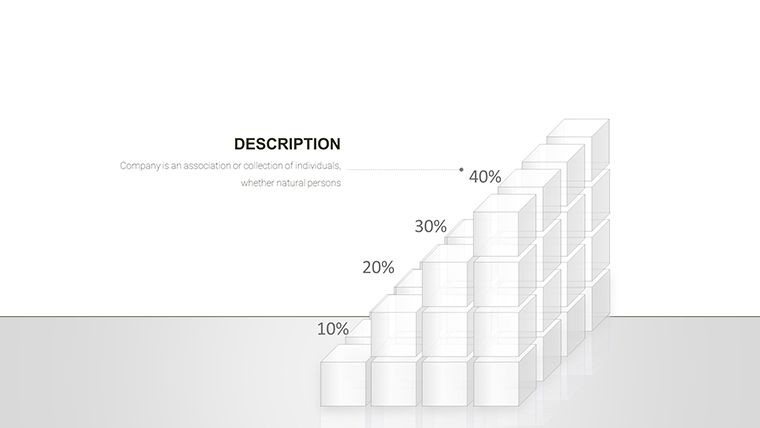
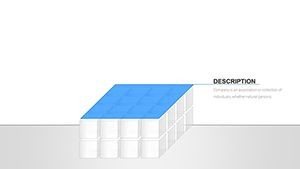
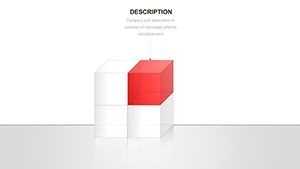
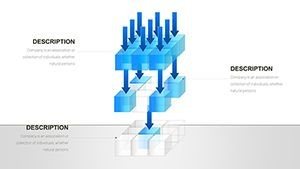
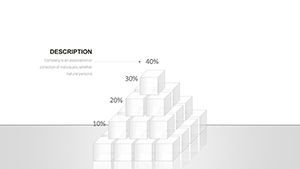
  • Color and Size Scaling: Dynamically size cubes by metrics, with harmonious palettes.
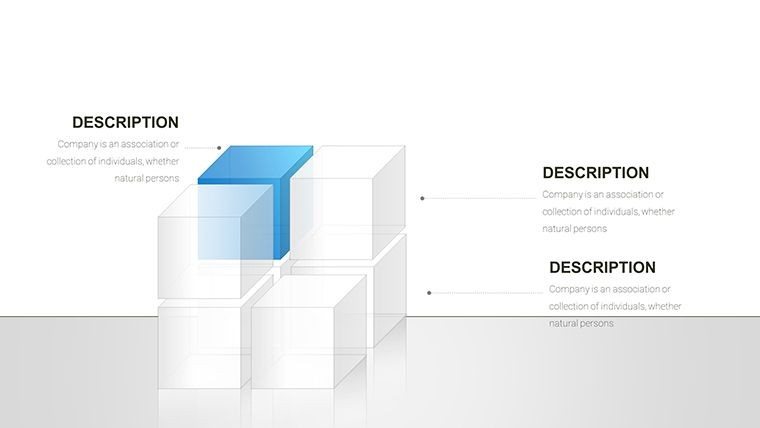
  • Icon Integration: Embed over 100 symbols for enriched visuals.
  • User-Friendly Edits: No coding needed; drag to rearrange stacks.

Such innovations outpace basic charts, fostering 35% better info absorption as per UX research.

Stacking Up Real-World Scenarios

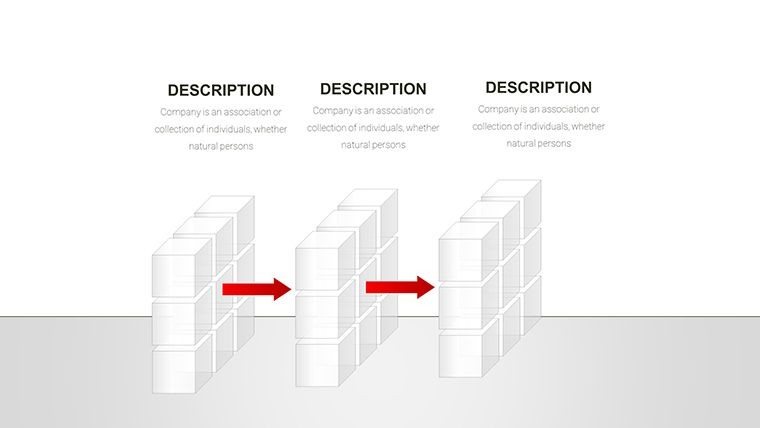
For financial pros, slide #9 cubes layer expense categories, revealing cost structures at a glance - aligned with GAAP visuals. Creatives in design firms use slide #28 to cube portfolio elements, showcasing skills multidimensionally.

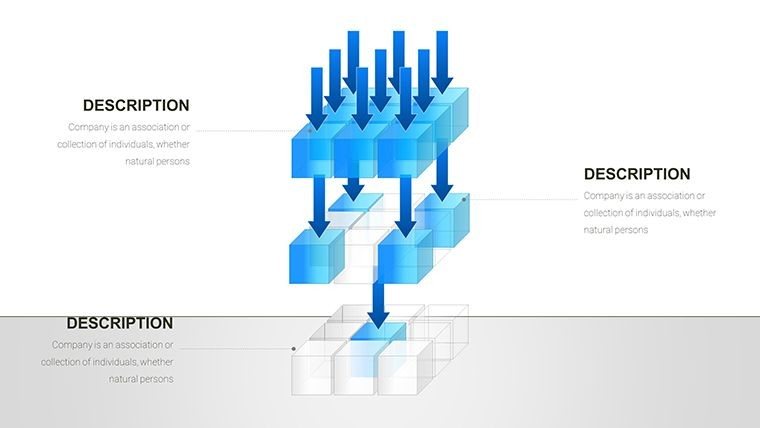
Educators stack historical events on slide #35, creating timelines with depth for engaging history lessons. Versus plain PowerPoint, this adds literal layers, enhancing memorability in pitches.

Building Your Cube Presentation Step by Step

  1. Setup Foundation: Download .potx; open in PowerPoint or Google Slides.
  2. Lay Data Bricks: Input values; cubes auto-scale accordingly.
  3. Construct Aesthetics: Tweak textures and rotations for optimal view.
  4. Fortify with Feedback: Prototype and refine based on tests.
  5. Erect and Execute: Present confidently, exporting as needed.

This blueprint accelerates assembly, cutting design efforts significantly.

The Solid Choice for Dimensional Data

Drawing from marketing expertise, this template's trustworthiness shines in its versatile builds. Ready to stack the odds in your favor? Acquire these cubes and construct compelling cases.

To close, these 42 slides form the building blocks for breakthrough communications. Build your vision now - your audience awaits the reveal.

Frequently Asked Questions

How customizable are the cube textures?

Highly - switch between styles and add custom images to faces.

Does it support animations?

Yes, with stacking sequences and rotations for dynamic effects.

Ideal for team collaborations?

Perfect, via Google Slides for real-time edits.

What about accessibility?

Includes alt text and high-contrast options for inclusivity.

Can cubes handle hierarchical data?

Excellently, with nesting features for org charts.