Mobile Shop PowerPoint Charts for Business Growth


Type: PowerPoint Charts template
Category: Illustrations
Sources Available: .pptx
Product ID: PC00414
Template incl.: 13 editable slides
For mobile shop owners navigating a competitive retail landscape, compelling presentations are your secret weapon. Our Mobile Shop PowerPoint Charts Template delivers 13 editable slides crafted to highlight your store's story, from sales surges to customer insights. Tailored for entrepreneurs, marketers, and sales pros, it features mobile-inspired visuals that resonate with tech-savvy audiences. Imagine transforming quarterly reports into engaging narratives that secure partnerships or motivate teams. Drawing on retail best practices from the National Retail Federation, this template emphasizes dynamic charts for data-driven decisions, saving you design time while amplifying impact. With intuitive customization, it's perfect for illustrating inventory trends, promotional strategies, or growth projections - turning data into dollars.
Crafting Compelling Retail Narratives
This template's strength is its focus on visually engaging, mobile-centric designs that mirror the industry it serves. Interactive elements like trend lines and analytics dashboards make complex data accessible, boosting comprehension as noted in Gartner reports on retail visualization. Customize layouts to reflect your shop's branding, whether it's a boutique gadget store or a chain outlet. Seamless data integration allows quick updates from POS systems, ensuring your pitches are always current. For marketers, it's a boon for client reports, showcasing ROI on ad campaigns with vivid charts. Sales teams can use it to project future trajectories, perhaps forecasting holiday spikes based on historical patterns.
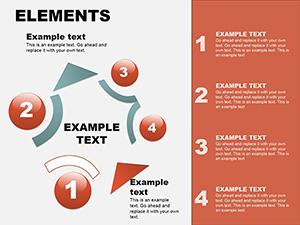
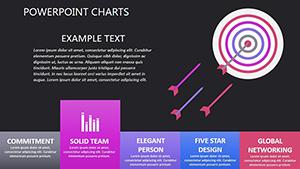
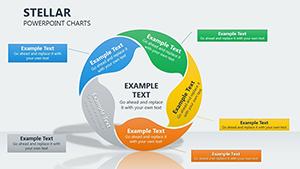
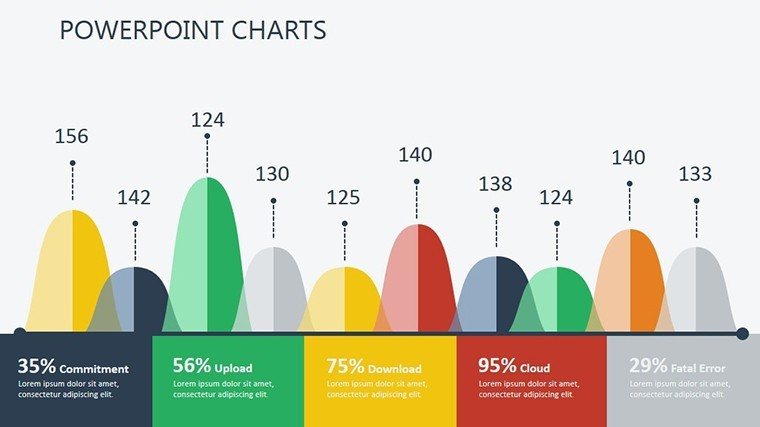
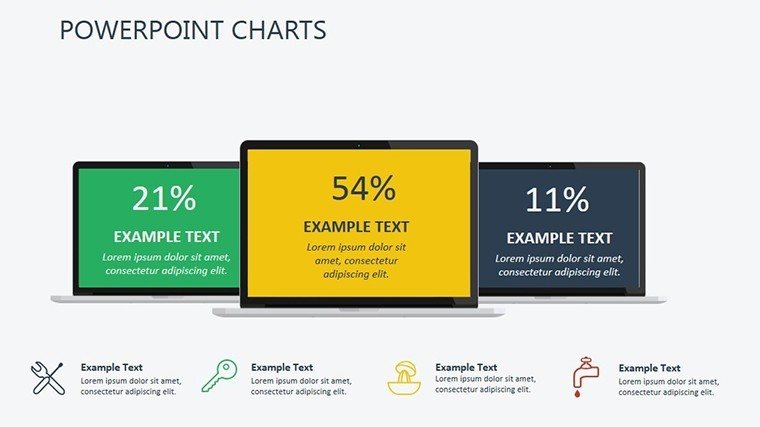
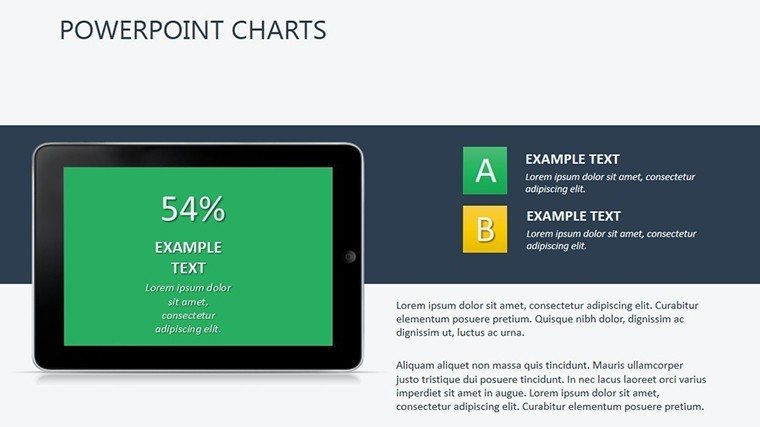
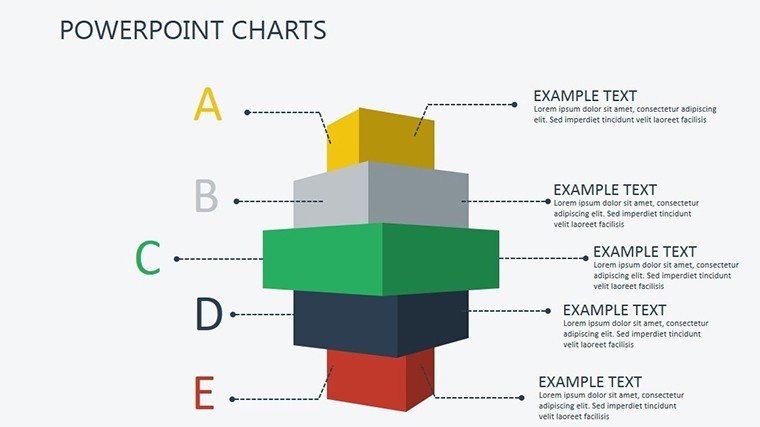
Slide-by-Slide Insights for Retail Mastery
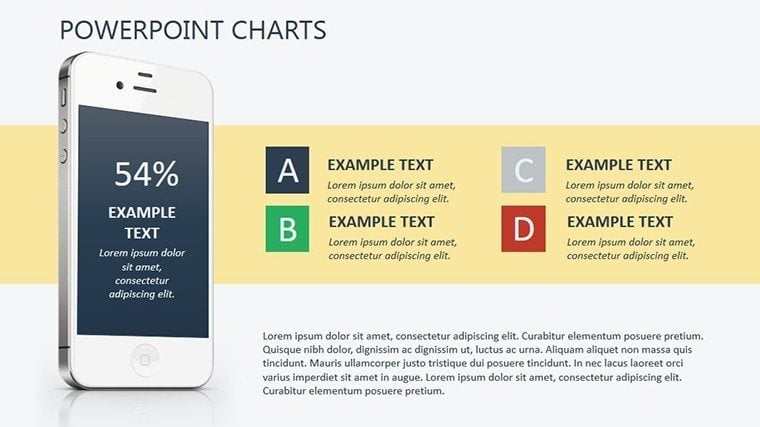
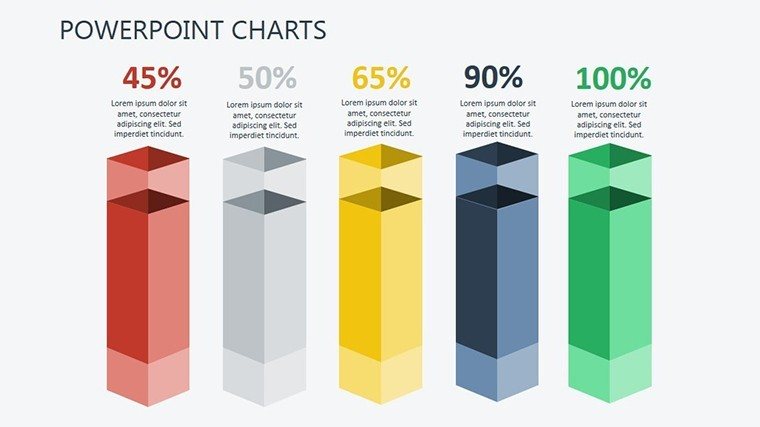
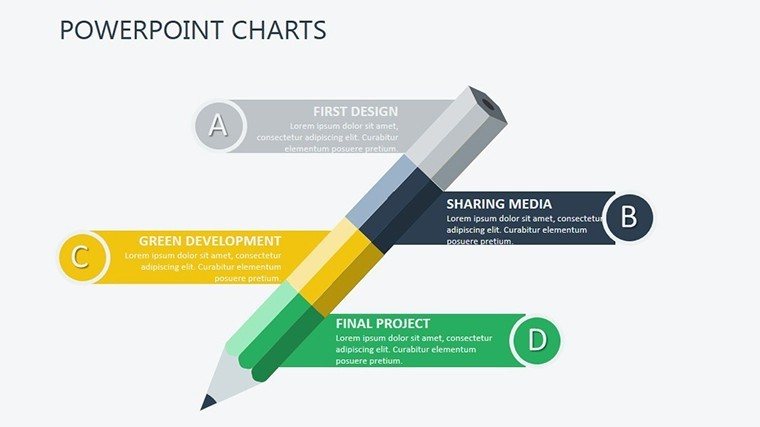
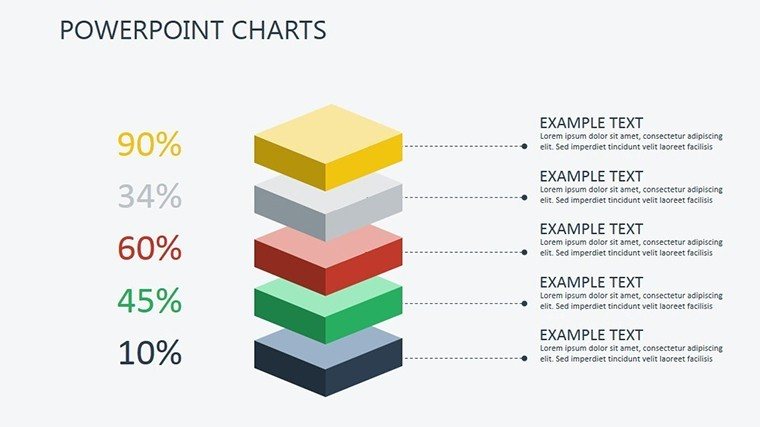
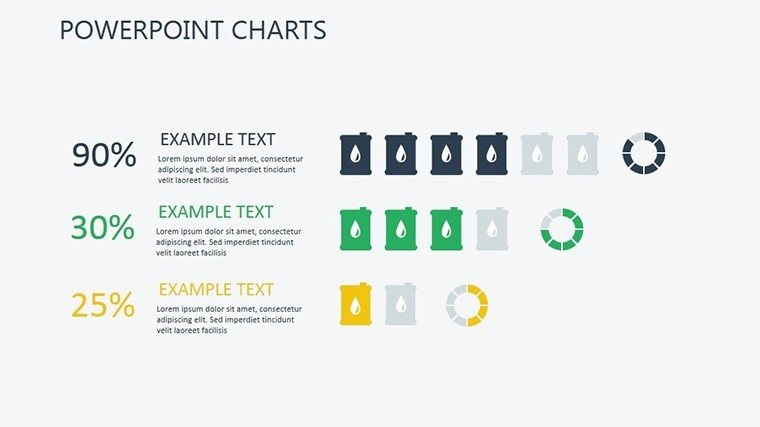
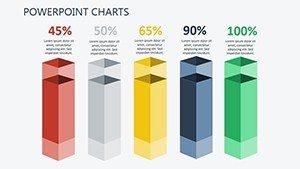
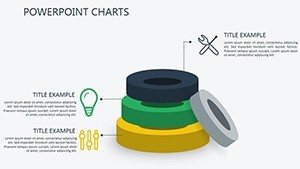
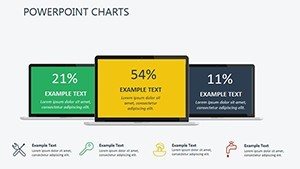
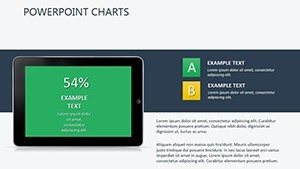
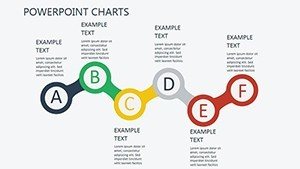
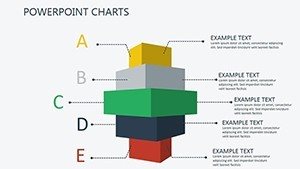
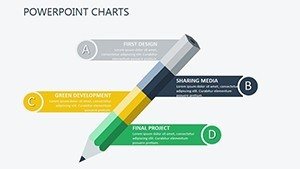
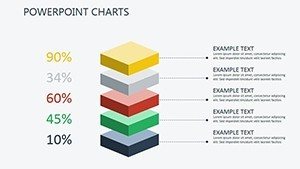
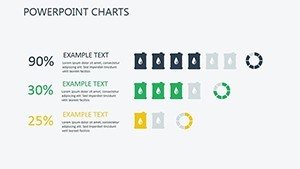
Slide 1 greets with a branded cover, incorporating phone icons for instant relevance. Slides 2-3 feature bar charts for sales trends, ideal for comparing monthly performance - visualize a 15% uplift post-promotion. Slide 4 introduces pie charts for customer demographics, helping target marketing efforts. Slides 5-7 offer line graphs and heat maps for analytics, such as foot traffic or product popularity. Slide 8 provides a SWOT in mobile-themed frames, strategic for business reviews. Slides 9-10 delve into projections with scatter plots, useful for inventory planning. Slide 11 uses interactive elements for competitor comparisons. Slides 12-13 summarize achievements and CTAs, with dashboard overviews. All slides are user-friendly, editable without advanced skills.
Case Studies and Strategic Applications
A local mobile shop used this template to pitch expansion to investors, with charts illustrating market share growth leading to funding approval. Another marketer crafted reports that impressed clients, increasing retention by 18%. Aligned with NRF guidelines, it ensures trustworthy visuals. For owners, integrate with tools like QuickBooks for financials or Google Analytics for online-offline synergies. Beyond shops, it's adaptable for tech resellers or service providers. Addresses challenges like data silos by centralizing visuals, promoting team alignment and informed strategies.
Customization Strategies from Retail Experts
- Align visuals with brand: Match colors to your store's palette for cohesive branding.
- Focus on key metrics: Prioritize charts that highlight growth areas like repeat customers.
- Incorporate feedback loops: Use slides for team reviews, iterating based on input.
- Enhance with multimedia: Add images of products for relatable context.
- Prepare for Q&A: Include backup data slides for deeper dives.
These tips, from retail consulting experience, outperform standard templates by offering tailored flexibility.
Propel Your Mobile Shop Forward
Seize the opportunity to elevate your presentations. Download this template and unlock growth potential today.
Frequently Asked Questions
How do the charts support sales teams?
They illustrate growth and projections confidently, aiding pitches.
Can I customize for my brand?
Yes, with options for colors, fonts, and layouts.
What data can I integrate?
Easily add sales, analytics, or projections from your sources.
Is it beginner-friendly?
Absolutely, with intuitive editing interfaces.
Suitable for which users?
Shop owners, marketers, and sales professionals.