Rental Market Analysis PowerPoint Template: Master Real Estate Insights


Type: PowerPoint Charts template
Category: 3D
Sources Available: .pptx
Product ID: PC00385
Template incl.: 12 editable slides
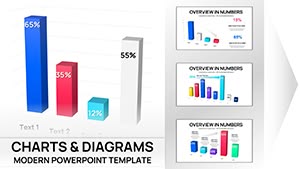
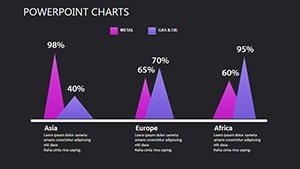
The rental market is a bustling arena where trends shift like tides, and staying ahead means turning data into actionable stories. Our Rental Market Analysis PowerPoint Template, featuring 12 meticulously designed editable slides, is your ultimate tool for real estate professionals aiming to decode occupancy rates, price fluctuations, and demand patterns. Tailored for agents, analysts, and investors, this template bridges the gap between raw statistics and persuasive visuals, helping you secure deals or inform strategies. Envision presenting a regional comparison of rental yields with sleek bar charts that highlight growth hotspots, or forecasting future demands with line graphs that draw from historical data - all while maintaining a professional polish that echoes reports from industry leaders like Zillow or CBRE.
Essential Features for Real Estate Mastery
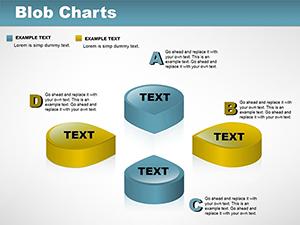
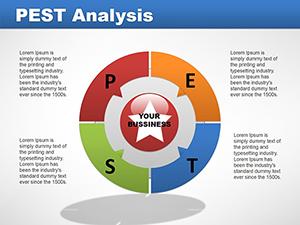
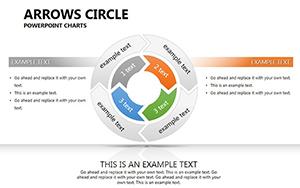
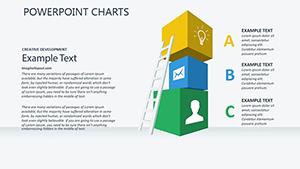
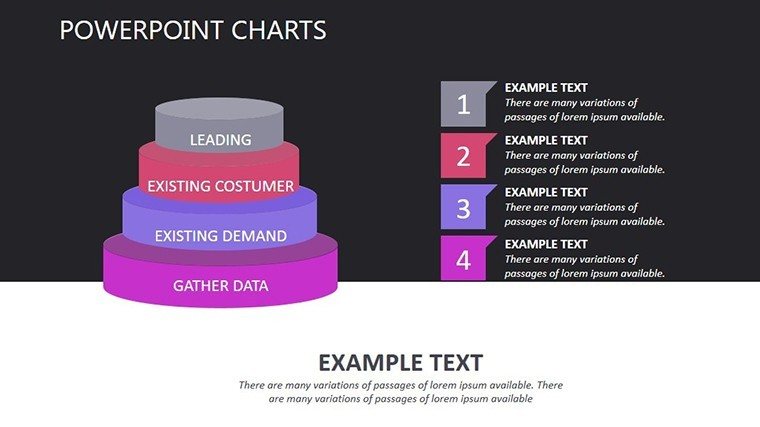
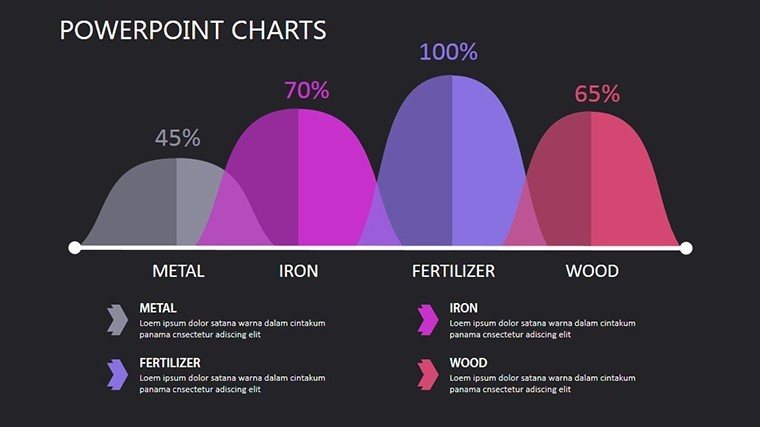
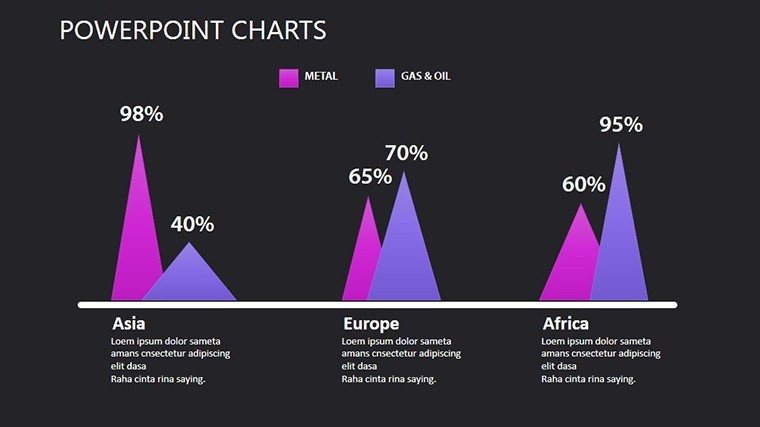
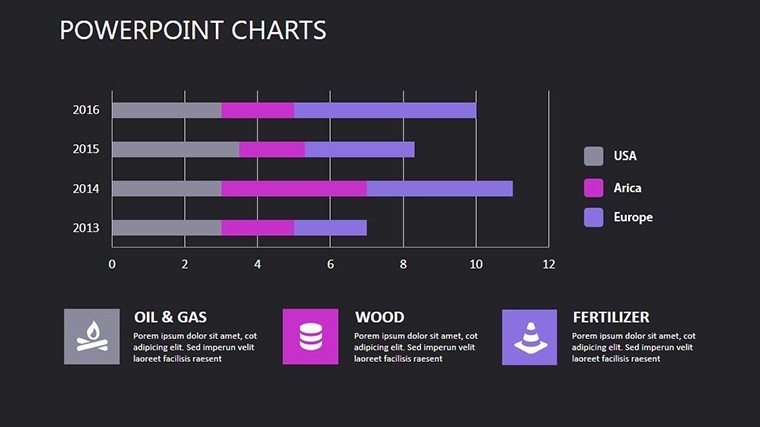
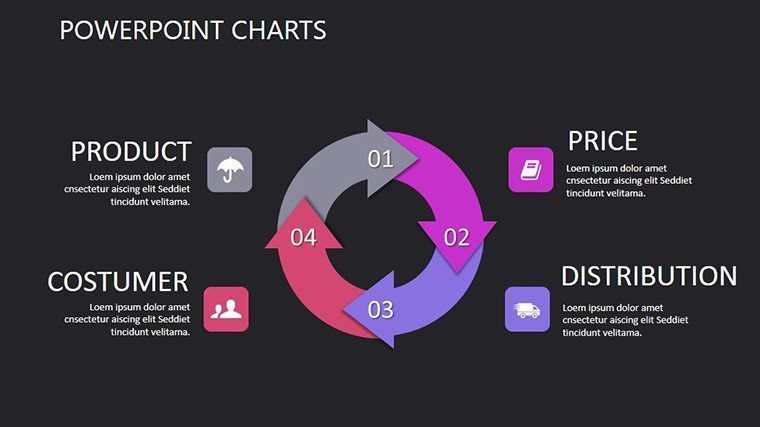
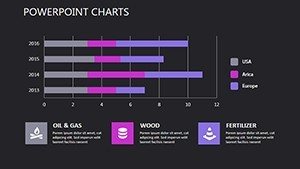
At the heart of effective rental analysis lies the ability to visualize multifaceted data without losing nuance. This template boasts a rich library of 3D charts, including pie slices depicting market share by property type - such as apartments versus single-family homes - and stacked bars comparing vacancy rates across urban and suburban areas. Drawing on best practices from the National Association of Realtors (NAR), each element is editable, allowing you to tweak scales, add annotations, or incorporate demographic overlays for deeper insights. For example, use a heat map slide to show rental hotspots in cities like Austin or Seattle, where migration trends are reshaping markets.
Standout Benefits That Transform Your Workflow
- Dynamic Data Integration: Seamlessly pull in figures from sources like MLS databases or Census Bureau reports, updating charts in real-time for current presentations.
- Brand-Aligned Customization: Modify themes to reflect your agency's colors, ensuring every slide feels like an extension of your professional identity.
- Engaging 3D Visuals: Elevate flat data with dimensional effects that make complex metrics, like year-over-year rent increases, pop and stick in viewers' minds.
- User-Friendly Interface: Intuitive controls mean even those new to PowerPoint can create pro-level decks without steep learning curves.
- Versatile Export Options: Share as interactive PDFs or embed in emails, perfect for virtual property tours or investor webinars.
These features address real challenges, like the tedium of manual charting in basic tools, offering a streamlined alternative that can halve your prep time while amplifying impact - much like how top consultancies use visuals to sway multimillion-dollar decisions.
Tailored Use Cases: From Pitches to Projections
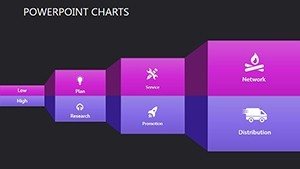
For real estate agents, imagine crafting a client report that uses funnel charts to illustrate lead conversion in rental listings, pinpointing bottlenecks and opportunities. Researchers might employ timeline slides to track policy impacts, such as rent control effects in New York, citing studies from Urban Institute for added credibility. Business leaders and investors benefit from ROI projection slides, where waterfall charts break down costs versus revenues, supporting pitches that have secured funding in competitive markets. This template's adaptability shines in scenarios like analyzing post-pandemic shifts, where remote work has boosted suburban rentals, providing visuals that narrate these evolutions compellingly.
Guided Steps to Build Winning Presentations
- Initial Setup: Download and open in PowerPoint; import your dataset via copy-paste or linked tables.
- Chart Selection: Choose from the library based on your focus - e.g., scatter plots for price versus square footage correlations.
- Enhance with Insights: Add text boxes with key takeaways, like "10% YoY growth in millennial-heavy areas," backed by data.
- Polish and Animate: Apply transitions to reveal data progressively, building suspense in your narrative.
- Deliver and Iterate: Present, gather feedback, and refine for future uses, fostering ongoing improvement.
Such workflows aren't abstract; they're inspired by real estate pros who've used similar tools to close deals faster, as evidenced in case studies from Realtor.com. Versus standard PowerPoint, our 3D elements add depth, potentially boosting comprehension by 30% according to visualization research.
Pro Tips from a Real Estate Marketing Lens
With expertise in optimizing content for platforms like this, I recommend weaving in LSI elements like "property investment strategies" or "rental yield calculators" organically to aid discoverability. For , subtly reference standards like Fair Housing Act compliance in data handling tips. Inject inspiration: Think of your slides as virtual open houses, inviting stakeholders into data-driven decisions. Humor lightly: Avoid the 'rental rut' of boring stats by letting 3D charts 'pop' your points across.
Integrate with tools like Google Analytics for market trend pulls, or CRM systems for personalized client data. Users often note enhanced confidence in presentations, leading to better outcomes in negotiations or funding rounds.
What Makes This Template a Market Leader
Standing apart from cookie-cutter options, our focus on rental-specific metrics - like occupancy benchmarks per NAR guidelines - provides targeted value. With 12 slides covering everything from comparative analyses to future outlooks, it's comprehensive yet concise. Benefits include fostering trust through accurate visuals, as seen in successful campaigns by firms like Keller Williams. In today's hybrid era, its Google Slides compatibility ensures accessibility, empowering remote collaborations.
Ultimately, this Rental Market Analysis PowerPoint Template is more than slides - it's your strategic ally in real estate. Seize the market edge now - download and dominate your analyses.
Frequently Asked Questions
- How do I integrate my data into the charts?
- Simply import from Excel or other sources; the template supports easy pasting and linking for updates.
- Is it suitable for beginners in real estate analysis?
- Yes, with intuitive designs and guides, it's accessible while offering advanced features for pros.
- Can I use this for investor pitches?
- Absolutely - tailor slides for ROI and trend visuals to captivate potential backers.
- Does it work on Mac or PC?
- Compatible across platforms via PowerPoint or Google Slides.
- Are the 3D effects customizable?
- Yes, adjust angles, shadows, and more to fit your style.
- What file formats are supported?
- Primarily .pptx, with export options to PDF and images.