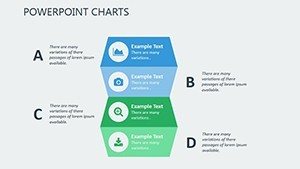
Strategic Tactical Planning PowerPoint Charts Template


Type: PowerPoint Charts template
Category: Timelines, Illustrations
Sources Available: .pptx
Product ID: PC00374
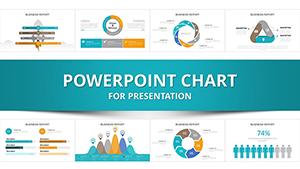
Template incl.: 17 editable slides
In today's fast-paced business environment, tactical planning isn't just about setting goals - it's about executing them with precision and flair. Our Tactical Planning PowerPoint Charts Template empowers you to do exactly that, offering 17 editable slides packed with versatile charts that bring your strategies to life. Tailored for executives mapping out quarterly objectives, entrepreneurs pitching to investors, and teams aligning on project milestones, this template turns abstract ideas into tangible visuals. Picture clarifying complex KPIs with sleek dashboards or illustrating trend analyses that guide decision-making. Beyond mere aesthetics, these charts draw from proven frameworks like SWOT and PESTLE, ensuring your presentations resonate with stakeholders. Save time on design and focus on insights, as the user-friendly interface allows quick customizations. Whether in boardrooms or virtual meetings, this tool enhances clarity, fosters collaboration, and drives results, making it indispensable for forward-thinking professionals.
Core Features Driving Tactical Success
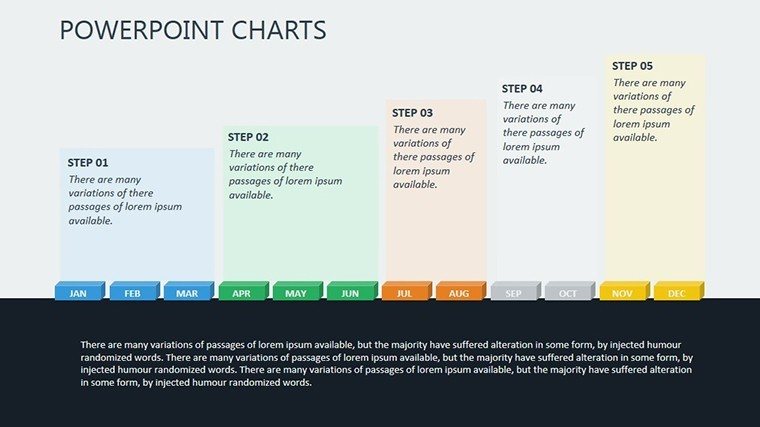
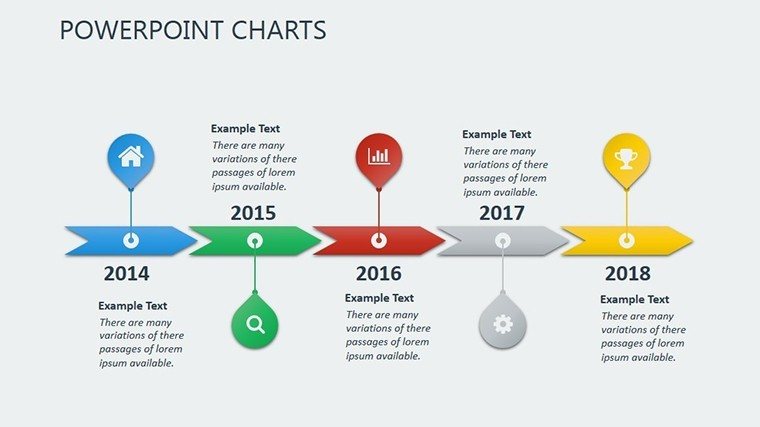
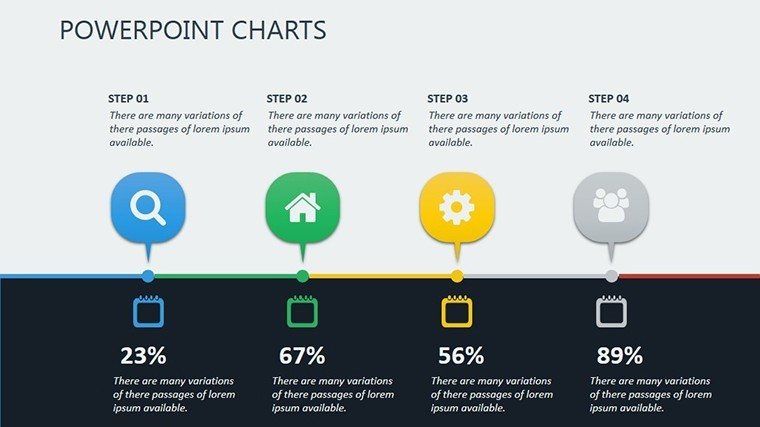
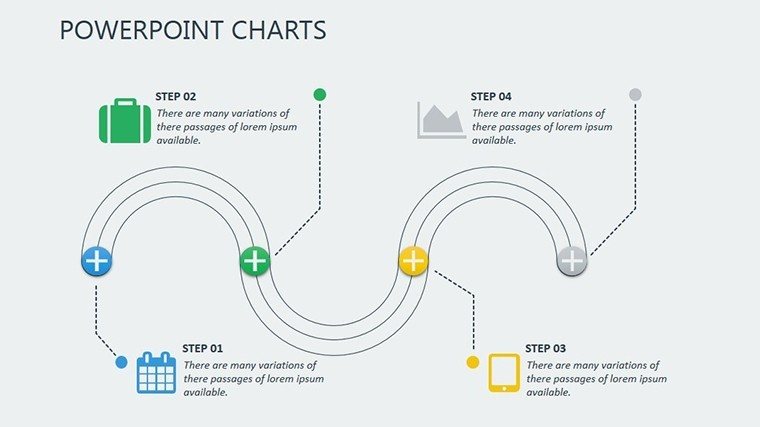
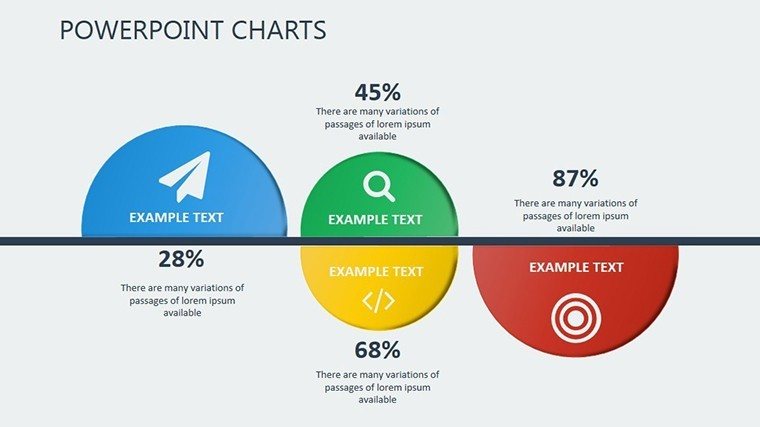
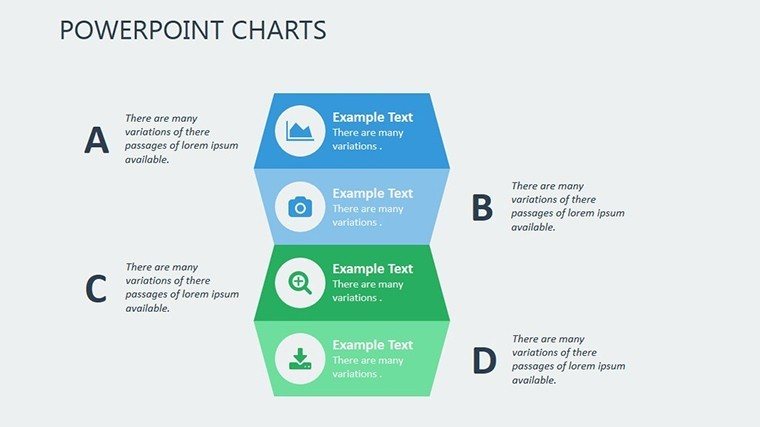
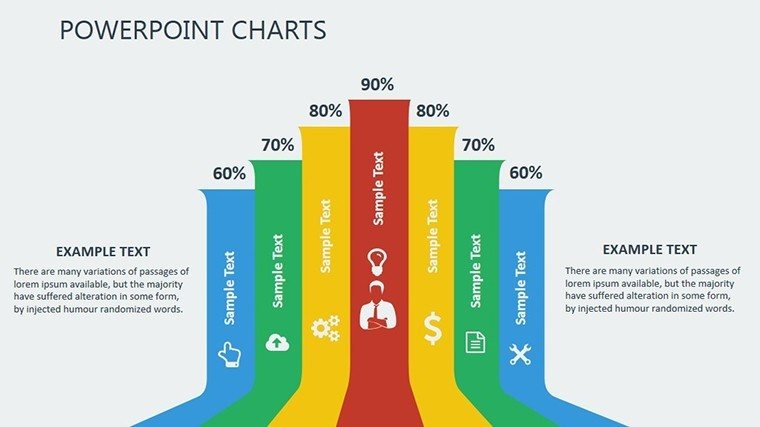
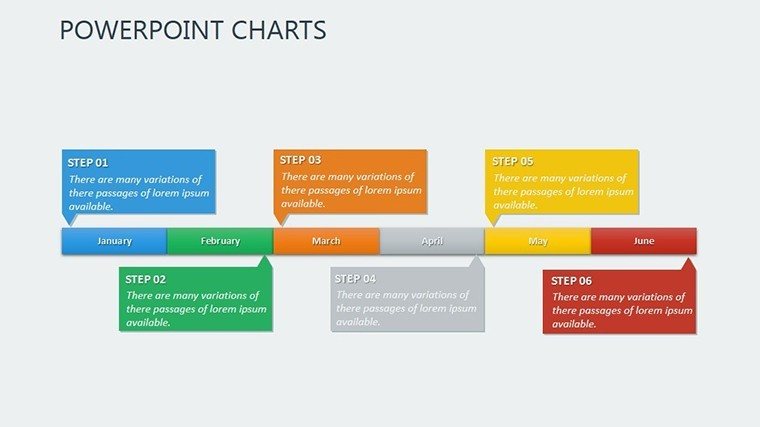
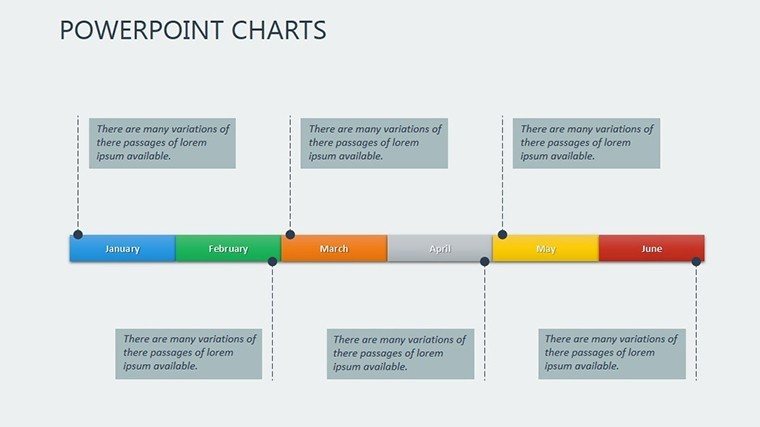
At the core of effective tactical planning lies the ability to visualize data intuitively. This template excels with a suite of charts ranging from timelines to flow diagrams, each designed to spotlight critical elements like resource allocation and performance metrics. Backed by insights from management gurus like Peter Drucker, who emphasized measurable outcomes, these visuals help you track progress against benchmarks. For example, a project manager might use the Gantt-style charts to coordinate cross-functional teams, reducing delays by highlighting dependencies early.
Endless Customization for Brand Synergy
Adaptability defines this template. Modify chart styles, color schemes to match your corporate identity - perhaps incorporating Pantone colors for a tech firm's innovative vibe. Fonts and layouts shift effortlessly, supporting everything from minimalist designs for C-suite updates to detailed infographics for training sessions. This flexibility ensures seamless integration with existing decks, promoting consistency across your organization's communications.
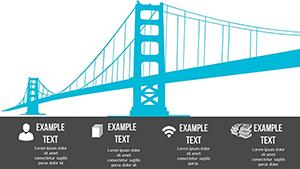
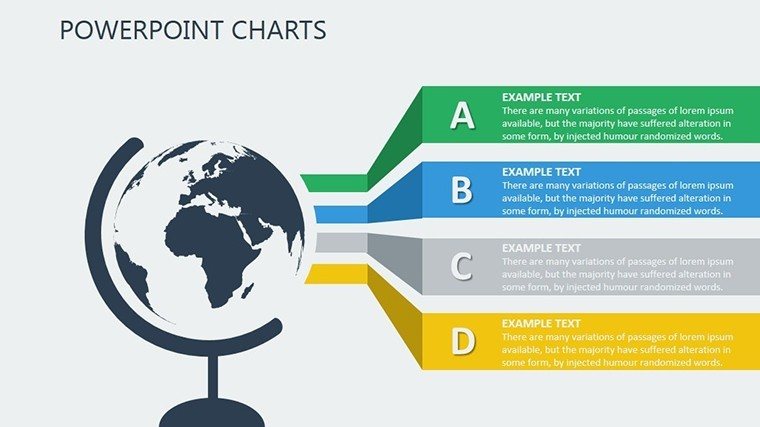
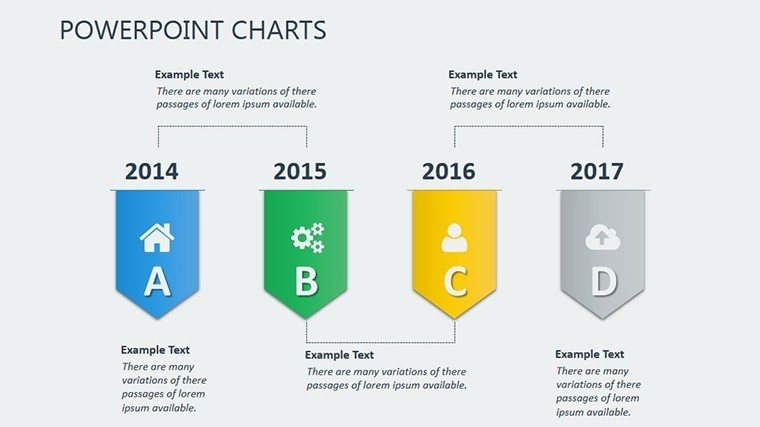
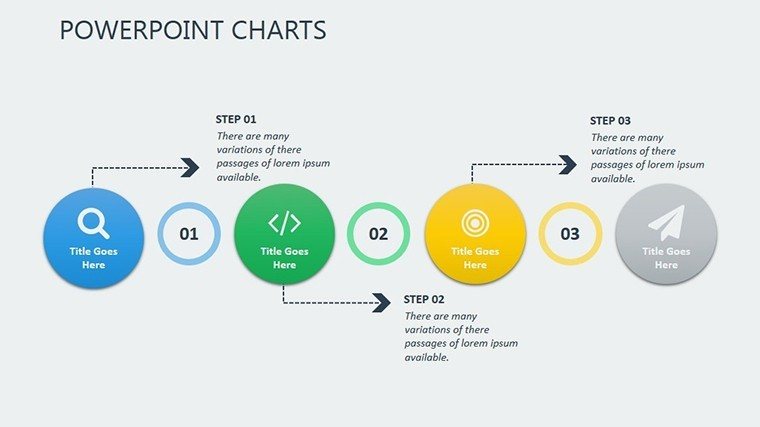
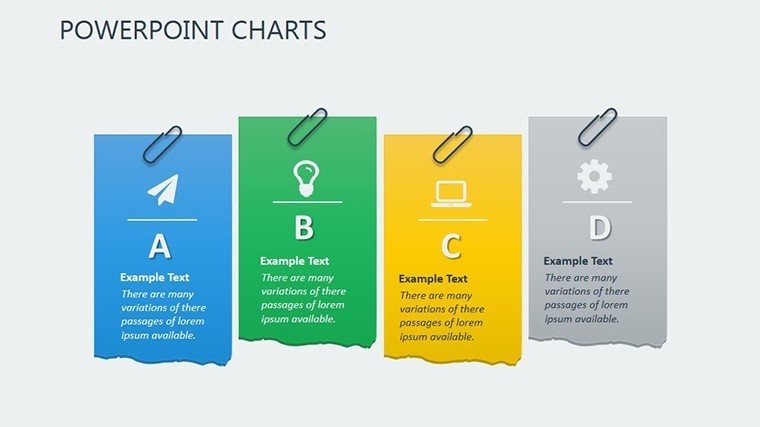
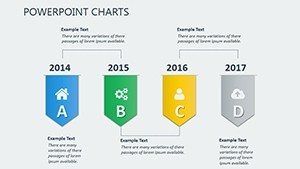
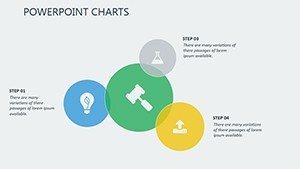
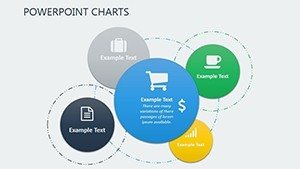
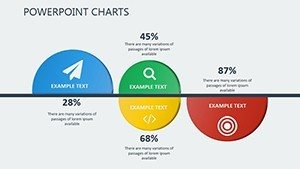
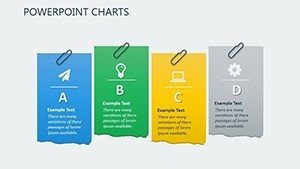
- Chart Variety: Includes bar, line, pie, and custom tactical maps for diverse data needs.
- Color and Font Flexibility: Align with brand guidelines or adapt for audience preferences.
- Layout Options: Scalable designs for both detailed deep dives and high-level overviews.
Ideal Users and Scenarios
From seasoned leaders in Fortune 500 companies to startup founders bootstrapping their visions, this template caters to a broad spectrum. In stakeholder meetings, use it to present risk assessments with probability-impact matrices, drawing from case studies like those in McKinsey Quarterly. Entrepreneurs can leverage the slides for investor decks, showcasing growth trajectories that secured funding in real pitches, as seen in Shark Tank successes. It's also perfect for internal team huddles, where agile methodologies demand quick tactical adjustments.
In-Depth Use Cases with Practical Examples
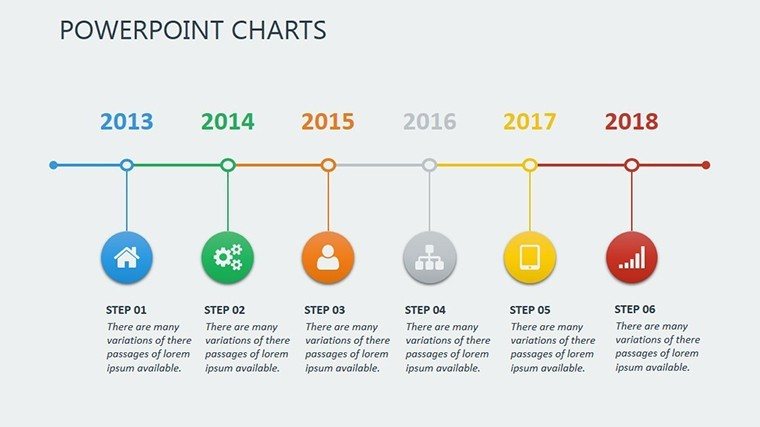
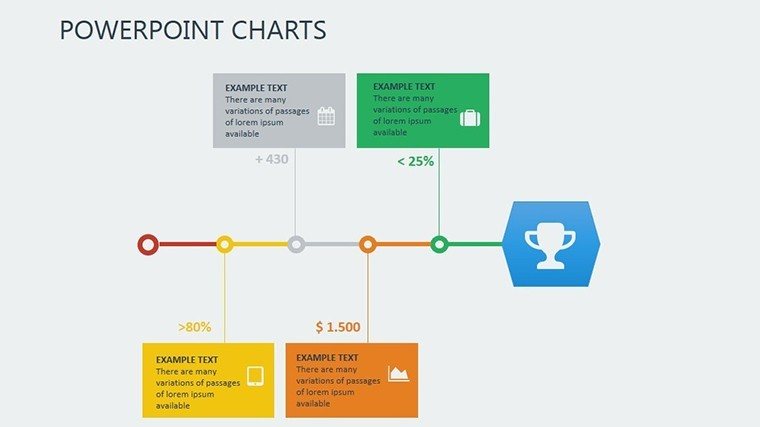
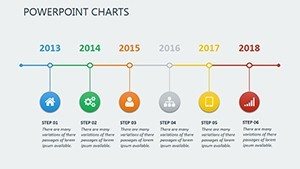
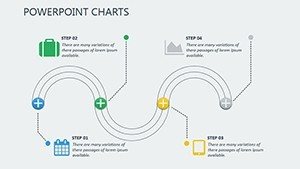
Envision a marketing director using these charts to outline a campaign rollout: Timeline slides map phases, while KPI trackers monitor ROI in real-time. A case from a digital agency shows how such visuals cut planning time by 35%, allowing faster iterations. In non-profits, program coordinators employ them for grant proposals, illustrating impact metrics that align with donor expectations from organizations like the Gates Foundation.
- Define your tactical objectives and key metrics.
- Select and customize relevant charts from the template.
- Incorporate data from sources like Excel or CRM tools.
- Rehearse for fluid delivery and Q&A readiness.
Superior to Standard Tools
Basic PowerPoint charts often fall flat with limited options and clunky edits. This template surpasses them with pre-built, professional-grade visuals that integrate advanced features like data-linked updates. Compatible with PowerPoint versions and exportable to PDF for handouts, it ensures versatility. Users appreciate the time savings - up to 60% per presentation - freeing energy for strategic thinking rather than formatting woes.
Pro Tips from Industry Experts
Drawing from my background in marketing analysis, I advise layering charts with narratives: Start with a high-level overview, then drill down for depth, much like in Bain & Company reports. Enhance accessibility with color-blind friendly palettes, per ADA standards, and add hyperlinks for interactive elements in digital shares. For virtual presentations, test animations in Teams to maintain pacing.
Infuse inspiration by tying charts to success stories - perhaps how a similar tactical plan propelled a brand like Nike to market dominance through precise execution.
Launch Your Tactical Mastery
Don't let outdated slides hinder your strategic edge. Grab this template and chart a course to tactical excellence. Your next breakthrough presentation starts here.
Frequently Asked Questions
What types of charts are included in this tactical planning template?
The template features 17 slides with timelines, flowcharts, KPI dashboards, and more, all editable for your specific planning needs.
Can I integrate this with other software?
Yes, it works seamlessly with Excel for data import and can be used in Google Slides with minor tweaks for cloud collaboration.
Is it suitable for beginners in PowerPoint?
Absolutely, the user-friendly design makes it accessible, with intuitive edits that don't require advanced skills.
How does this differ from free templates?
Unlike free options, it offers professional polish, extensive customization, and strategic focus backed by business best practices.
Are updates available for this template?
We provide free updates for compatibility with new PowerPoint versions; check our site for the latest.