Social Networks Types PowerPoint Charts: Amplify Your Architectural Reach


Type: PowerPoint Charts template
Category: Analysis
Sources Available: .pptx
Product ID: PC00355
Template incl.: 25 editable slides
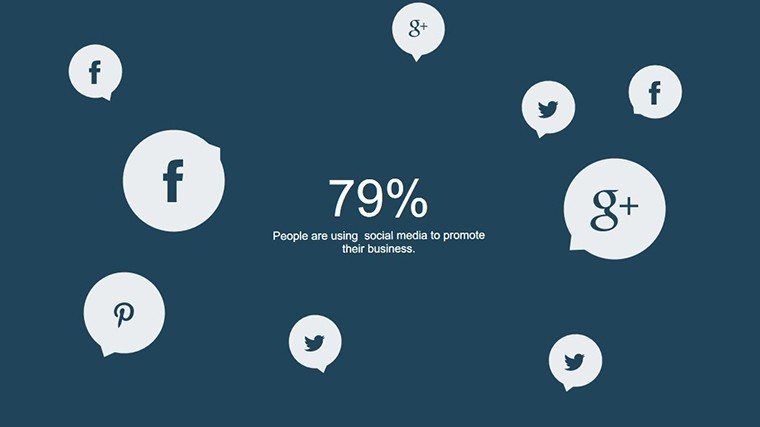
In an era where digital footprints shape skylines as much as steel beams, architects must master the art of social storytelling to showcase their visions. Enter our Social Networks Types PowerPoint Charts template: a robust 25-slide powerhouse that demystifies platforms from Instagram's visual feeds to LinkedIn's professional networks, all through intuitive, editable charts tailored for design pros. Whether you're a firm promoting parametric wonders or an independent creator sharing site renders, this template turns scattered social data into a cohesive strategy deck that drives client leads and industry buzz.
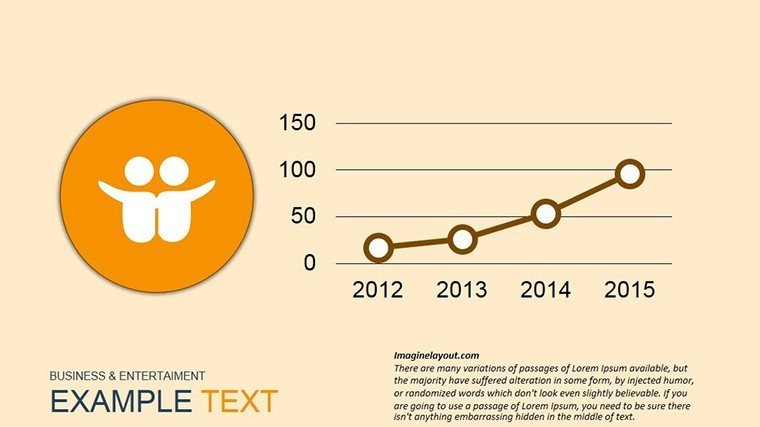
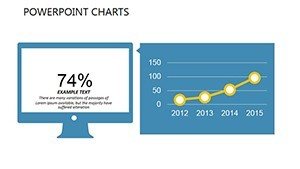
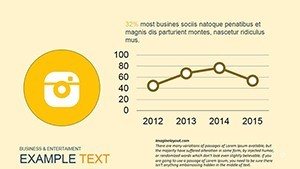
Think of it as your digital drafting table - where pie charts dissect audience demographics like section views, and line graphs trace engagement spikes akin to load-bearing curves. Compatible with PowerPoint and Google Slides, it adheres to best practices from digital marketing bodies like the Digital Marketing Institute, ensuring your presentations aren't just informative but instrumental in building online communities around sustainable builds or heritage restorations.
For architects like those at BIG (Bjarke Ingels Group), who leverage social media to crowdsource ideas for massive projects, this tool is indispensable. It helps quantify reach - mapping follower growth against campaign milestones - while inspiring tactics that blend virality with authenticity. No more fumbling with clunky analytics exports; instead, craft slides that reveal how a Twitter thread on adaptive facades can spark collaborations, all with a few clicks.
Decoding Connections: Standout Features for Social Savvy Architects
This template isn't a one-size-fits-all; it's a precision instrument with features honed for the intersection of design and digital. Explore the 25 slides, each a portal to deeper insights, and see how they fortify your social strategy.
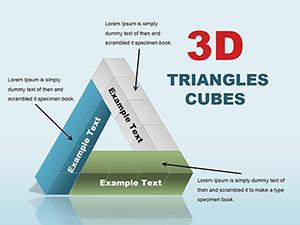
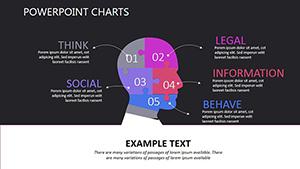
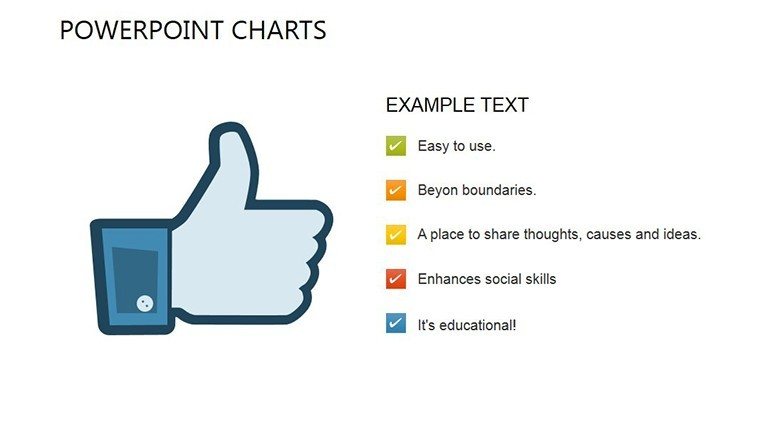
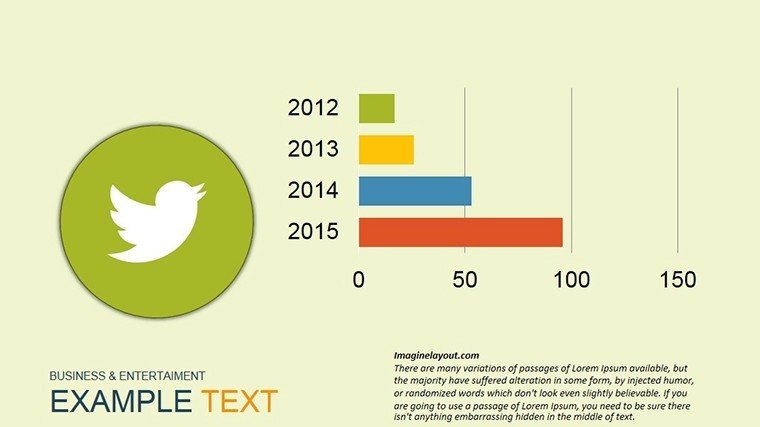
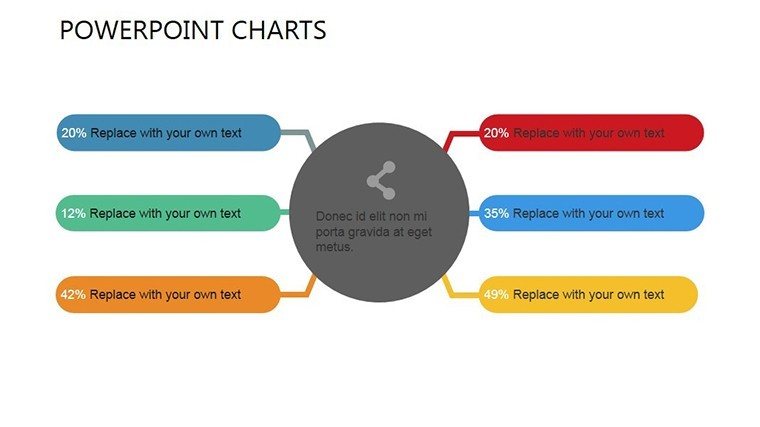
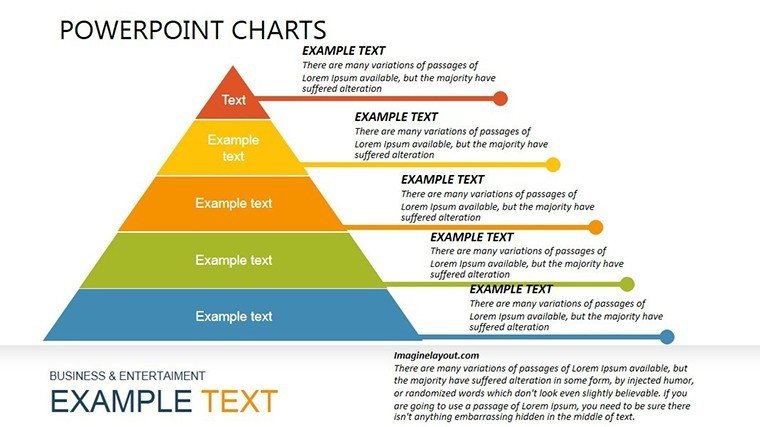
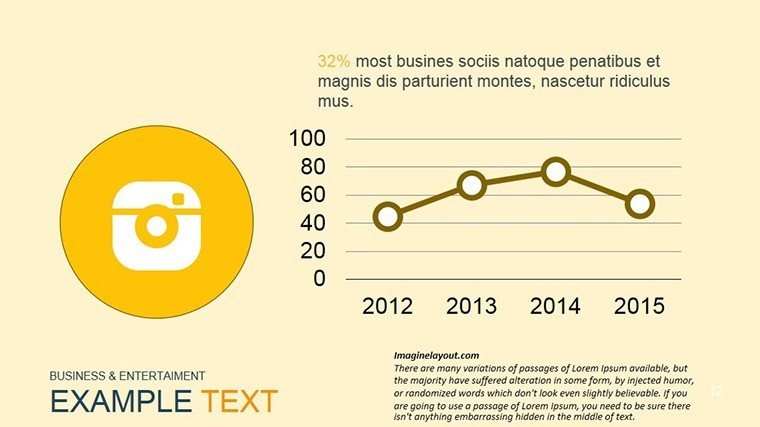
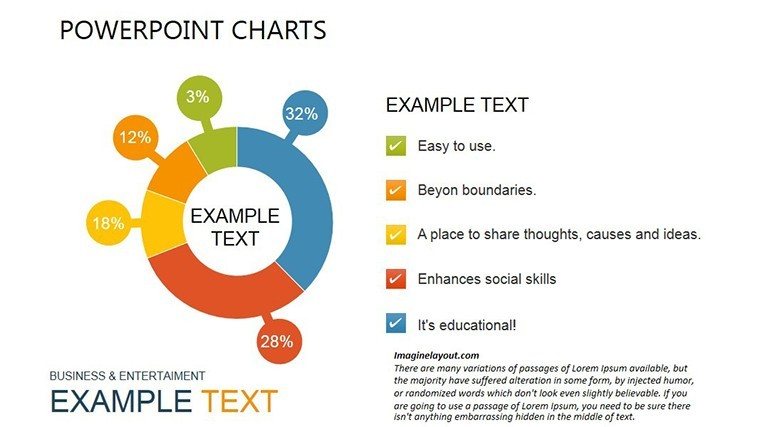
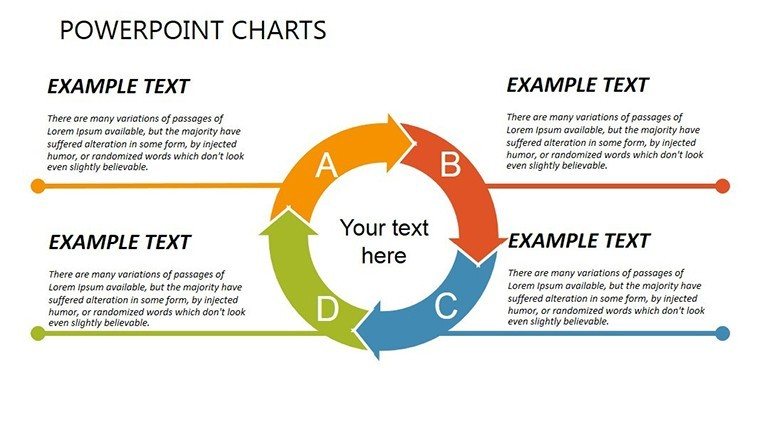
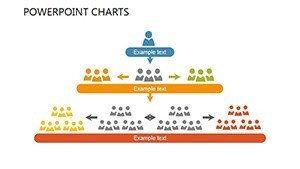
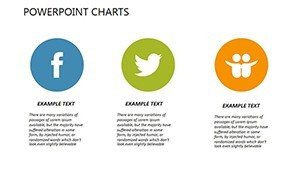
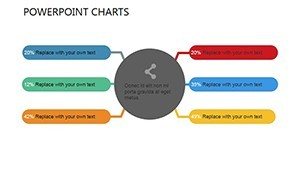
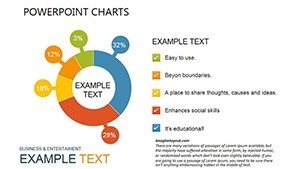
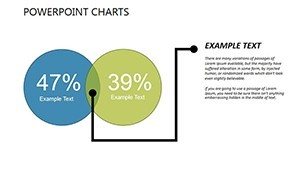
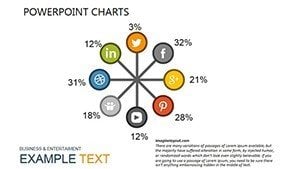
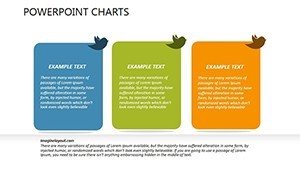
- Diverse Chart Varieties: From donut visuals breaking down platform demographics (e.g., Gen Z on TikTok for youth housing trends) to bubble charts sizing network influences, every graph is primed for your metrics - editable axes, legends, and tooltips included.
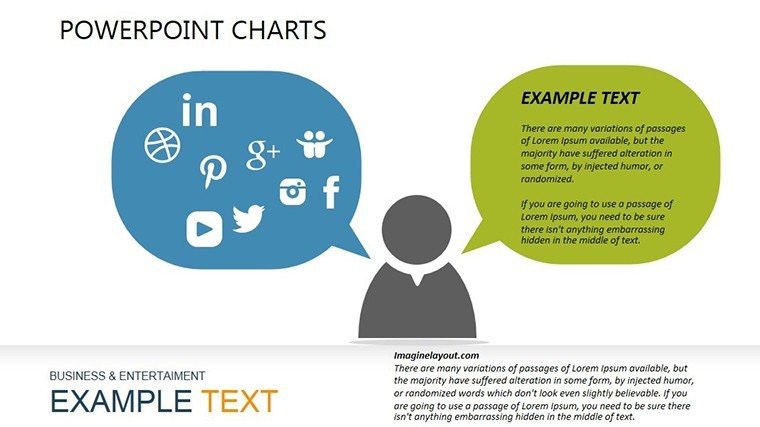
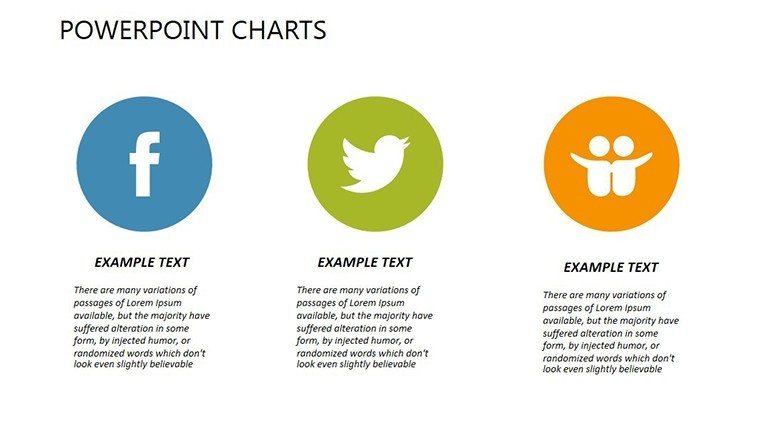
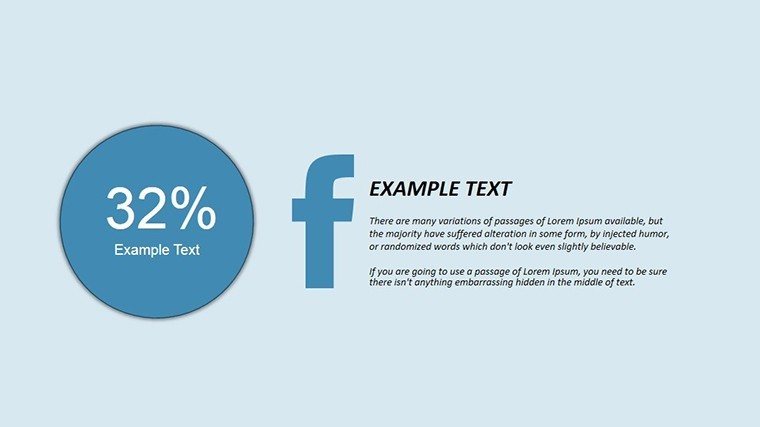
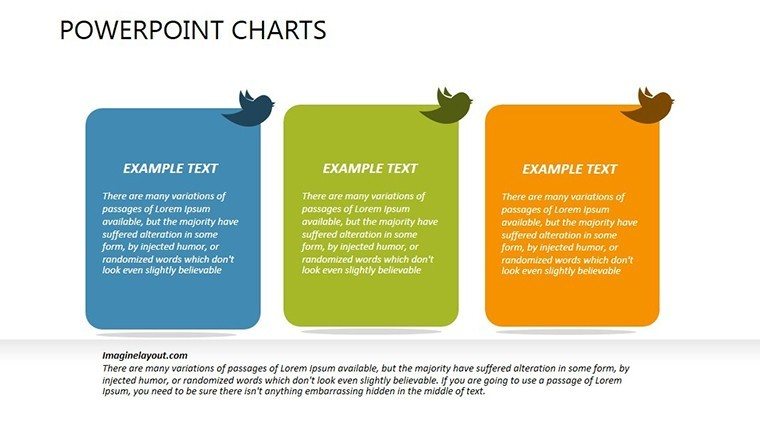
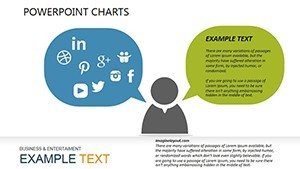
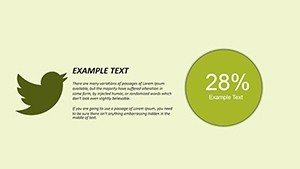
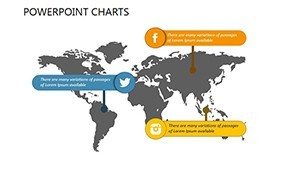
- Platform-Specific Icons and Themes: Built-in symbols for major networks - camera icons for Instagram reels on material innovations, briefcase motifs for LinkedIn posts on firm hires - ensure thematic relevance, with color schemes adaptable to your portfolio's palette.
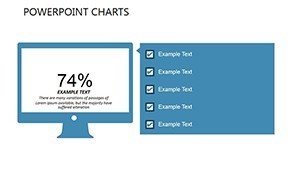
- Interactive Elements for Deeper Dives: Hyperlinked slides connect to embedded data sources, allowing seamless navigation during live demos, much like walking through a virtual model.
High-fidelity graphics maintain sharpness across devices, from laptop reviews to conference projectors, while vector scalability lets you zoom into details like hashtag performance without distortion.
Effortless Customization for Brand Alignment
Infuse your firm's voice by swapping fonts to match spec sheets or gradients to echo project moods - vibrant for pop-up pavilions, subdued for institutional designs. Integrate with tools like Hootsuite exports for automated data pulls, turning raw numbers into narrative gold.
Strategic Showcases: Applying the Template in Architectural Marketing
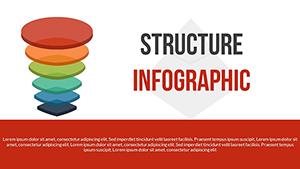
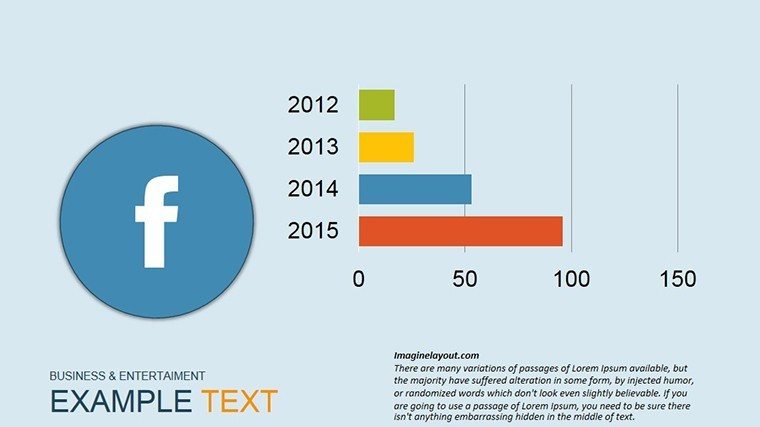
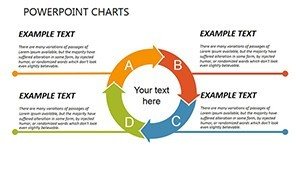
Envision a mid-sized firm in New York, tasked with rebranding via social channels. They deployed this template to chart a six-month campaign: radial diagrams illustrated content pillars (e.g., behind-the-scenes BIM walkthroughs), while stacked bars compared engagement across platforms for facade lighting posts. Outcome? A 40% follower surge, leading to three high-profile commissions - proof that visualized social intel can construct real-world opportunities.
For hands-on guidance, follow this workflow:
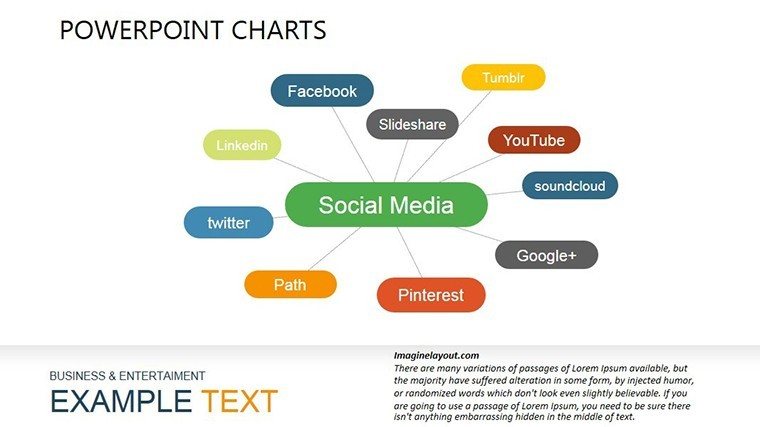
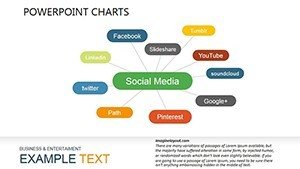
- Map Your Ecosystem: Select slides like the network comparison matrix to audit current presence - e.g., Pinterest for mood boards vs. YouTube for drone tours.
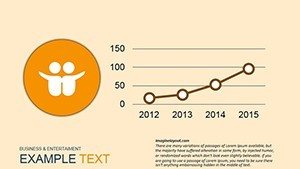
- Layer in Analytics: Input metrics from Google Analytics, customizing scales to highlight spikes from viral renders of green roofs.
- Build Engagement Narratives: Use flowcharts to sequence posting cadences, animating paths to show ripple effects on lead gen.
- Test and Iterate: Share drafts with your marketing lead, refining based on feedback - like emphasizing Instagram for visual storytelling in residential bids.
- Launch and Track: Present to stakeholders, then loop back with updated data for quarterly reviews.
Educators in architecture programs at schools like RISD use it to teach digital ethnography, dissecting how networks influence public perception of urban interventions.
Superior to DIY Social Dashboards
Why wrestle with native PowerPoint inserts that glitch on imports when this template offers pre-vetted layouts? It cuts prep time by half, per marketing efficiency reports from HubSpot, freeing you for creative pursuits like conceptual sketches. Unlike fragmented tools, it unifies insights into a single, exportable asset - PDFs for investor packets or MP4s for social shares.
Elevate from observer to orchestrator in the digital realm. Grab your Social Networks Types PowerPoint Charts template now and architect connections that last. Check out our analysis templates for more.
Expert Tips: Social Mastery for Design Pros
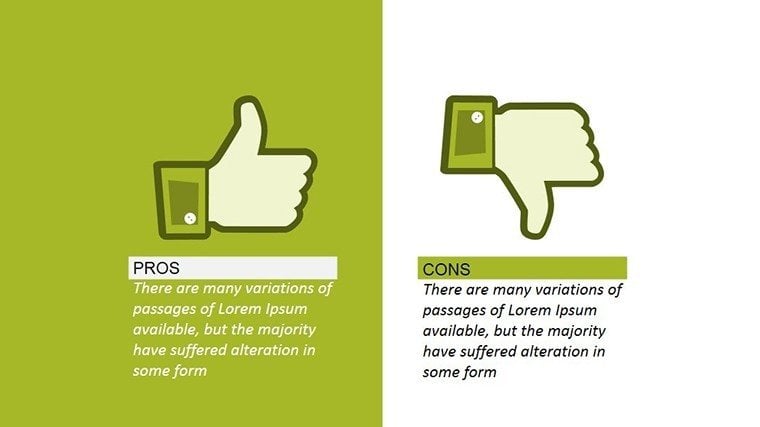
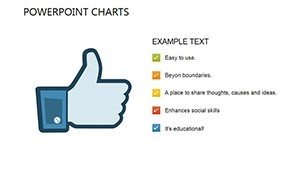
Pro tip: Pair charts with user-generated content previews - overlay follower comments on engagement graphs to humanize data. Add levity with captions like "When Your Post Goes Viral: From Likes to Leases," easing into tough metrics discussions. Always prioritize accessibility: alt-text your icons for inclusive decks.
Transform scattered likes into structured success - download today and watch your network expand like a cantilevered span.
Frequently Asked Questions
How does this template cover different social platforms?
It dedicates slides to major types - visual (Instagram), professional (LinkedIn), short-form (TikTok) - with charts comparing features like algorithm reach for architecture-specific content.
Can I edit the data sources?
Yes, charts support direct Excel links or manual entry, ideal for updating with real-time social metrics from tools like Buffer.
Is it suitable for educational presentations?
Perfectly - use it to illustrate network dynamics in lectures on digital fabrication, with editable examples for student customization.
Are there animations included?
Subtle transitions animate data reveals, customizable to pace your delivery on topics like viral urban design trends.
What file formats are supported?
Native .pptx for PowerPoint, with export options to Google Slides or PDF for versatile sharing in firm meetings.
How many slides does it have?
25 comprehensive slides, expandable via duplication for in-depth dives into niche networks like Behance for creatives.