Promo code "00LAYOUTS"
Business Ideas Charts: PowerPoint Slides
Every groundbreaking business starts with a spark - an idea that, when pitched right, ignites empires. But in the idea economy, where 80% of ventures falter on communication (per CB Insights), your visuals must fan those flames. Our Business Ideas PowerPoint Slides template, with 24 innovative charts, is the bellows you need. Aimed at visionary entrepreneurs, product managers, and innovators brainstorming breakthroughs, this set turns nascent notions into narrative gold.
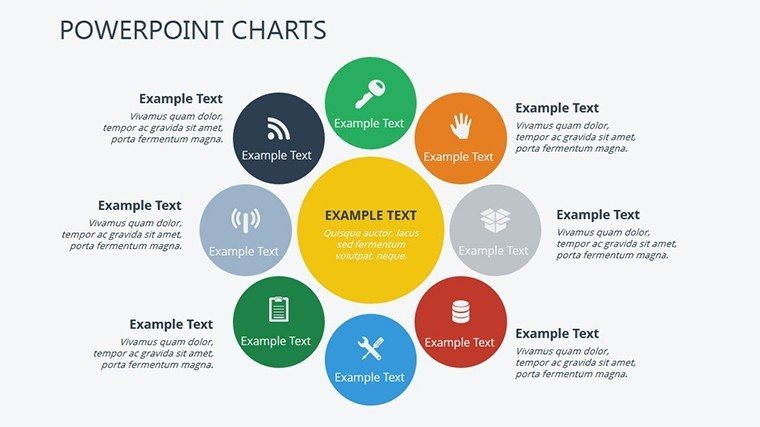
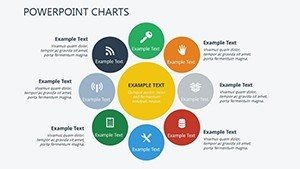
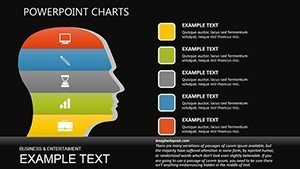
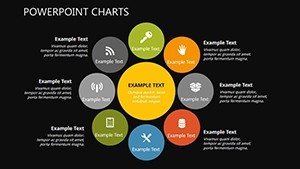
Channeling creativity from IDEO's design thinking ethos and visualization tactics from "The Back of the Napkin" by Dan Roam, these slides sketch ideas with surgical clarity. Bubble maps for concept clustering, mind-map matrices for interconnection - each editable in PowerPoint or Google Slides, fostering ideation that's as fluid as your flow state. Customize with thematic doodles or data overlays, making abstract ideas palpably possible.
Case in point: A fintech startup wielded our idea validation slide to crystallize their app's USP, landing partnerships that scaled them to unicorn status. Say goodbye to sketchy notebooks; hello to structured sparkle, with modular designs that evolve as your ideas do.
Ideation Illuminated: Charting Creative Currents
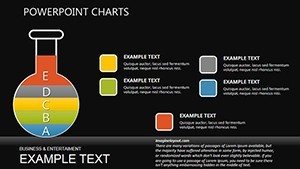
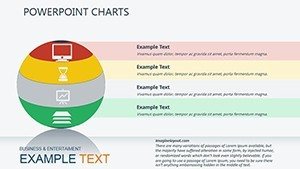
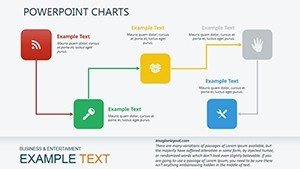
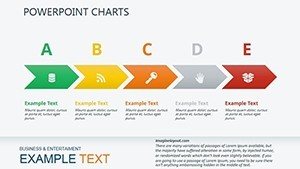
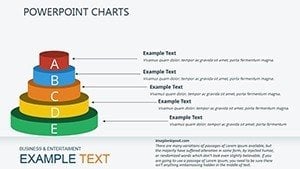
Curated for the creative churn: Slides 1-6 brainstorm basics with affinity diagrams, grouping gems from chaos. Build in Slides 7-16 with prototype visuals - wireframe placeholders and feasibility funnels that prototype pitches on the fly. Synthesize in Slides 17-24 with impact projections, like venture viability radars scanning for scalability stars.
This arc mirrors the double-diamond design process, widening for exploration then narrowing for execution. Subtle icons add whimsy - a lightbulb cluster here, a puzzle piece there - while clean lines keep it pro.
Innovative Features for Idea Architects
- Modular Magic: Snap-together sections for hybrid charts, blending mind maps with metrics on demand.
- Idea Icon Vault: 75+ whimsical yet professional symbols, from gears to galaxies, to symbolize sparks.
- Dynamic Prototyping: Layered builds for "what-if" scenarios, animating evolution in real-time.
- Export Ecosystem: From storyboard PDFs to interactive HTML, idea-sharing made simple.
These ignite per Stanford d.school findings: Visual brainstorming triples idea quality.
Pitching Ideas: From Brainwave to Buy-In
Founders frame MVPs (Slide 12) with user journey maps, mirroring Dropbox's viral explainer success. PMs prototype features (Slide 8), aligning teams like in Spotify's squad model. Innovators ideate sustainability (Slide 20), greenlighting eco-ventures.
Primer: Jot core concepts in text boxes, link to supporting stats, then animate connections for "aha" moments. Edges out defaults with embedded empathy maps, humanizing ideas from inception.
Vibrant Venues for Visionaries
- Food Tech: Flavor profile bubbles (Slide 4) taste-test concepts for market fit.
- EdTech: Learning loop matrices (Slide 15) cycle feedback into refined curricula.
- Social Impact: Change cascade charts (Slide 22) ripple effects for grant wins.
Inspired by ideated impacts, these fuel fresh frontiers.
Brainstorm Boosters: Tips with Twist
Embrace constraints: Limit slides to three ideas per chart for focus fire. Add a dash of humor - label a "wild card" bubble "Moonshot or Misfire?" - to loosen limbs. Prioritize semantic markup for voice-over compatibility, embracing universal design.
Mesh with Miro for virtual whiteboarding, where slides seed sessions. Yield: Ideas that don't fade but flourish into fortunes.
Unleash your ingenuity: Download Business Ideas PowerPoint Slides today and blueprint brilliance. Creativity calls - answer it.
Frequently Asked Questions
What charts aid early ideation?
Affinity and mind maps, clustering chaos into clarity.
Support for collaborative editing?
Yes, Google Slides harmony for team tinkering.
Total slides and flexibility?
24 flexible frames, remixable for your muse.
For solo or group brainstorming?
Scales seamlessly, from lone wolf to wolf pack.
Include validation frameworks?
Indeed - feasibility and MVP canvases aboard.

