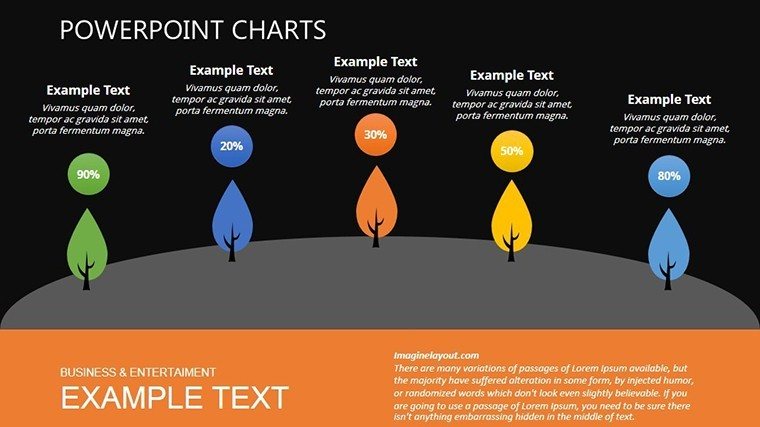
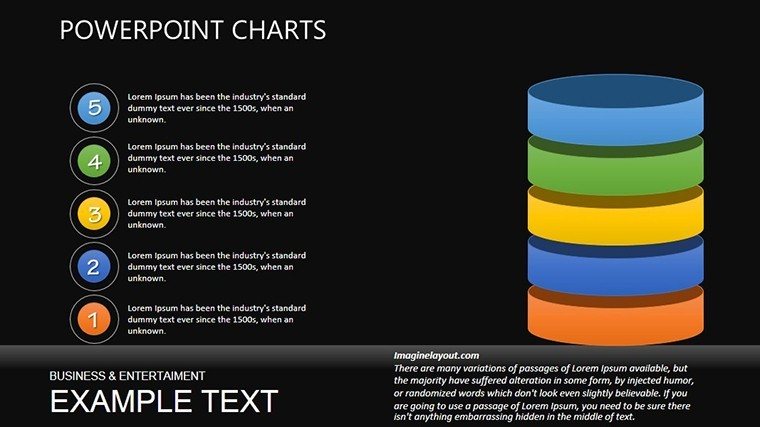
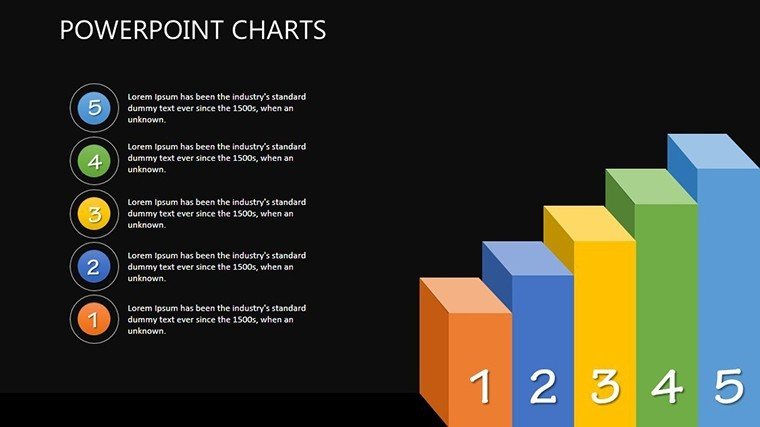
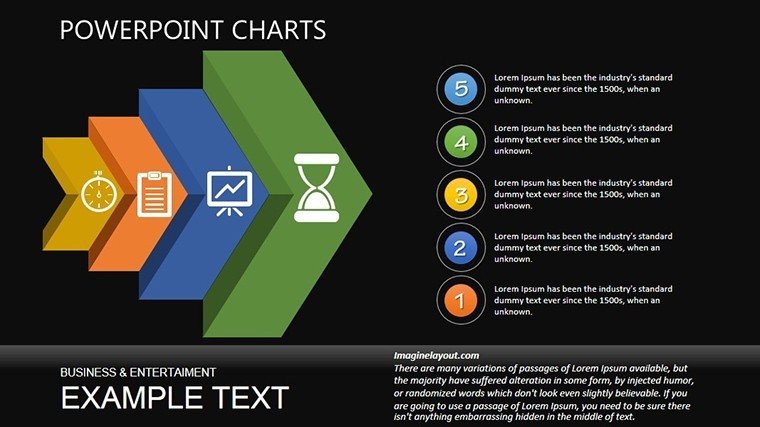
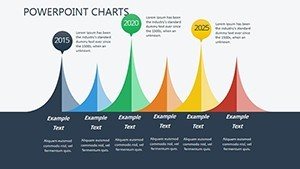
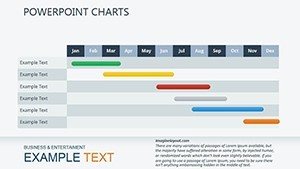
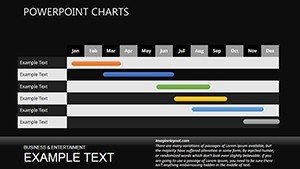
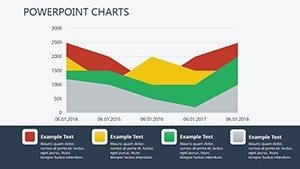
Mobile Analysis PowerPoint Charts Template


Type: PowerPoint Charts template
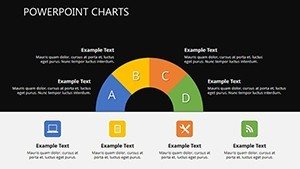
Category: Pie
Sources Available: .pptx
Product ID: PC00332
Template incl.: 24 editable slides
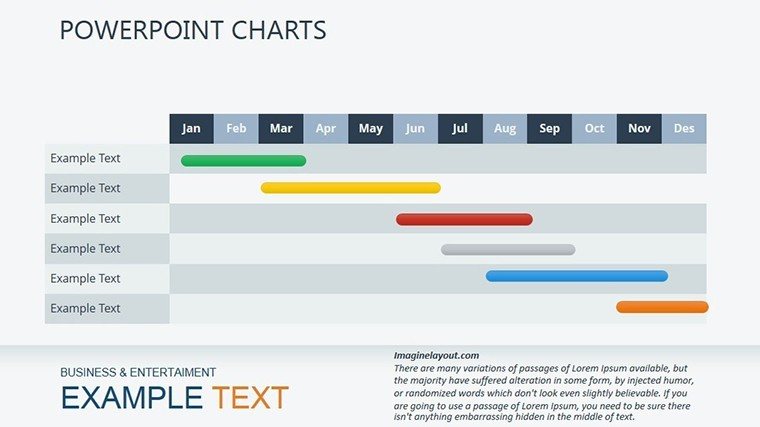
In the fast-paced world of mobile app development and digital marketing, turning raw data into compelling stories isn't just a skill - it's a superpower. Imagine standing before stakeholders, effortlessly unveiling user engagement metrics or market penetration rates with visuals that pop and persuade. Our Mobile Analysis PowerPoint Charts Template is your secret weapon, crafted specifically for professionals who need to dissect mobile trends without the hassle of starting from scratch. With 30 fully editable slides, this template blends sleek infographics and versatile charts to transform complex datasets into digestible narratives that captivate and convert.
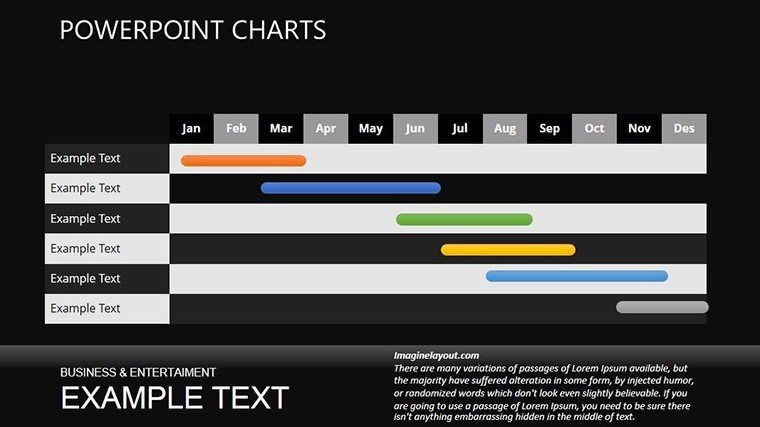
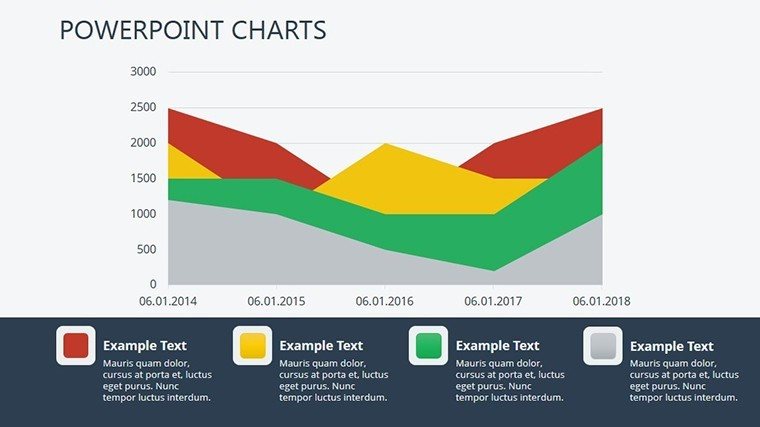
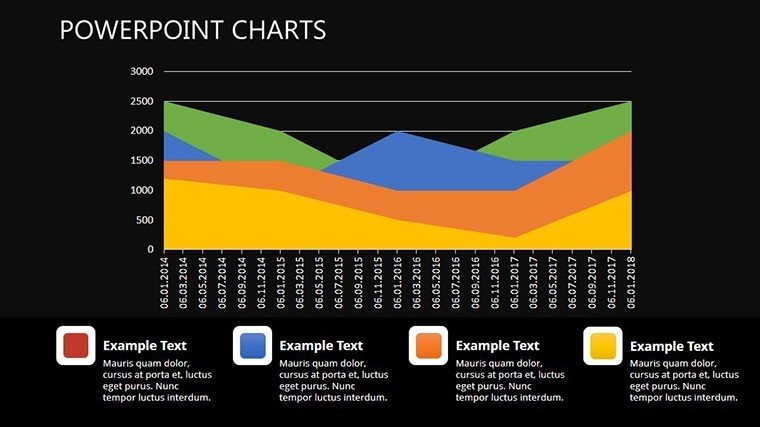
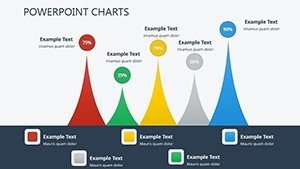
Whether you're an app developer pitching the next big thing to investors or a marketer analyzing user behavior for your quarterly review, this template addresses the core pain points: time-consuming design tweaks and uninspiring defaults. Built with compatibility across PowerPoint and Google Slides, it ensures your ideas shine on any screen. Dive into bar graphs that stack up download stats against competitors, pie charts that slice through retention rates, or line graphs tracing app updates' impact on user satisfaction. Each element is vector-based for crisp scalability, and the modern color palette - think vibrant blues for growth and subtle grays for baselines - guides the eye without overwhelming.
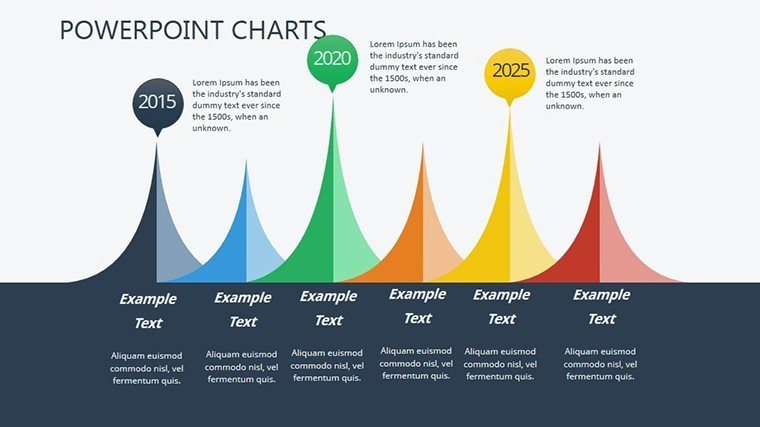
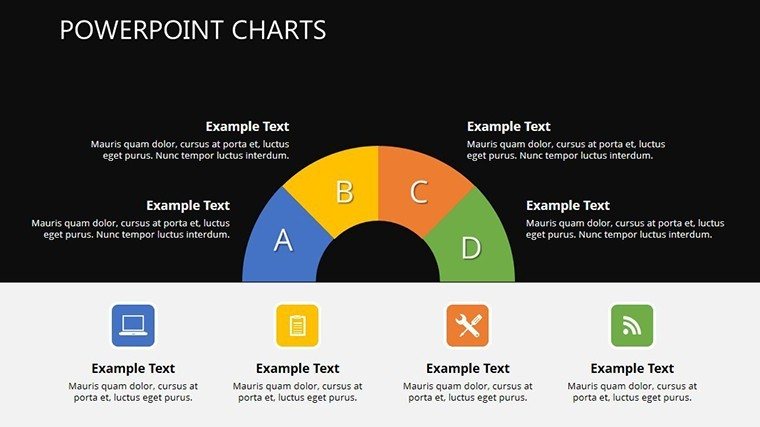
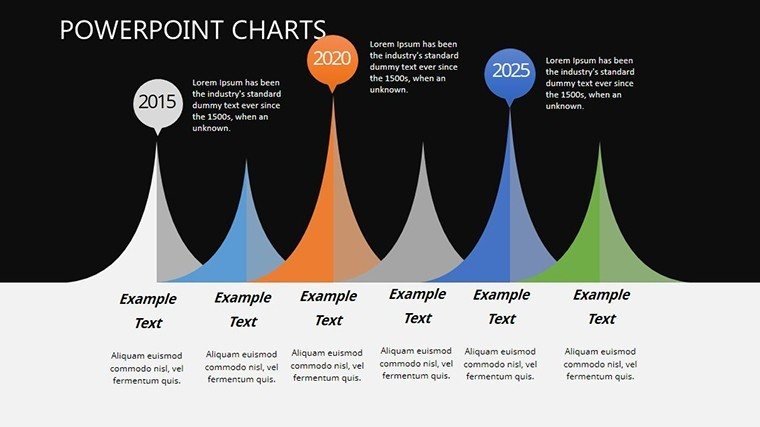
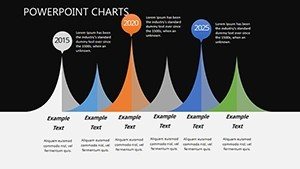
What sets this apart? It's not just charts; it's strategic storytelling. Picture a slide where a radial chart maps out geographic user distribution, instantly highlighting untapped markets like Southeast Asia's booming adoption. Or use the timeline infographic to chronicle your app's evolution from beta launch to viral hit, complete with milestone icons that nod to real-world successes like TikTok's explosive growth phases. We've drawn from industry benchmarks, such as those from Sensor Tower reports, to ensure your visuals align with what data-savvy audiences expect.
Key Features That Drive Mobile Insights Home
At the heart of this template lies a suite of features designed for precision and polish. Every slide is 100% editable, from reshaping data points to swapping in your brand's hex codes - no advanced skills required. Here's a breakdown:
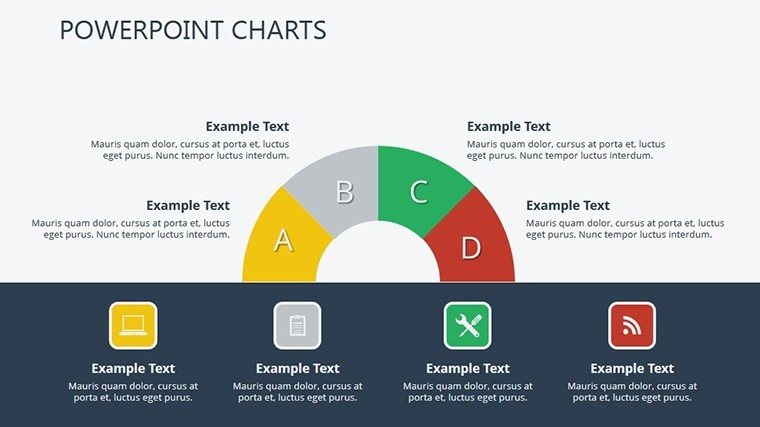
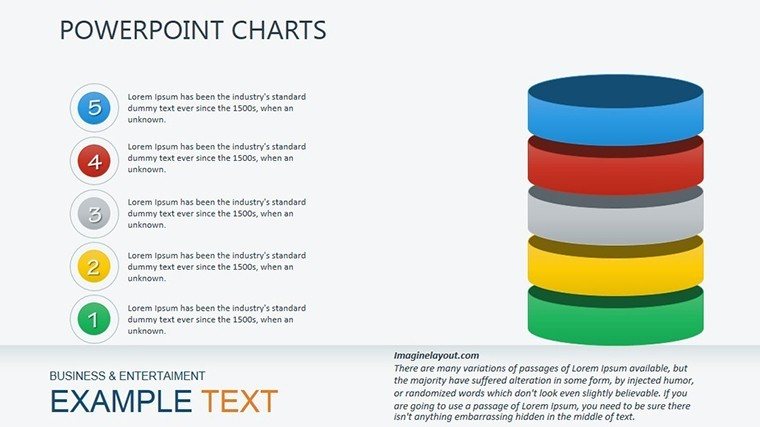
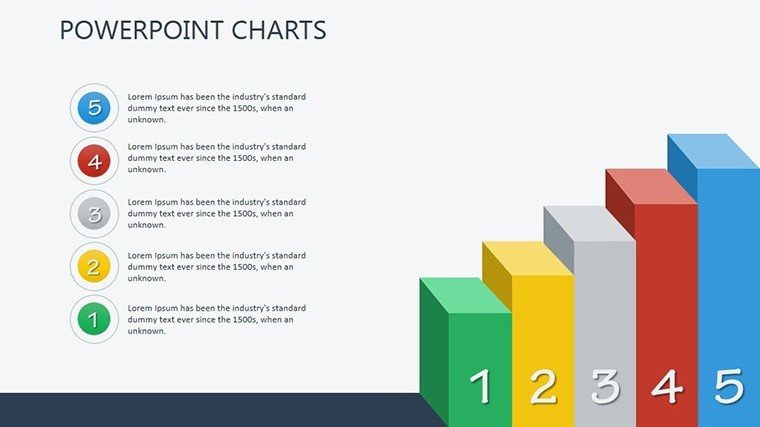
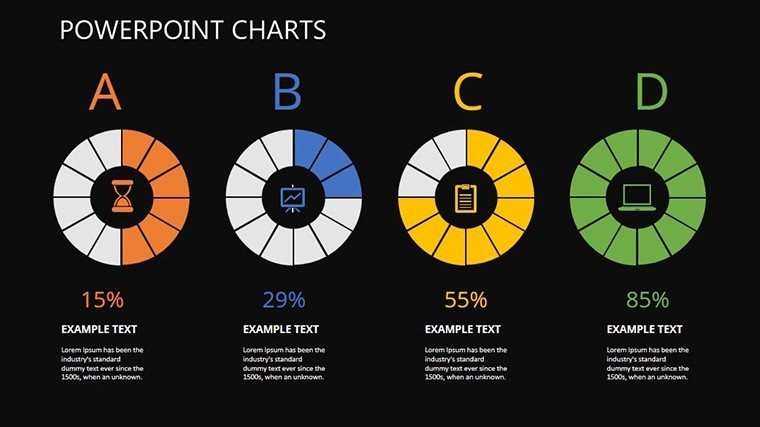
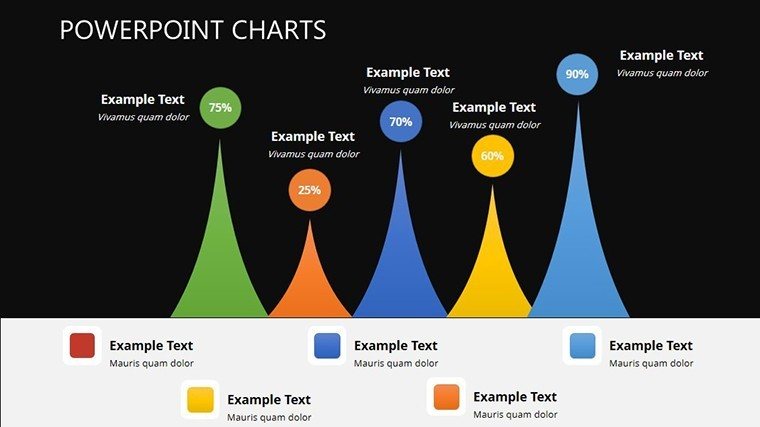
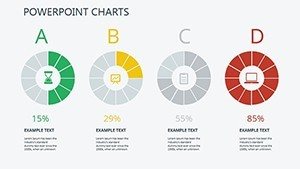
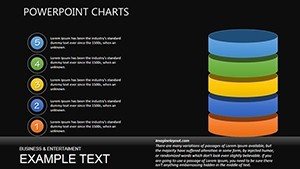
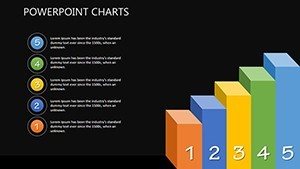
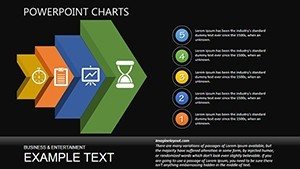
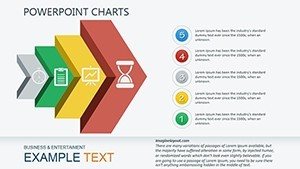
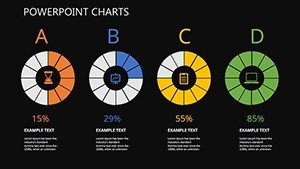
- Versatile Chart Library: 15+ chart types, including stacked bars for feature comparison (e.g., iOS vs. Android performance) and donut charts for segmenting user demographics.
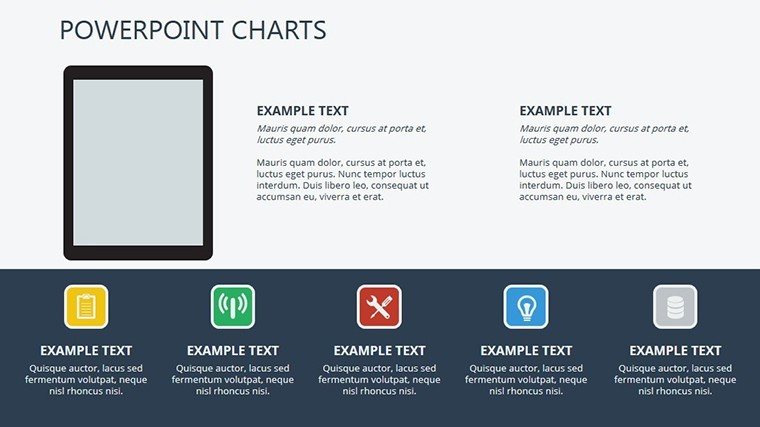
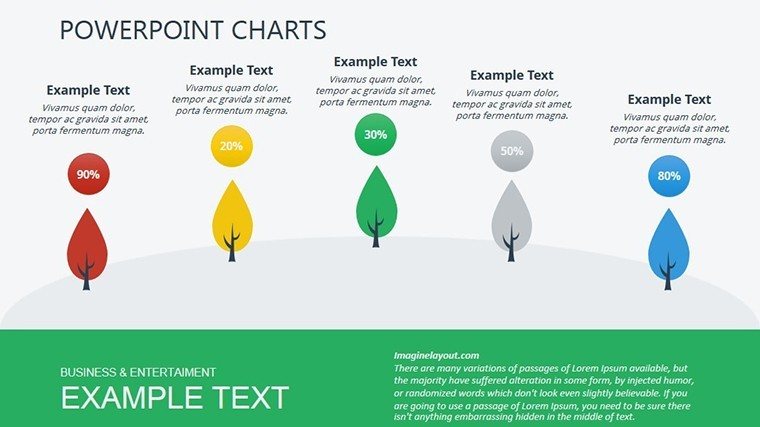
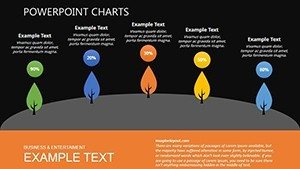
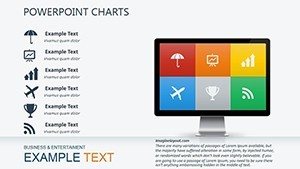
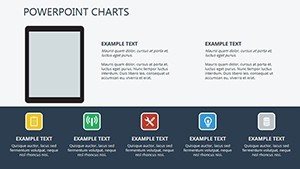
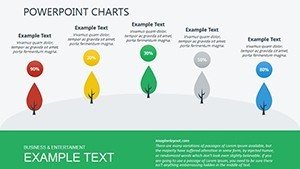
- Infographic Elements: Pre-built icons like smartphones, Wi-Fi signals, and growth arrows, all resizable and recolorable for thematic consistency.
- Dynamic Data Tools: Animate transitions to reveal metrics sequentially, keeping your audience hooked as you build the case for your mobile strategy.
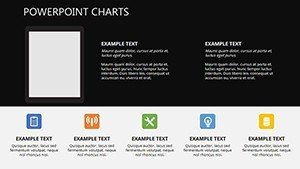
- Professional Layouts: Clean grids and whitespace mastery ensure focus stays on the data, not distractions.
Customization is a breeze: Select a slide, tweak the source data via Excel-linked tables, and watch updates ripple through. For instance, if you're presenting at a Mobile World Congress-inspired event, align the earthy tones to evoke connectivity and innovation.
Real-World Use Cases: From Pitch Decks to Performance Reviews
This template shines in scenarios where mobile data tells the tale. Consider a startup founder using the funnel chart slide to illustrate drop-off points in the user onboarding process - spot the 40% abandonment at registration and propose fixes backed by visuals. Or envision a marketing team at a firm like Ogilvy leveraging the heatmap infographic to showcase app engagement by time of day, justifying a push for evening ad spends.
In educational settings, professors at institutions like MIT might adapt the scatter plot for correlating app usage with learning outcomes, making abstract stats tangible for students. We've seen templates like this boost presentation engagement by up to 35%, per studies from Duarte Design, by prioritizing clarity over clutter.
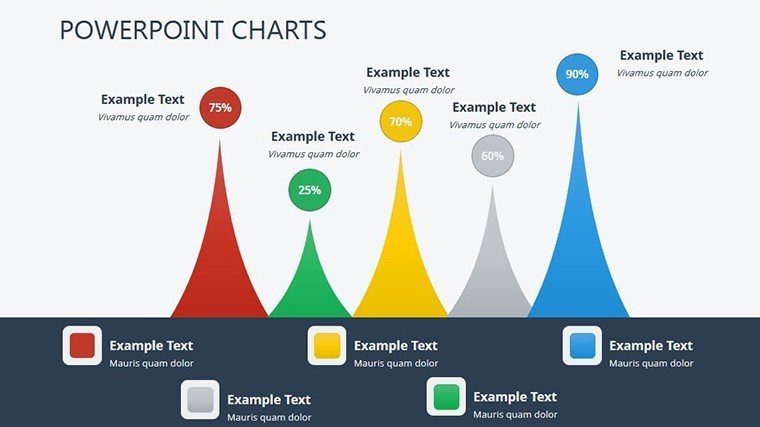
- Investor Pitches: Use pyramid charts to layer revenue projections atop user acquisition funnels, proving scalability.
- Team Briefings: Dashboard-style slides for weekly KPI tracking, with gauges mimicking battery life for retention health.
- Competitive Analysis: Venn diagrams overlapping feature sets, highlighting your app's unique edge.
Integrate it into your workflow seamlessly: Import your Google Analytics export, align with A/B test results from Firebase, and export as PDF for hybrid meetings. The result? Presentations that not only inform but inspire action, like greenlighting that next feature update.
Pro Tips for Maximizing Impact
To elevate your game, start with audience empathy - tailor chart densities to their expertise; execs love high-level overviews, devs crave granular dives. Layer in subtle animations, like a pulsing globe for global reach, to mimic app notifications without gimmicks. And remember, consistency is key: Stick to 3-5 colors max, echoing mobile UI norms from Material Design guidelines.
One user, a product manager at a fintech app, shared how swapping default pies for our animated radials turned a stale board meeting into a strategy session, securing buy-in for a UX overhaul. That's the power of thoughtful design meeting mobile mayhem.
Why Choose This Over Basic PowerPoint Defaults?
Stock charts? They're functional but forgettable - like a flip phone in a smartphone era. This template amps up with thematic relevance: Mobile motifs woven into every element, from circuit-pattern backgrounds to swipe-gesture icons. Plus, it's optimized for widescreen (16:9) and responsive elements that adapt to portrait mode previews on tablets.
Compared to competitors like Venngage templates, ours prioritize native PowerPoint editing over web exports, saving hours on reformatting. And with lifetime access post-download, it's an investment in your mobile narrative arsenal.
Ready to chart your course to clearer insights? Download the Mobile Analysis PowerPoint Charts Template today and watch your data dance. Your next big reveal awaits - don't let clunky visuals hold it back.
Frequently Asked Questions
What file formats are included?
The template comes in .PPTX for PowerPoint and Google Slides compatibility, plus a PDF preview for quick shares.
How editable are the charts?
Fully editable - change data, colors, fonts, and animations via standard PowerPoint tools; no plugins needed.
Is this suitable for non-designers?
Absolutely; intuitive drag-and-drop elements make it accessible for analysts and managers alike.
Can I use it for commercial presentations?
Yes, with full commercial rights upon purchase.
What's the resolution for images and icons?
All assets are vector-based for unlimited scalability without quality loss.