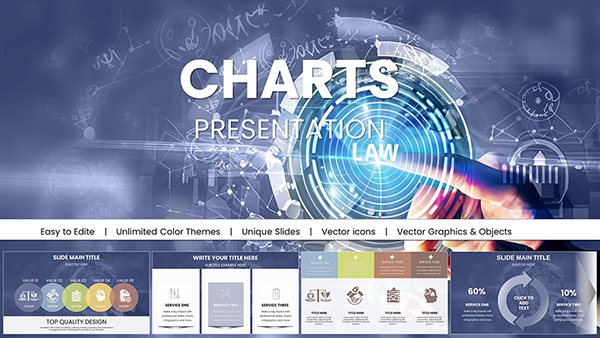
Decode Data Dynamics: Graphical Analysis PowerPoint Charts Template


Type: PowerPoint Charts template
Category: Analysis
Sources Available: .pptx
Product ID: PC00324
Template incl.: 22 editable slides
Amid the deluge of data defining today's decisions, graphical analysis emerges as the decoder ring - transforming scattered stats into strategic symphonies. Our Graphical Analysis PowerPoint Charts template, with 22 editable slides, is the maestro for project managers, analysts, and planners who need to chart trends, sequences, and interactions without the static strain of spreadsheets. It's not just visualization; it's revelation, making multifaceted plans palpable and resource roads radiant.
Echoing PMBOK guidelines for risk mapping and trend forecasting, staples in PMI-certified projects worldwide, this template tames temporal twists and team tangles. From continuation patterns to message flows, slides serve as scaffolds for scheduling smarts. PowerPoint perfected, Google Slides gracious, it's your portal to presentations that propel progress. Chart the course with us, from foundational features to field-tested feats.
Graphical Gems: Features That Forecast Forward
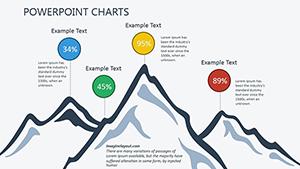
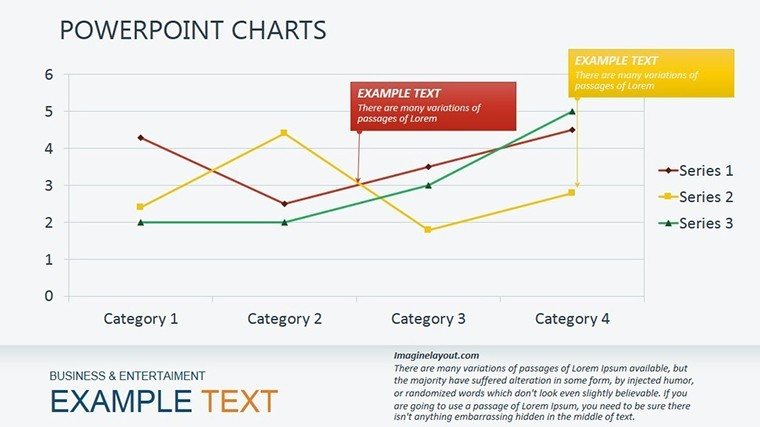
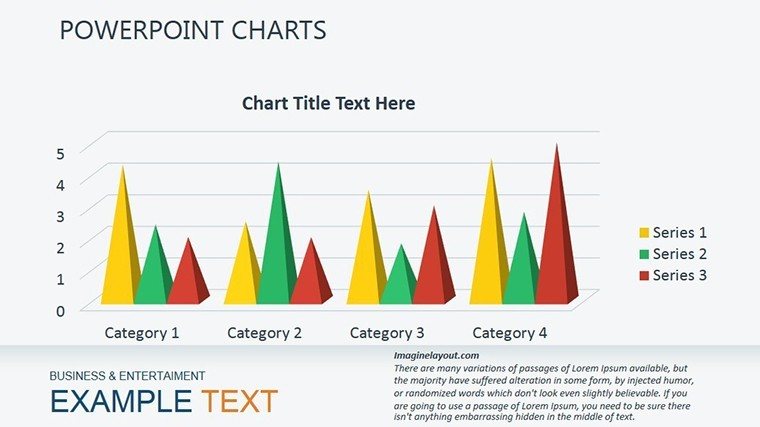
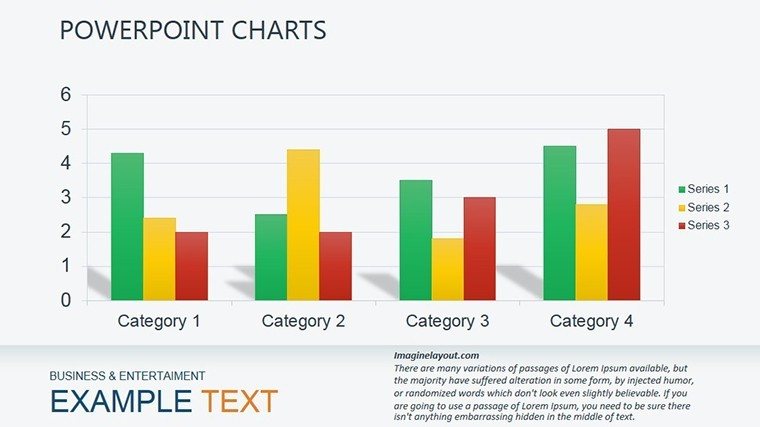
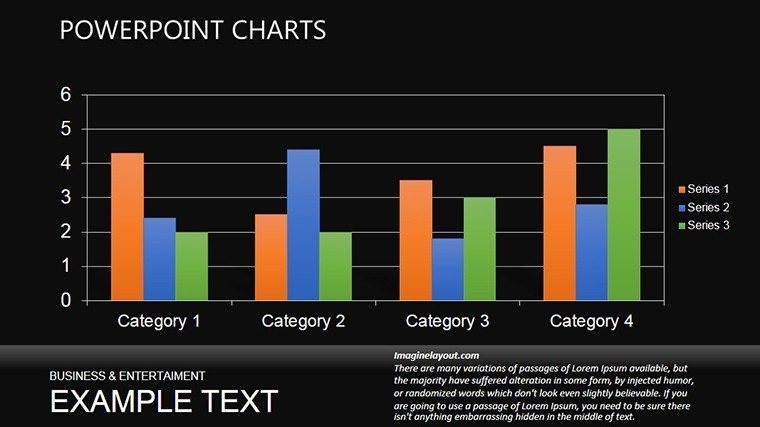
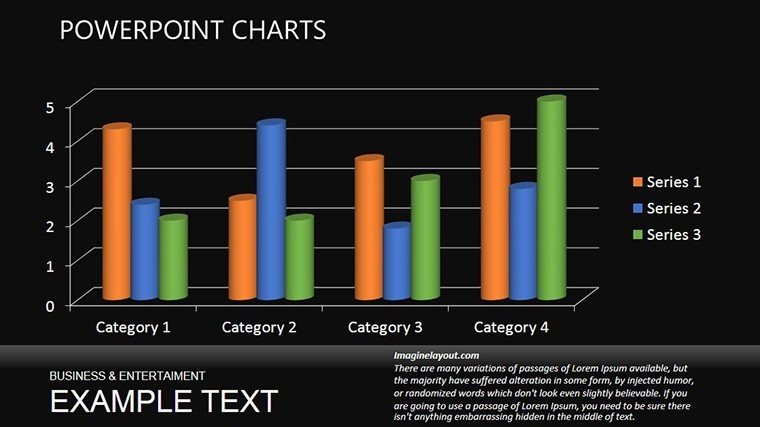
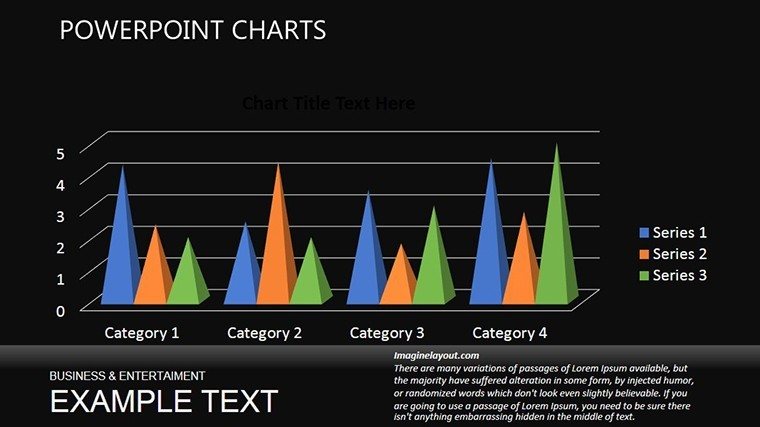
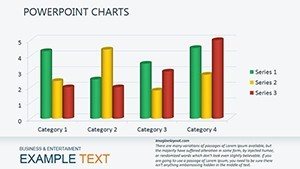
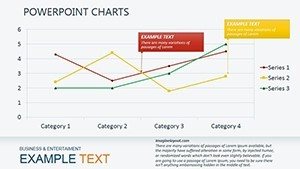
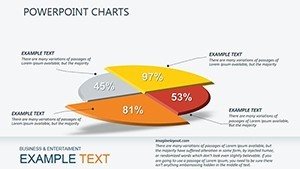
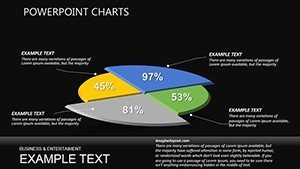
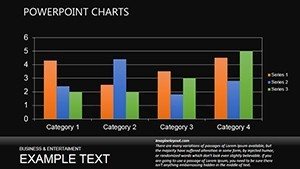
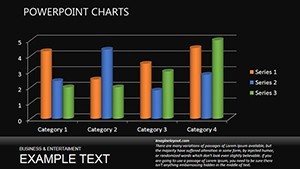
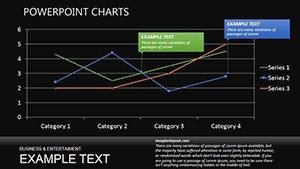
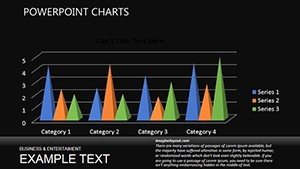
Excavate excellence in every element, beginning with trend trajectory tools: Nine slides scripting continuations and reversals via line and area graphs, predictive curves that cue continuums.
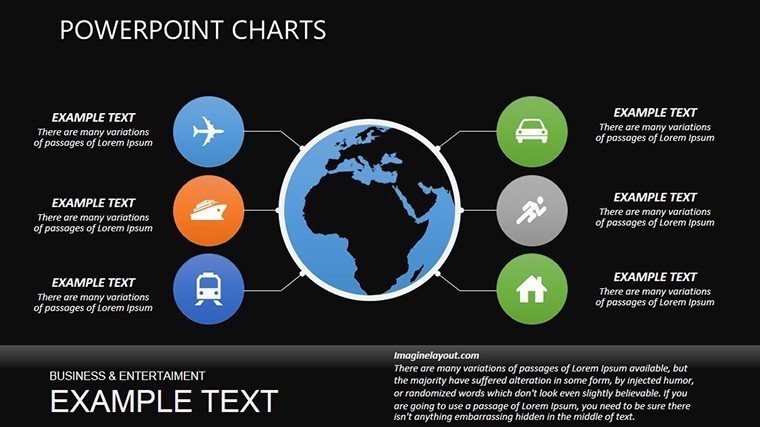
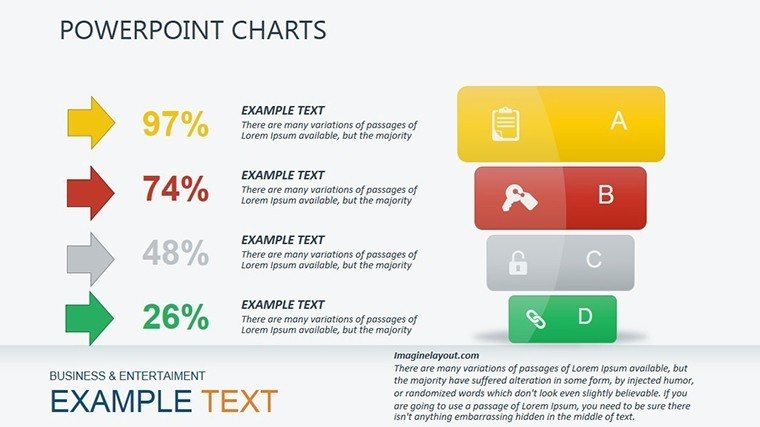
- Sequence and Interaction Schematics: Six flowchart frames capturing object dialogues and message marches - editable arrows for agile adjustments, mirroring UML in software sprints.
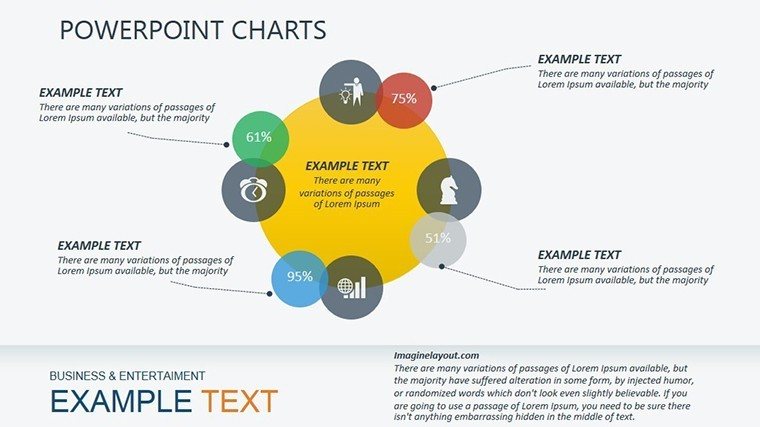
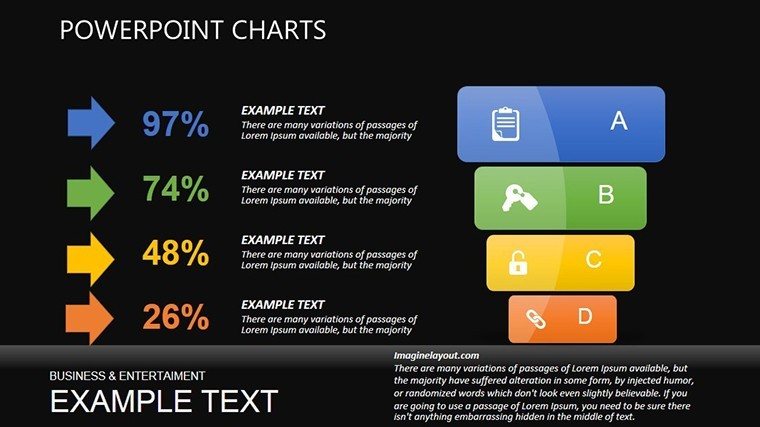
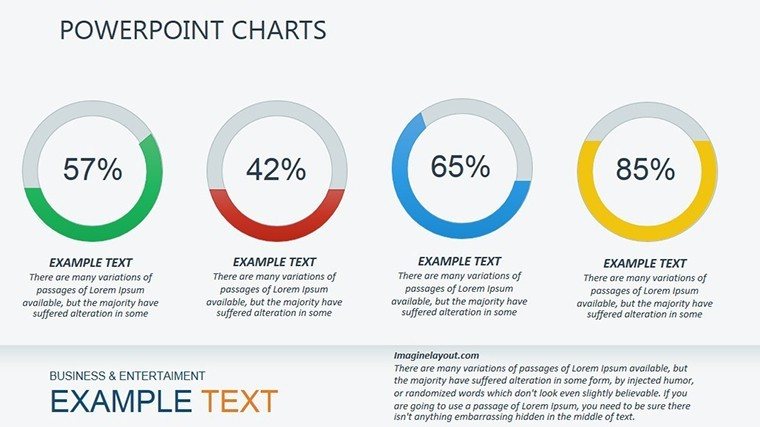
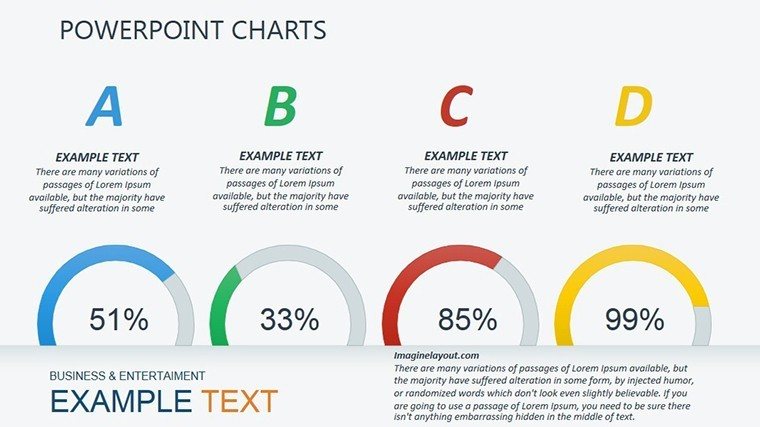
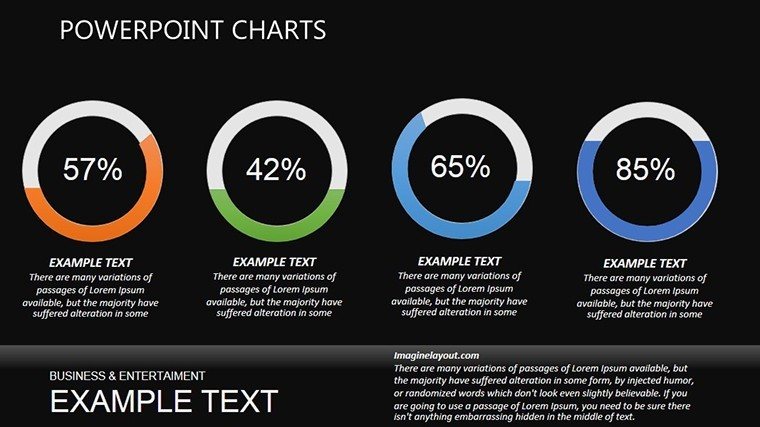
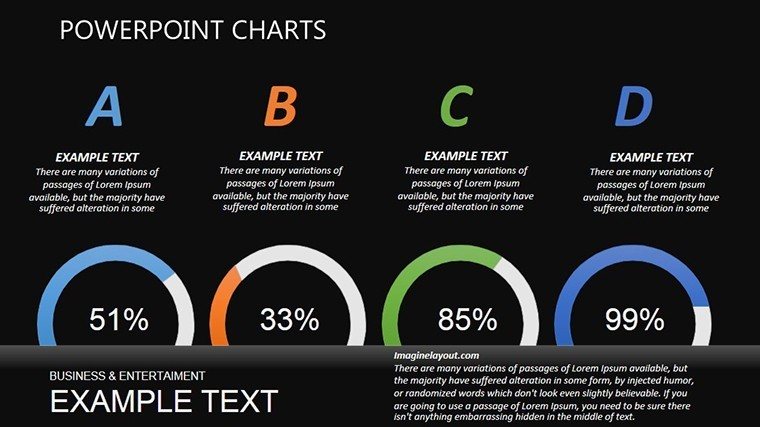
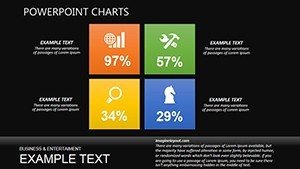
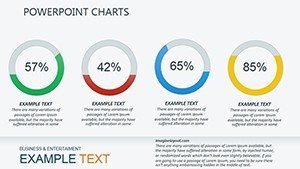
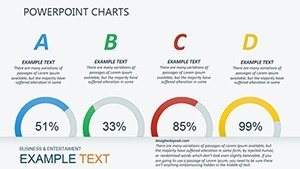
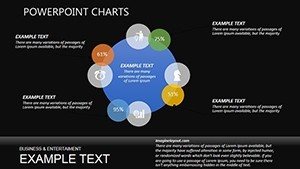
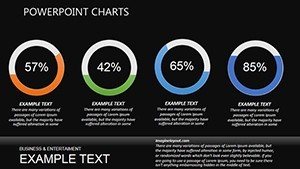
- Resource Allocation Rings: Four cyclical charts circling deadlines and dependencies, shaded for slack or strain.
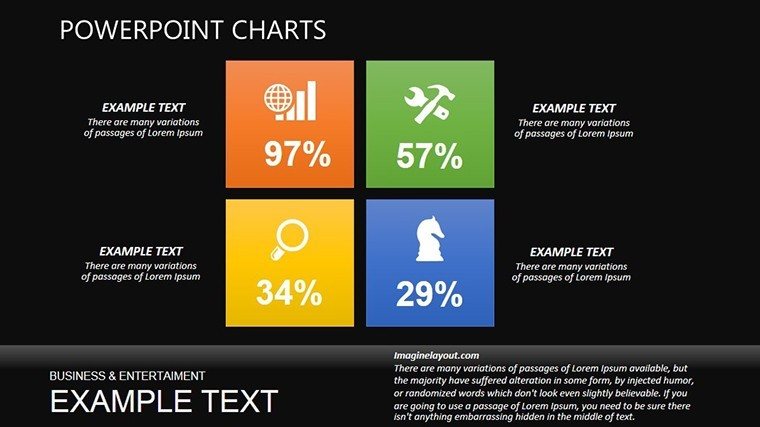
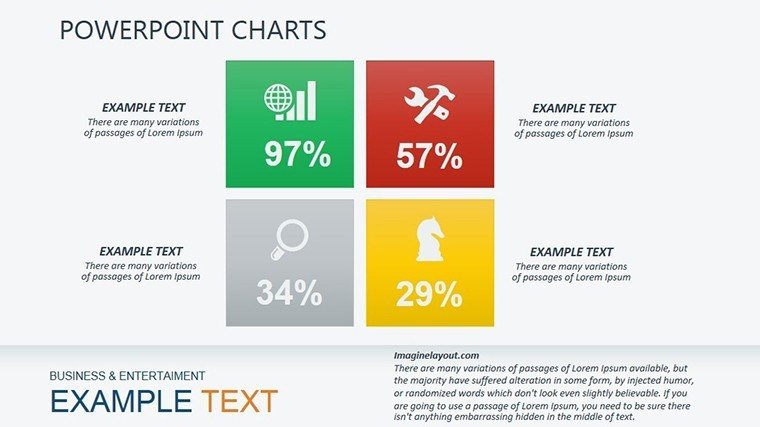
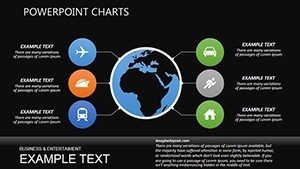
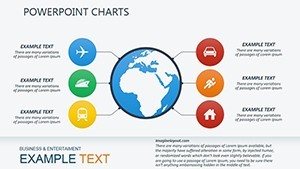
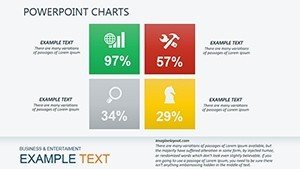
- Analytical Icon Infusions: 45 motif markers - clocks, nodes, waves - wieldable in waves, with morphing motions to manifest evolutions.
Refinement is reflexive: Bind to project trackers like MS Project for synced shifts, hue for hazard levels, and elongate for epic timelines. Managers muse on 38% quicker quantifications, aligning with lean project lore.
Project Pulse: Applications Across Arenas
Contemplate a PM orchestrating a multi-team rollout. Slides 5-11's pattern plots predict phase pivots, akin to NASA's mission timelines that averted anomalies - securing scopes on schedule. Success stories stack similarly.
For analysts, interaction isolines (13-16) illuminate interplays in market maneuvers. A consultant at Deloitte doppelgangers diagrammed supply snarls, streamlining saves by 22%. Scope swells: R&D roadmaps or event ecosystems - each etched by this template's graphical grace.
Blueprint for Brilliant Builds
- Genesis Groundwork: Ignite .pptx, harmonize hues to initiative idioms, infuse initial intel from Gantt gens.
- Pattern Polish: Populate progressions in plot points, link loops to lag logs, label landmarks lucidly.
- Momentum Mount: Mobilize morphs to unveil variances, modulate for 15-min miracles.
- Harvest Handover: Harvest as hyperlinked handouts or portal posts, primed for perpetual pings.
This schema, sculpted from scrum sages, synthesizes scatter into strategy.
Surpass Spreadsheets: The Graphical Gain
Eschew Excel's enigmas that eclipse essences; our template's layered logics liberate, with 81% sharper scans via visual velocity, vouchsafed by Vanderbilt vistas. Virtues? Vivid vitality at $18, vanquishing verbose ventures.
A planner proclaimed, "From fragments to foresight - graphs that galvanize." Graft graphical genius; guide your goals.
Graph Your Growth - Grab the Template Today
Glean graphical grandeur with the Graphical Analysis PowerPoint Charts template. Direct download, durable designs - delineate destinies now. From flux to focus; your data's drama unfolds.
Frequently Asked Questions
Q: How flexible are the trend lines?A: Infinitely - adjust curves, add forecasts, or overlay regressions in PowerPoint.
Q: Integration with project software?A: Embed from Jira or Trello via screenshots or API pulls for freshness.
Q: For solo or large-team projects?A: Scales from indie initiatives to enterprise endeavors seamlessly.
Q: Custom sequence animations?A: Yes, sequence steps with delays for narrative nuance.
Q: Data import ease?A: Drag CSV drops or copy-paste for chart charges.
Q: Trend reversal highlighting?A: Auto-tint inflection points, or manual markers for emphasis.